Abstract
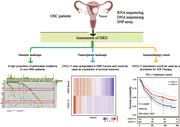
Ovarian cancer patients with homologous recombination deficiency (HRD) tumors would benefit from PARP inhibitor (PARPi) therapy. However, patients with HRD tumors account for less than 50% of the whole cohort, so new biomarkers still need to be developed. Based on the data from the SNP array and somatic mutation profiles in the ovarian cancer genome, we found that high frequency of actionable mutations existed in patients with non‐HRD tumors. Through transcriptome analysis, we identified that a downstream target of the cGAS‐STING pathway, CXCL11, was upregulated in HRD tumors and could be used as a predictor of survival outcome. Further comprehensive analysis of the tumor immune microenvironment (TIME) revealed that CXCL11 expression signature was closely correlated with cytotoxic cells, neoantigen load and immune checkpoint blockade (ICB). Clinical trial data confirmed that the expression of CXCL11 could be used as a biomarker for anti‐PD‐1/PD‐L1 therapy. Finally, in vivo and in vitro experiments showed that cancer cells with PARPi treatment increased the expression of CXCL11. Collectively, our study not only provides biomarkers of ovarian cancer complementary to the HRD score but also introduces a potential new perspective for identifying prognostic biomarkers of immunotherapy.
Keywords: cGAS‐STING, CXCL11, HRD, ovarian cancer, PARPi, TIME
• There is a high proportion of actionable gene mutations in HR proficient patients with OSC.
• A downstream target of the cGAS‐STING pathway, CXCL11, was upregulated in HRD tumors and could be used as a predictor of survival outcome.
• CXCL11 can be used as a biomarker for immunotherapy.
Abbreviations
- CNV
copy number variation
- CXCL11
C‐X‐C motif chemokine 11
- DEGs
differentially expressed genes
- GEO
Gene Expression Omnibus
- GSEA
gene set enrichment analysis
- HR
homologous recombination repair
- HRD
homologous recombination deficiency
- ICB
immune checkpoint blockade
- LOH
loss of heterozygosity
- LST
largescale state transitions
- MSI
microsatellite instability
- OSC
ovarian serous cystadenocarcinoma
- PARPi
PARP inhibitor
- TAI
telomeric allelic imbalance
- TCGA
the Cancer Genome Atlas
- TIME
tumor immune microenvironment
- TPM
transcripts per million
1. INTRODUCTION
The incidence rate of ovarian cancer ranks third among female genital tract malignancies, but its mortality rate ranks first. 1 About 70% of ovarian cancer patients have advanced cancer at the time of initial diagnosis, as there are no obvious symptoms in the initial stage of ovarian cancer. 2 Ovarian serous cystadenocarcinoma (OSC), a common type of ovarian cancer, accounts for about 90% of all ovarian cancers 3 and it is prone to peritoneal metastasis early and chemotherapy resistance. According to statistics, the 5‐year survival rate of ovarian cancer patients is only 30–45%. 4 The major reason for the poor prognosis of ovarian cancer is lack of effective means of early diagnosis and prognostic indicators. Discovering specific biomarkers for early screening of ovarian cancer and new therapeutic targets for ovarian cancer are the current focus of ovarian cancer research.
Emerging clinical trials have revealed the clinical value of homologous recombination deficiency (HRD) in ovarian cancer. Homologous recombination repair (HR) plays an important role in DNA repair mechanisms. BRCA (BRCA1/2), RAD51 (RAD51B/C/D), BRIT1, etc. are key components of HR‐mediated DNA repair. 5 , 6 , 7 HRD tumors were recorded for the first time in patients that harbored germline mutations of BRCA gene. In the phase 3 PAOLA‐1 (PAOLA‐1/ENGOT‐ov25) trial, the addition of maintenance olaparib provided a significant progression‐free survival benefit, which was substantial in patients with HRD tumors, including those without a BRCA mutation. 8 The molecular mechanism of HRD is not fully understood. Current studies have found that mutations in genes, including BRCA gene mutations, involved in the HR signaling pathway can only explain about 14.1% of HRD ovarian cancer patients. 9 Therefore, research on transcriptome characteristics of HRD patients may fill this gap. Although several studies have investigated the relationship between the transcriptome and tumor genome instability, 10 , 11 HRD‐associated RNAs and their clinical significance in ovarian cancer still remain largely unexplored. Moreover, HRD is present in less than 50% of serous ovarian tumors, 12 so new biomarkers need to be developed for molecular typing of ovarian cancer patients with non‐HRD tumors.
For the first time in the present study, by taking advantage of both the Cancer Genome Atlas (TCGA)/Gene Expression Omnibus (GEO) database and the algorithm for quantifying HRD scores, we found that high frequency of actionable mutations existed in patients with non‐HRD tumors. Through transcriptome analysis, we identified and validated the C–X–C motif chemokine 11 (CXCL11) that predicted the survival and prognosis of OSC patients. Furthermore, we discovered a relationship between CXCL11 expression and tumor immune microenvironment (TIM`E), including cytotoxic cells, neoantigen load, and immune checkpoint blockade (ICB). Moreover, high CXCL11 expression was able to be used as a biomarker for anti‐PD‐1/PD‐L1 therapy, and the predictive effect of CXCL11 was better than that of PD‐1/PD‐L1. Finally, in vivo and in vitro experiments confirmed that olaparib could upregulate the expression of CXCL11 in ovarian cancer cell lines. Our research perspectives and methods provide a possible direction for molecular typing of ovarian cancer. The results of this study may be valuable for understanding the relationship between HRD and TIME and improving the clinical outcome of patients receiving anti‐PD‐1/PD‐L1 therapy.
2. MATERIALS AND METHODS
2.1. Data collection and processing
OSC patients’ RNA sequencing data, somatic mutation data, SNP array data, and corresponding clinical follow‐up information were downloaded from the publicly available TCGA database (https://portal.gdc.cancer.gov) and the NCBI GEO database. 13 RNA sequencing data were normalized as transcripts per million (TPM) by using the R. SNP array data were processed using Affymetrix Power Tools and PennCNV. The somatic mutation counts, copy number variation (CNV), fraction genome altered scores (percentage of copy number altered chromosome regions out of measured regions), and microsatellite instability (MSI) sensor score were obtained from the cBioPortal database (https://www.cbioportal.org/). In total, 348 TCGA samples data were extracted; 296 GEO samples data were extracted (GSE140082 and GSE30161). The transcriptome profile and clinical information from immunotherapy cohorts were obtained from Imvigor210. 14 , 15
2.2. HRD score analysis
Loss of heterozygosity (LOH) was defined as the number of counts of chromosomal LOH regions shorter than whole chromosome and longer than 15 Mb. 16 Largescale state transitions (LST) were defined as chromosome breakpoint (change in copy number or allelic content) between adjacent regions each of at least 10 Mb obtained after smoothing and filtering shorter than 3 Mb small‐scale CNV. 17 Telomeric allelic imbalance (TAI) was defined as the number of regions with allelic imbalance that extend to the subtelomere but do not cross the centromere. 18 The HRD score was defined as the sum of TAI, LST, and LOH scores. 19 The HRD score of each patient is shown in Table S1.
2.3. Genomic landscape and neoantigen load
The datasets of the somatic mutations for OSC in TCGA were obtained from the MC3 TCGA dataset and analyzed using the TCGA mutations package of R. 20 Somatic mutation alterations were analyzed by using the maftools package of R. 21 The four‐digit HLA type for each sample was inferred using POLYSOLVER (POLYmorphic loci reSOLVER), which uses a normal tissue .bam file as input and employs a Bayesian classifier to determine genotype. 22 By comparing to matched tumor bams, POLYSOLVER also identified HLA mutations. Neo‐epitopes were predicted for each patient by defining all novel amino acid 9mers and 10mers resulting from mutation in expressed genes (median >10 TPM in the tumor type) and determining whether the predicted binding affinity to the patient's germline HLA alleles was <500 nM using NetMHCpan. 23 , 24 , 25 , 26 The Neoantigen load of each patient is shown in Table S2.
2.4. Gene set enrichment analysis (GSEA)
RNA‐seq data (raw counts) analysis was conducted using the “edgeR” package of R. 27 Fold change >1.5, adj. p < .05, TPM >1, and genes with the first 75% of median absolute deviation were set as the cutoffs to screen for differentially expressed genes (DEGs). Heatmaps and clustering were generated using an open‐source web tool ClustVis. 28 GSEA was performed using GSEA software from the Broad Institute (MIT, Cambridge, MA) to identify differential signaling pathways in different groups. 29 The normalized enrichment score was calculated for each gene set. GSEA results with a nominal p < .05 were considered significant.
2.5. Identification of prognostic related genes associated with HRD score
Univariable Cox regression analysis was performed to select the prognostic related genes using the computing environment R with the survival package. 30 The prognosis‐related genes with a p‐value < .05 in the univariate Cox regression analysis were considered as candidate variables. The results were further analyzed through the LASSO regression approach to seek a balance between the maximization of prediction accuracy and the minimization of interpretation. 31 The screening process is shown in Figure 1.
FIGURE 1.
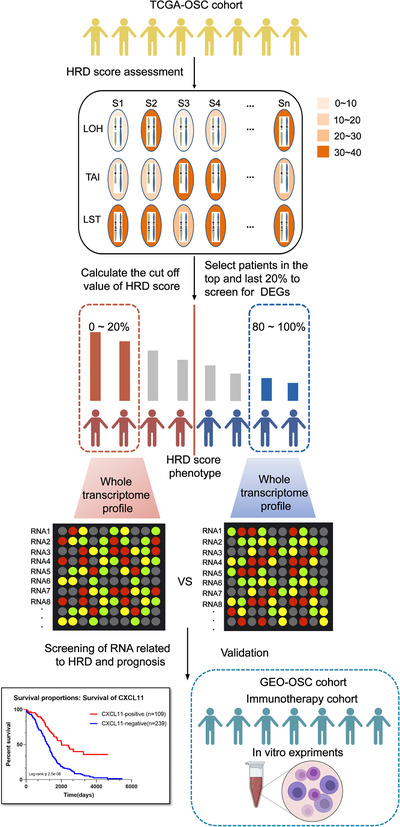
Computational overview of homologous recombination deficiency (HRD)‐related RNAs detection. Columns reflect ovarian cancer samples, and the rows reflect three biomarkers of the HRD score. Color reflects the scores for each biomarker in each sample. HRD‐related RNAs were detected by comparing the RNA expression profile between the top 20% patients with high HRD scores and the bottom 20% patients with low HRD scores
2.6. Immune cells infiltration in bulk tumor gene expression data
In order to study the enrichment of immune cells in CXCL11‐negative and CXCL11‐positive groups, we used TIMER, 32 an efficient algorithm for predicting immune cell infiltration of bulk tumor gene expression data (https://cistrome.shinyapps.io/timer/). For each sample, TIMER quantified the relative abundance of six types of infiltrating immune cells, including T cells, B cells, macrophages, neutrophiles, and dendritic cells.
2.7. Cells and culture
A2780 and A2780cisR (cisplatin resistant) human ovarian cell lines were gifts from Fudan University Shanghai Cancer Center. IOSE‐80 and HEY‐T30 ovarian cell lines originated from a gift from Dr Luopei Guo (Obstetrics and Gynecology Hospital of Fudan University). ES‐2, SKOV3, OVCAR3, and CAOV3 ovarian cell lines were purchased from GeneChem (Shanghai, China). All cell lines were cultured according to ATCC guidelines at 37°C in a 5% CO2 incubator. The olaparib (Selleck, catalog number S1060) was dissolved in DMSO, and the final concentration of DMSO in the medium was 0.1%. After the cells were plated for 24 h, cells were overlaid with (0, 2, 10, 25, 50 μM) olaparib‐conditioned medium and harvested for 24 h.
2.8. Real time‐quantitative PCR (RT‐qPCR) analysis
For cDNA synthesis, 1 μg total RNA was processed using the HiScript RT SuperMix for qPCR (+gDNA wiper) kit (Vazyme). The ChamQ Universal SYBR qPCR Master Mix (Vazyme) was used for the thermocycling reaction. The RT‐qPCR analysis was carried out in triplicate times. Primer sequences were as follows:
Beta‐ACTIN: Forward: 5′‐GTGGCCGAGGACTTTGATTG‐3′,
Reverse: 5′‐CCTGTAACAACGCATCTCATATT‐3′,
CXCL11: Forward: 5′‐GACGCTGTCTTTGCATAGGC‐3′,
Reverse: 5′‐GGATTTAGGCATCGTTGTCCTTT‐3′.
3. RESULTS
3.1. HRD score significantly correlated with the prognosis and molecular characteristics of TCGA‐OSC cohort
According to the HRD algorithm, LOH, TAI, and LST were used as the basis for calculating the HRD score. Optimal cutoff scores were determined by assessing the score that had the minimum p‐value of the log‐rank test (Figure 2A). HRD status was defined as HRD if HRD score was >57; HRD status was defined as non‐HRD if HRD score was ≤57. The Kaplan–Meier survival curve (Figure 2A) showed that overall survival (OS) of patients in the HRD group is much longer than the cases in the non‐HRD group; hazard ratio (HR) = 0.49 (0.37, 0.65), log‐rank test, p < .00001. Subsequently, we investigated the correlation between the HRD score and other hallmarks of genomic instability, including somatic mutation counts, fraction genome altered, and MSI. The median value of somatic cumulative mutations in the HRD group was significantly higher than that in the non‐HRD group (Wilcoxon signed rank test, p < .0001; Figure 2B). We next compared the fraction genome altered scores between the HRD and non‐HRD groups. As shown in Figure 2C, the fraction genome altered scores in the HRD group were higher than those in the non‐HRD group (Wilcoxon signed rank test, p < .05; Figure 2C). The plot of “somatic mutation counts versus fraction genome altered” clearly showed that the distribution of points in the HRD group was concentrated in the upper right of the coordinate system, while that of the non‐HRD group was scattered (Figure 2D). The results of transcriptome level analysis were consistent with those at the genome level: through GSEA analysis, it was found that the three signal pathways with the most significant differences between the two groups were DNA replication, homologous recombination, and mismatch repair (Figure S1A). There was no difference in the MSI status of the two groups (Figure S1B).
FIGURE 2.
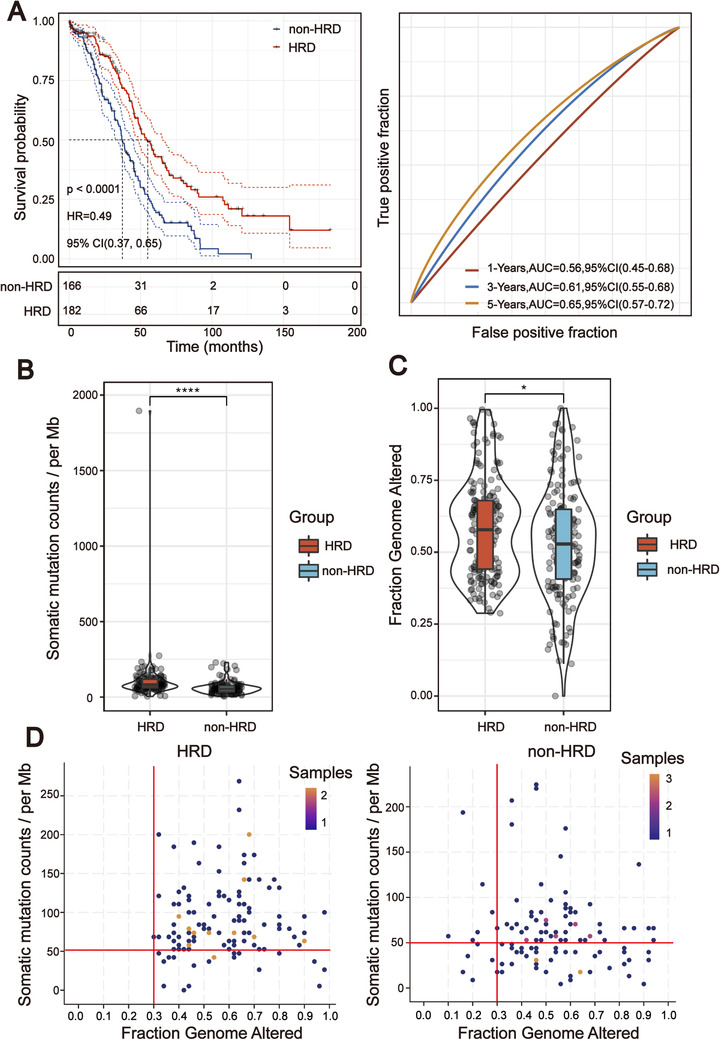
Homologous recombination deficiency (HRD) score was significantly correlated with the prognosis and molecular characteristics of TCGA‐OSC cohort. (A) Kaplan–Meier estimates of overall survival of patients with the HRD or non‐HRD tumors calculated by the HRD score in the TCGA‐OSC cohort. On the right are the AUC curves of HRD score in TCGA‐OSC cohort. (B) Violin plot of somatic mutations in the HRD and non‐HRD groups. Somatic mutation counts in the HRD group were significantly higher than those in the non‐HRD group (Wilcoxon signed rank test, ****p < .0001). (C) Violin plot of fraction genome altered in the HRD and non‐HRD groups (Wilcoxon signed rank test, *p < .05). (D) Two‐dimensional plan of fraction of the genome and somatic mutation counts in different subgroups (Kolmogorov–Simonov test, p < .01)
3.2. Genomic landscape of non‐HRD group showed a high proportion of actionable mutations in NF1 and CDK12
Genomic characteristics, such as the oncogene activation (e.g., ERBB2 amplification, EGFR tyrosine kinase mutation) and inactivation of tumor suppressor genes (e.g., MMR, BRCA1/2) have shown a strong correlation with clinical response to target therapy. Therefore, we compared the genomic mutational landscape between the HRD and non‐HRD groups. The results showed that the genomic landscape of non‐HRD group was significantly different from that of the HRD group. Only nine of the top 20 genes with the highest mutation rate in the two groups overlapped (Figure S1C). The mutational landscapes of these two subgroups displayed a distinct mutation ratio in TP53 (94.0% [non‐HRD] vs. 62% [HRD]), and the mutation classification of the non‐HRD group was more abundant, including a higher proportion of frameshift del, nonsense mutation, and so on (Figure 3A,B). Through the screening of actionable genes in the OncoKB database (https://www.oncokb.org/actionableGenes), among the 20 genes with the highest mutation frequency in the non‐HRD group, two genes were biomarkers for targeted drugs (NF1 and CDK12). Moreover, most of the variant classifications of these two genes were those affecting gene structure. Patients with mutations in these two genes accounted for 13% of the non‐HRD group. The mutational landscapes of HR genes in the two subgroups also exhibited a distinct difference. HR gene mutations in the HRD group were mainly concentrated in BRCA1/2 (7%), while the non‐HRD group was scattered across different HR genes (Figure S2A,B). We also compared the CNV of HR genes in the two subgroups, and observed BRCA2 homozygous deletion was only present in the HRD group (Figure S2C).
FIGURE 3.
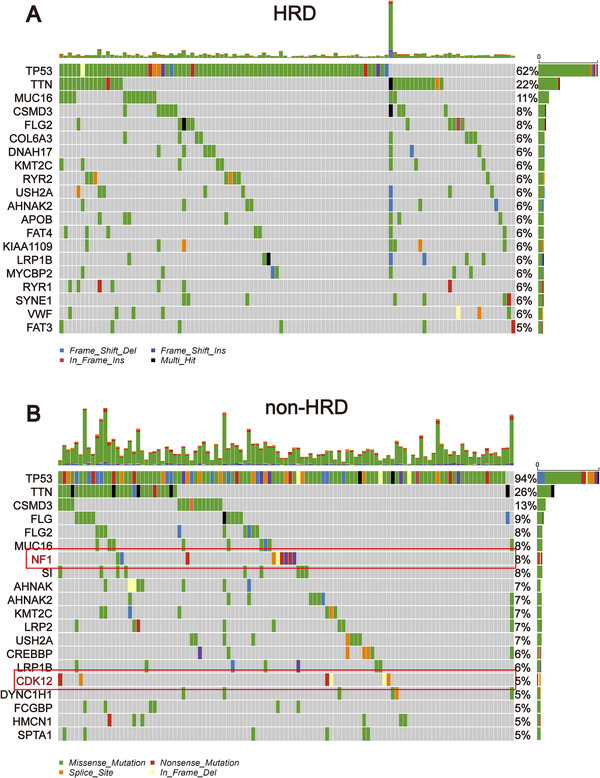
Mutational landscape of TCGA‐OSC cohort stratified by the homologous recombination deficiency (HRD) and non‐HRD groups. (A) Genetic profile of the HRD OSC patients. (B) Genetic profile of the non‐HRD OSC patients. The genes in the red box are actionable genes
3.3. CXCL11 expression associated with the HRD score and its prognostic value in OSC
To identify RNAs associated with the HRD score, the TCGA‐OSC cohort was sorted in ascending order of HRD scores, and the last 20% (n = 70) and the top 20% (n = 70) of the patients were chosen to identify DEGs. Utilizing the egdeR method, a total of 124 DEGs were screened out. Among them, 38 RNAs were found to be upregulated and 86 to be downregulated in the HRD group. Then, 124 differentially expressed RNAs were used to perform unsupervised cluster analysis on 348 TCGA‐OSC samples. As shown in Figure 4A, we found that not all DEGs clustered the HRD and non‐HRD groups well in the entire TCGA‐OSC cohort. Only the DEGs in the red block region were able to cluster the HRD and non‐HRD groups well. To further screen out DEGs related to the HRD score and prognosis of the patients, the univariate analysis was conducted in the 124 DEGs for the whole TCGA‐OSC cohort. A total of 17 genes with prognostic potentiality were identified by the univariate analysis and log‐rank test (p < .05). The 17 HRD‐related genes were then subjected to Lasso–Cox proportional hazards regression and 10‐fold cross‐validation to identify the best gene model. The Lasso coefficient profile plot was produced against the log (lambda) sequence, and the minimize k method resulted in one optimal coefficient (Figure 4B,C). C–X–C motif chemokine ligand 11 (CXCL11), a downstream target of the cGAS‐STING pathway, reached the optimal regression efficiency to speculate the prognostic ability. A heatmap of CXCL11 expression and the HRD score and the scatterplot of OS with corresponding risk scores are illustrated in Figure 4D. Kaplan–Meier analysis displayed that the survival outcomes of TCGA‐OSC patients with high CXCL11 expression (CXCL11‐positive) were significantly better than patients with low CXCL11 expression (CXCL11‐negative) (HR = 0.39 [0.29, 0.51], log‐rank test p < .00001) (Figure 4E). To verify whether the CXCL11 expression signature has similar prognostic value in different OSC cohorts, we further confirmed this phenomenon in two independent OSC cohorts in the GEO database (including GSE140082 and GSE30161): results from Kaplan–Meier analysis also showed that patients in the CXCL11‐positive group demonstrated a better prognosis than those in the CXCL11‐negative group (Figure S3A,B).
FIGURE 4.
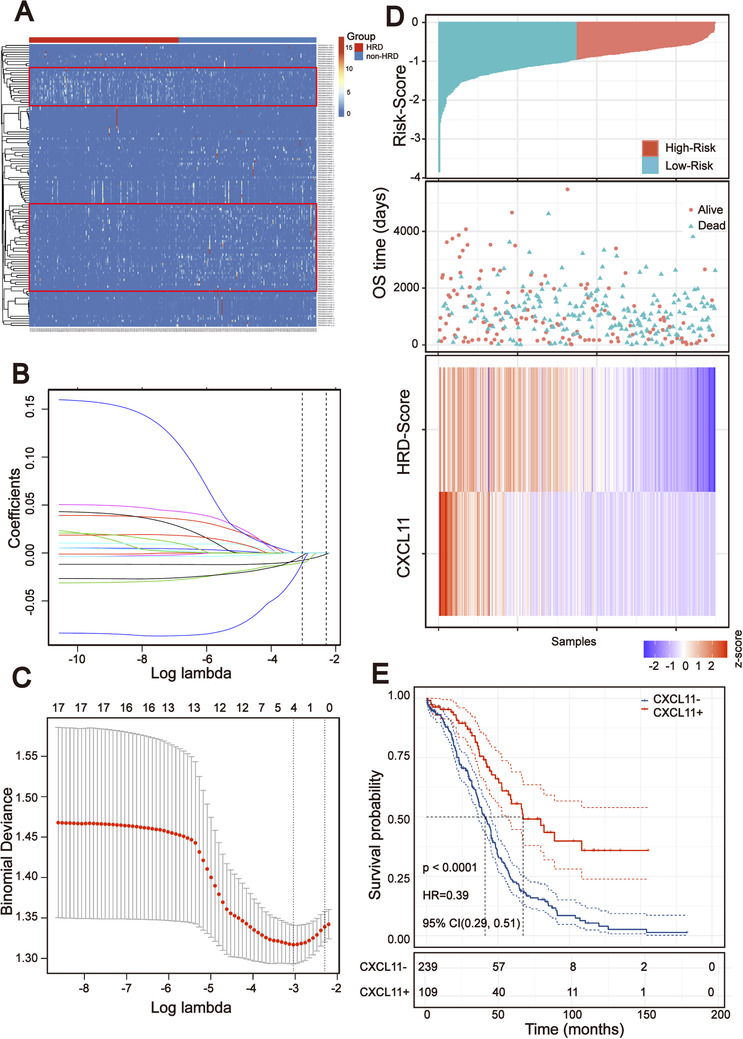
Screening prognosis related RNA based on the homologous recombination deficiency (HRD) score. (A) Unsupervised clustering of 348 OSC patients based on the expression pattern of 124 differentially expressed genes (DEGs). (B and C) Lasso coefficient profiles of the 17 prognosis‐associated HRD genes. (D) Heatmap of the signature consisting of the HRD score and the CXCL11 expression signature based on the Cox coefficients. Patients were divided into high‐risk and low‐risk groups and the median risk score was utilized as the cutoff value. (E) Kaplan–Meier estimates of overall survival of patients with the CXCL11‐positive or CXCL11‐negative tumors in the TCGA‐OSC cohort (log‐rank test)
3.4. Comparison of immune cells infiltration within CXCL11‐positive and CXCL11‐negative groups
The expression of cytokines/chemokines is essential for attracting immune cells, 33 suggesting that tumor infiltrating immune cells might be different in the CXCL11‐positive and CXCL11‐negative groups. To validate this assumption, the TIMER algorithm 34 was applied to estimate enrichment of various immune cell types within different subgroups. We developed a heatmap with TIMER results to visualize the relative abundance of six immune infiltrating cell subpopulations from the TCGA‐OSC cohort (Figure 5A). As depicted in the heatmap, there were significant differences in immune cell infiltration between the two subgroups. Antitumor lymphocyte cell subpopulations, such as CD4+/CD8+ T cells and dendritic cells were enriched in the CXCL11‐positive group (Wilcoxon signed rank test, p < .01). The neutrophils were also enriched in the CXCL11‐positive group (Wilcoxon signed rank test, p < .001) (Figure 5B). We then investigated the correlation of immune cell infiltration with the expression of CXCL11 by spearman correlation coefficients. The results revealed that the expression of CXCL11 was significantly associated with immune cell infiltration in the TCGA‐OSC cohort (Figure 5C). We also further analyzed the correlation between the immune cell infiltration signal and the expression of CXCL11 in the TCGA pan‐cancer cohorts and found similar results (Figure S3C).
FIGURE 5.
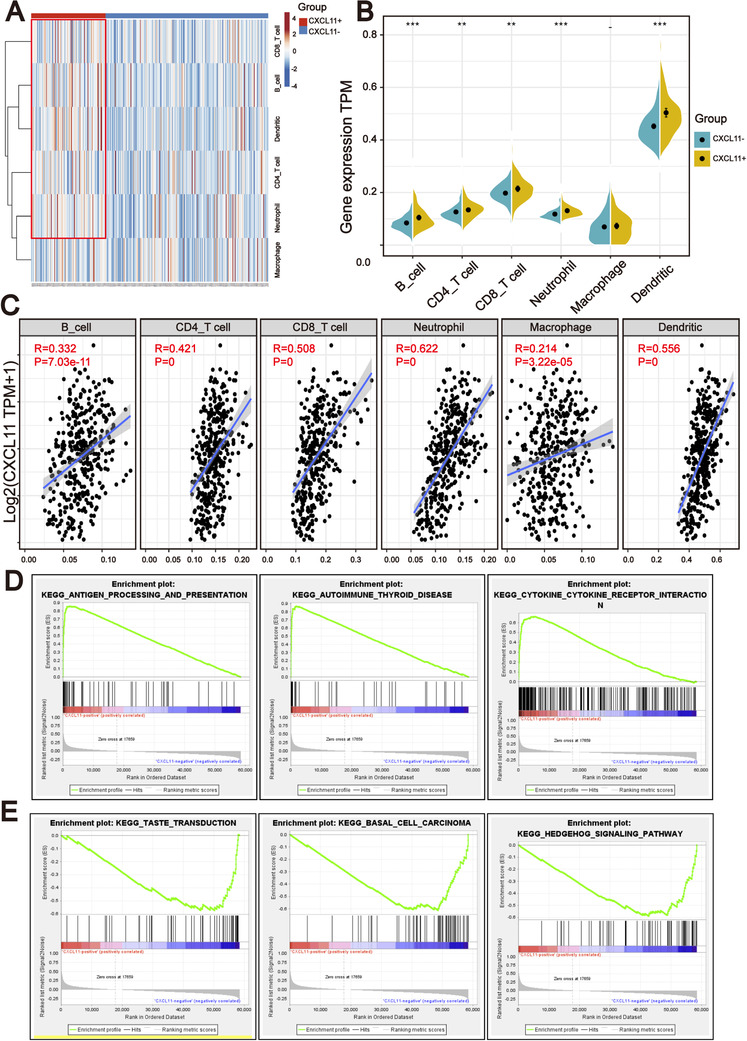
CXCL11 expression signature was associated with the immune infiltration. (A) TIMER analysis identified the relative infiltration of six types of immune cell subpopulations with different CXCL11 subgroups. (B) Violin plot of immune cell subpopulations in the CXCL11‐positive and CXCL11‐negative groups (Wilcoxon signed rank test, **p < .01, ***p < .001). (C) Correlation between the CXCL11 expression signature and immune cell subpopulations in the TCGA‐OSC cohort. (D) GSEA identified that antigen processing and presentation, autoimmune thyroid and cytokine receptor interaction signaling pathways were upregulated in the CXCL11‐positive group compared to the CXCL11‐negative group. (E) GSEA identified that taste transduction, basal cell carcinoma, and hedgehog signaling pathways were upregulated in the CXCL11‐negative group compared to the CXCL11‐positive group
Furthermore, GSEA on the gene expression profile of the CXCL11‐positive group against the CXCL11‐negative group revealed the CXCL11 expression signature‐related biological signaling pathway. Genes involved in antigen processing and presentation, autoimmune thyroid and cytokine receptor interaction signaling pathways were the most significantly enriched in the CXCL11‐positive group (Figure 5D). However, taste transduction, basal cell carcinoma, and hedgehog signaling pathways were enriched in the CXCL11‐negative group (Figure 5E).
3.5. CXCL11 expression associated with molecules in antigen processing and presentation pathway
The results from the TIMER and GSEA analysis showed that there were significant differences between the CXCL11‐positive and the CXCL11‐negative groups in antigen processing and presentation pathway, hinting that the expression of antigen‐related genes might be associated with CXCL11 expression. To prove this assumption, we explored the correlation of antigen‐related genes with CXCL11 expression by using the Pearson correlation coefficient. We found that the expression of MHC class I/II (I: HLA‐A, HLA‐B, and HLA‐C; II: HLA‐DP, HLA‐DM, HLA‐DOA, HLA‐DOB, HLA‐DQ, and HLA‐DR) and antigen binding (B2M, TAP1/2, and so on) molecules were highly correlated with the CXCL11 expression signature (Figure 6A). There were significant differences in the expression of HLA‐A, HLA‐B, and other key antigen presenting molecules between the two subgroups (Wilcoxon signed rank test, p < .001, Figure 6B). The results were confirmed in the GEO validation cohort (Figure S4). As antigen processing and presentation pathway plays a crucial role in immune recognition of predicted (neo‐) antigen produced by cancer cells, we further investigated the relationship between neoantigen load and the CXCL11 expression signature by Pearson correlation coefficient. Correspondingly, predicted neoantigen load was highly correlated with CXCL11 expression (Figure 6C).
FIGURE 6.
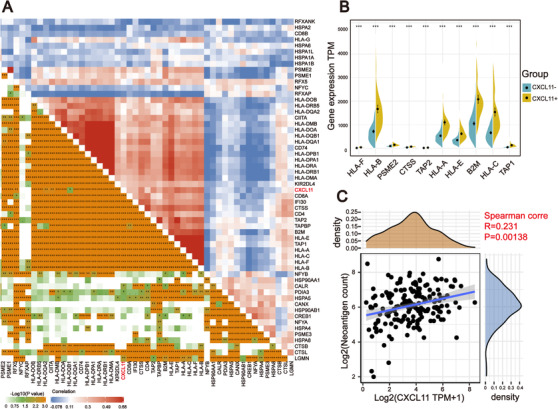
Correlation between the expression of CXCL11 and antigen‐related genes. (A) Correlation between the CXCL11 expression signature and antigen‐related genes in the TCGA‐OSC cohort. (B) Violin plot of top 10 antigen‐related genes in the CXCL11‐positive and CXCL11‐negative groups (Wilcoxon signed rank test, ***p < .001). (C) Correlation between CXCL11 expression signature and neoantigen load in the TCGA‐OSC cohort
3.6. CXCL11 expression associated with ICB‐related genes
In recent years, ICB therapy, represented by anti‐PD‐1/L1, has played an increasingly important role in antitumor treatment. The characteristics of TIME and immune checkpoint genes in tumor cells have a profound impact on ICB therapy. Therefore, we collected more than 40 common ICB‐related gene signatures and analyzed the relationship between CXCL11 expression and ICB‐related genes. 35 As displayed by heatmap, CXCL11 expression was significantly correlated with the expression of multiple ICB‐related genes (Figure 7A). Ten of the most relevant ICB‐related genes were: LAG3, ICOS, CTLA4, CD48, HAVCR2, PDCD1 (PD‐1), PDCDILG2 (PD‐L2), TIGIT, CD274 (PD‐L1), and CD86, and their expression levels were enriched in the CXCL11‐positive group (Wilcoxon signed rank test, p < .001, Figure 7B). Generally, the key regulatory factors involved in immunity perform similar functions in different tissues. 36 We thus explored CXCL11 expression and ICB‐related gene signatures across cancer types. We found that the coexpression of CXCL11 and ICB‐related genes was not only present in ovarian cancer, but also in 32 other cancer types (Figure 7C).
FIGURE 7.
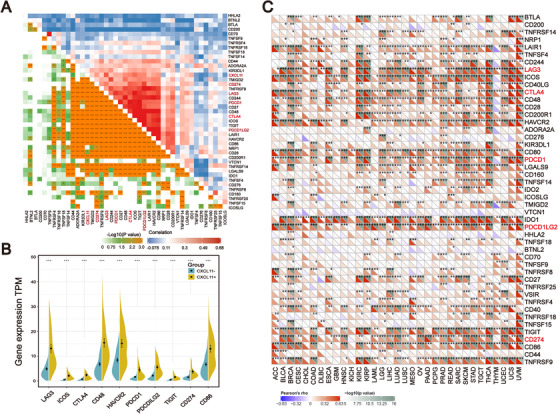
Correlation among the expression of CXCL11 and ICB‐related genes. (A) Correlation between the CXCL11 expression signature and ICB‐related genes in the TCGA‐OSC cohort. (B) Violin plot of top 10 ICB‐related genes in the CXCL11‐positive and CXCL11‐negative groups (Wilcoxon signed rank test, ***p < .001). (C) Correlation between CXCL11 expression signature and ICB‐related genes in the TCGA‐pan cancer cohorts
3.7. CXCL11 expression could be used as a potential biomarker for ICB therapy
All of the above results indicate that CXCL11 expression is closely related to the biomarkers for ICB therapy. Therefore, we collected the transcriptome profile and clinical information from an immunotherapy cohort (Imvigor210) of urothelial cancer treated with atezolizumab, so as to explore the relationship between CXCL11 expression and immune response. 14 In this cohort, tumor patients with high CXCL11 expression exhibited markedly improved clinical benefits and significantly prolonged survival (Figure 8A). Significant therapeutic advantages and immune responses to PD‐L1 blockades were observed in samples with high expression of CXCL11 compared to those with low expression (Fisher extract test, p = .0002, Figure 8B; Kruskal–Wallis H test, p < .001, Figure 8C). Further analysis revealed that tumor infiltrating immune phenotype and neoantigen load were significantly elevated in tumors with high expression of CXCL11, which was closely linked to immunotherapeutic efficacy (Figures 8D,E). Besides, the association between the expression of CXCL11 and immunotherapy survival remained statistically significant after taking into account gender, smoking, ECOG score, immunophenotype, and PD‐1/PD‐L1 status (Figure S5).
FIGURE 8.
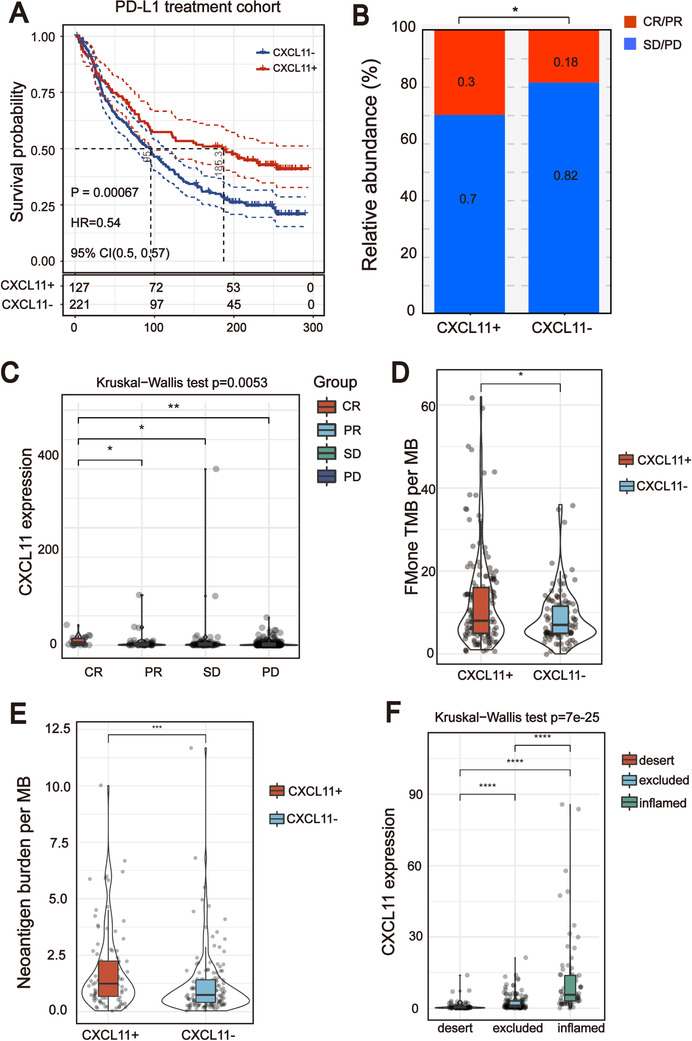
CXCL11 expression could be used as a potential biomarker for ICB therapy. (A) Curve for overall survival is shown for high and low CXCL11 expression in the PD‐L1 treatment cohort. (B and C) Proportion of immune response to anti‐PD‐L1 treatment in high versus low CXCL11 expression subgroups. CR, complete response; PD, progressive disease; PR, partial response; SD, stable disease. (D) TMB and neoantigen load (E) in the immunotherapy cohort were compared among distinct CXCL11 expression signature subgroups. (F) CXCL11 expression signature in different immune phenotype subgroups. The tumor immunophenotype was defined according to immunohistochemistry results of the CD8 antibody (Wilcoxon signed rank test, ****p < .0001)
3.8. Olaparib‐treated ovarian cancer cells upregulate CXCL11 expression in vivo and in vitro
It has been reported that PARP inhibitor (PARPi) treatment markedly induced DSBs. To confirm that upregulated CXCL11 expression could be derived from HRD tumor cells, we first re‐analyzed the RNA seq data of high‐grade serous ovarian cancer tumor tissues harvested from tumor‐bearing mice after 18 days of treatment with olaparib or vehicle (GSE120500). 37 Boxplots showed markedly upregulated expression of CXCL11 in tumors treated with olaparib compared with vehicle control (Figure 9A).
FIGURE 9.
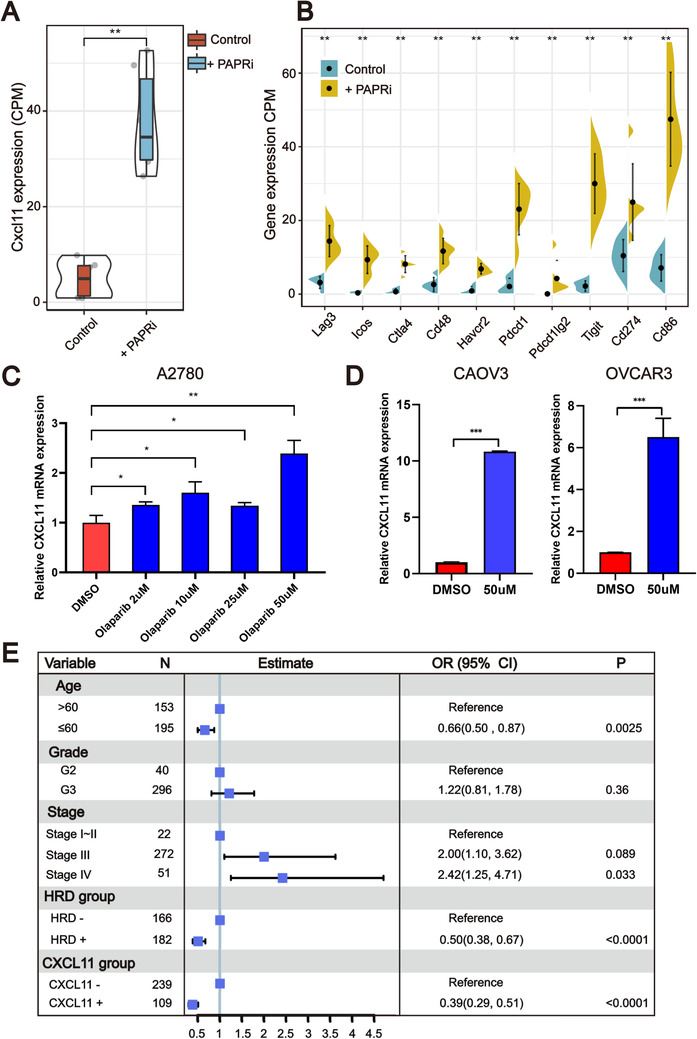
Olaparib elicits the expression of CXCL11 in vivo and in vitro. (A and B) Olaparib elicits the expression of CXCL11 and ICB‐related genes in vivo (Wilcoxon signed rank test, **p < .01). (C and D) qPCR evaluation of CXCL11 expression in different cell lines. Olaparib elicits the expression of CXCL11 in multiple ovarian cancer cell lines (Student's t‐test, *p < .05, **p < .01). (E) Forest plot representation of the multivariate Cox regression model delineated the association between the CXCL11 expression signature and survival in the TCGA‐OSC cohort
We next compared the expression levels of ICB‐related genes with the highest correlation with CXCL11 between the olaparib treatment group and the control group. As shown in Figure 9B, the expression of these genes in the olaparib treatment group was significantly higher than that in the vehicle control group (Wilcoxon signed rank test, p < .01). To further validate that genomic instability ovarian cancer cells activate the CXCL11 expression signature, we conducted in vitro experiments. As measured by RT‐qPCR (Figure 9C,D), olaparib treatment caused significant upregulation of CXCL11 mRNA expression in multiple ovarian cancer cell lines. Together, these data indicate that cancer cells with DSBs could upregulate the expression of CXCL11 in vivo and in vitro.
4. DISCUSSION
Over the years, many efforts have been made to investigate the initiation, development, and treatment of ovarian cancer. 38 Postoperative histopathological characteristics of patients such as tumor size, stage and grade, and residual lesions are still used as the most important prognostic factors for ovarian cancer. However, the 5‐year relative survival rate of ovarian cancer patients is still unsatisfactory. HRD has been reported to be not only a ubiquitous feature of breast cancer but is also one of the most influential factors for ovarian cancer prognosis. However, HRD is present in less than 50% of serous ovarian tumors, so new biomarkers need to be developed for molecular typing of ovarian cancer patients. In this study, we deeply analyzed the molecular characteristics of OSC patients with different HRD scores and identified biomarkers that could be complementary to the HRD score, our contributions are as follows:
(1) A comprehensive analysis of the genomic landscape of non‐HRD group showed a high proportion of actionable gene mutations. (2) We found that CXCL11 expression, a downstream target of the cGAS‐STING pathway, was positively associated with HRD and displayed a strong ability to predict the prognosis of OSC patients. (3) We introduced CXCL11 as a potential reliable biomarker for the efficacy of ICB therapy, and the predictive effect of CXCL11 was even better than that of PD‐1/PD‐L1.
The basket study design is noteworthy because it allows for the possibility that different tumor types with the same molecular biomarker might differ in their sensitivity to therapy targeted at that biomarker. 39 Potentially actionable mutations were seen in 13% of non‐HRD patients: (a) loss‐of‐function mutations in NF1 were found in 8% of the patients; (b) loss‐of‐function mutations in CDK12 were found in 5% of the patients. The NF1 gene encoding neurofibromin works as a negative regulator of RAS activity. Patients with NF1 gene loss‐of‐function mutations are more likely to develop RAS hyperactivity and tumorigenesis. 40 , 41 The availability of small molecule compounds (such as selumetinib and imatinib) that target RAS signaling implied in the pathogenesis of plexiform neurofibromas has led to multiple clinical trials, and FDA has approved Koselugo (selumetinib) for the treatment of pediatric patients with NF1 mutations. 42 CDK12 (cyclin‐dependent kinase 12) is a kinase involved in regulation of the cell cycle and regulation of transcriptional elongation of many DNA‐damage‐response genes. Loss of the CDK12/cyclin K complex renders triple‐negative breast cancer and HEK293 cells sensitive to various DNA‐damaging agents, including camptothecin, etoposide, and mitomycin C. 43 Comprehensive genomic analysis of non‐HRD ovarian cancer has broadened our knowledge of the molecular events relevant to patients who cannot receive olaparib plus bevacizumab treatment, and provides a direction for targeted therapy of these patients.
Through the whole transcriptome analysis of the patients with HRD tumors, we identified that CXCL11 expression could be a reliable prognostic risk gene in the TCGA‐OSC cohort and its efficacy was proved in the GEO‐OSC cohorts. CXCL11 is a small cytokine belonging to the CXC chemokine family. 44 As a downstream target of cGAS‐STING, CXCL11 is a critical chemokine that binds CXCR3 on T cells, regulating differentiation of naive T cells and leading migration of immune cells to their focal sites. 45 , 46 In the recent issue of Cancer Cell, Lu and Guan demonstrated that activation of the cGAS‐STING pathway in tumor tissues was significantly and positively correlated with the prognosis of patients bearing dMMR tumors but not that of patients with pMMR (proficient MMR) tumors. In addition to dMMR, HRD also induces genomic instability and serves as an effective therapeutic biomarker for breast cancer and ovarian cancer. 47 , 48 As a complement to Guan and Lu's work, our results further demonstrated that the correlation between genomic instability and activated cGAS‐STING signaling in dMMR tumors may be extended to HRD tumors.
Emerging evidence has shown the importance of CXC chemokines in tumor immunotherapy. 49 , 50 Our results showed that CXCL11 expression was positively associated with TIME, including neoantigen load and infiltrating immune cells, and could be used as a potential biomarker for ICB therapy.
Under this situation, the determination of whether upregulated CXCL11 unavoidably results from the cGAS‐STING activation needs further experimental testing. As a downstream target of the cCAS‐STING pathway, upregulated CXCL11 showed superior predictive power compared with the HRD score. Importantly, the clinical examination of CXCL11 in tumor tissues or serum is more feasible than applying the steps necessary for calculating the HRD score, and the prediction accuracy of upregulated CXCL11 is even better than the HRD score itself. We introduced, for the first time, a prospective biomarker associated with HRD tumors, which merits further investigation in multiple cohorts.
5. CONCLUSIONS
To summarize, this work provided a new perspective on the molecular characteristics of the genomic and transcriptome of patients with OSC. Our results were the first to find that the non‐HRD patients had the opportunity for targeted therapy, laying the foundation for molecular typing of OSC. Furthermore, this work identified the CXCL11 expression signature that could not only predict OSC patients’ survival outcomes but also work as a potential reliable biomarker for the efficacy of ICB therapy. Our study showed high clinical application value and provided new clues for enrolling OSC patients in precision medicine. Through further prospective validation and mechanism research, biomarkers derived from this work may become important molecules for molecular typing of OSC.
CONFLICT OF INTEREST
The authors declare that there is no conflict of interest.
AUTHOR CONTRIBUTIONS
Designing research studies: Zhiwen Shi and Keqin Hua. Conducting experiments: Junjun Qiu, Qingguo Zhao, and Bin Lv. Analyzing data: Zhiwen Shi and Hongyan Wang. Preparing the manuscript: Zhiwen Shi and Junjun Qiu. Grammar check: Xinyu Qu and Xiao Han. Supervision: Hongyan Wang, Junjun Qiu, and Keqin Hua. Funding acquisition: Keqin Hua and Junjun Qiu. The authors read and approved the final manuscript.
Supporting information
Supporting information
Supporting Figure S1 Molecular characteristics of patients in the HRD and non‐HRD groups. (A) GSEA identified that DNA replication, homologous recombination, and mismatch repair signaling pathways were upregulated in the HRD group compared to non‐HRD group. (B) Violin plot of MSI sensor score in the HRD and non‐HRD groups. (C) Venn diagram showing the shared genes between the HRD and non‐HRD groups
Supporting information
Supporting Figure S2 Mutations in the homologous recombination pathway of the HRD and non‐HRD groups. (A and B) Genetic profile of the HRD and non‐HRD patients in the homologous recombination pathway. (C) Copy number variation in homologous recombination pathway of patients in the HRD and non‐HRD groups
Supporting information
Supporting Figure S3 CXCL11 expression signature was associated with OSC patients’ survival in the GEO validation cohorts. (A and B) Kaplan–Meier estimates of OS of patients with the CXCL11‐positive or CXCL11‐negative tumors in the GEO validation cohorts (log‐rank test). (C) Correlation between the CXCL11 expression signature and immune cell subpopulations in the TCGA pan‐cancer cohorts
Supporting information
Supporting Figure S4 Correlation between the expression of CXCL11 and MHC molecules in the GEO validation cohort. (A) Correlation between the CXCL11 expression signature and MHC molecules in the GSE140082 cohort. (B) Violin plot of HLA molecules associated with antigen presentation in the CXCL11‐positive and CXCL11‐negative groups (Wilcoxon signed rank test, ***p < .001)
Supporting information
Supporting Figure S5 Multivariate Cox regression analysis of the CXCL11 expression signature with gender, smoking, ECOG score, and immunophenotype were taken into account
Supporting information
Supporting information
Shi Z, Zhao Q, Lv B, et al. Identification of biomarkers complementary to homologous recombination deficiency for improving the clinical outcome of ovarian serous cystadenocarcinoma. Clin Transl Med. 2021;11:e399. 10.1002/ctm2.399
Zhiwen Shi and Qingguo Zhao contributed equally to this work.
Contributor Information
Hongyan Wang, Email: wanghyann@163.com.
Junjun Qiu, Email: qiujunjun1113@163.com.
Keqin Hua, Email: huakeqin@fudan.edu.cn.
REFERENCES
- 1. Cabasag CJ, Arnold M, Butler J, et al. The influence of birth cohort and calendar period on global trends in ovarian cancer incidence. Int J Cancer. 2020;146(3):749‐758. [DOI] [PMC free article] [PubMed] [Google Scholar]
- 2. Sundar S, Neal RD, Kehoe S. Diagnosis of ovarian cancer. BMJ. 2015:351:h4443. [DOI] [PubMed] [Google Scholar]
- 3. Qi X, Yu C, Wang Y, Lin Y, Shen B. Network vulnerability‐based and knowledge‐guided identification of microRNA biomarkers indicating platinum resistance in high‐grade serous ovarian cancer. Clin Transl Med. 2019;8(1):1‐11. [DOI] [PMC free article] [PubMed] [Google Scholar]
- 4. Matsuda A, Katanoda K. Five‐year relative survival rate of ovarian cancer in the USA, Europe and Japan. Jpn J Clin Oncol. 2014;44(2):196. [DOI] [PubMed] [Google Scholar]
- 5. Li X, Heyer W‐D. Homologous recombination in DNA repair and DNA damage tolerance. Cell Res. 2008;18(1):99‐113. [DOI] [PMC free article] [PubMed] [Google Scholar]
- 6. Rai R, Dai H, Multani AS, et al. BRIT1 regulates early DNA damage response, chromosomal integrity, and cancer. Cancer Cell. 2006;10(2):145‐157. [DOI] [PMC free article] [PubMed] [Google Scholar]
- 7. Sullivan MR, Bernstein KA. RAD‐ical new insights into RAD51 regulation. Genes. 2018;9(12):629. [DOI] [PMC free article] [PubMed] [Google Scholar]
- 8. Ray‐Coquard I, Pautier P, Pignata S, et al. Olaparib plus bevacizumab as first‐line maintenance in ovarian cancer. N Engl J Med. 2019;381(25):2416‐2428. [DOI] [PubMed] [Google Scholar]
- 9. Heeke A, Lynce F, Baker T, Pishvaian M, Isaacs C. Prevalence of homologous recombination deficiency (HRD) among all tumor types. JCO Precis Oncol. 2018;2018. 10.1200/po.17.00286 [DOI] [PMC free article] [PubMed] [Google Scholar]
- 10. Wang T, Wang G, Zhang X, et al. The expression of miRNAs is associated with tumour genome instability and predicts the outcome of ovarian cancer patients treated with platinum agents. Sci Rep. 2017;7(1):1‐11. [DOI] [PMC free article] [PubMed] [Google Scholar]
- 11. Bao S, Zhao H, Yuan J, et al. Computational identification of mutator‐derived lncRNA signatures of genome instability for improving the clinical outcome of cancers: a case study in breast cancer. Brief Bioinform. 2020;21(5):1742‐1755. [DOI] [PubMed] [Google Scholar]
- 12. Cancer Genome Atlas Research Network . Integrated genomic analyses of ovarian carcinoma. Nature. 2011;474(7353):609‐615. [DOI] [PMC free article] [PubMed] [Google Scholar]
- 13. Tomczak K, Czerwińska P, Wiznerowicz M. The Cancer Genome Atlas (TCGA): an immeasurable source of knowledge. Contemp Oncol (Pozn). 2015;19(1A):A68‐A77. [DOI] [PMC free article] [PubMed] [Google Scholar]
- 14. Mariathasan S, Turley SJ, Nickles D, et al. TGFβ attenuates tumour response to PD‐L1 blockade by contributing to exclusion of T cells. Nature. 2018;554(7693):544‐548. [DOI] [PMC free article] [PubMed] [Google Scholar]
- 15. Hwang S, Kwon AY, Jeong JY, et al. Immune gene signatures for predicting durable clinical benefit of anti‐PD‐1 immunotherapy in patients with non‐small cell lung cancer. Sci Rep;10(1):643. [DOI] [PMC free article] [PubMed] [Google Scholar]
- 16. Abkevich V, Timms K, Hennessy B, et al. Patterns of genomic loss of heterozygosity predict homologous recombination repair defects in epithelial ovarian cancer. Br J Cancer. 2012;107(10):1776‐1782. [DOI] [PMC free article] [PubMed] [Google Scholar]
- 17. Manié E, Popova T, Battistella A, et al. Genomic hallmarks of homologous recombination deficiency in invasive breast carcinomas. Int J Cancer. 2016;138(4):891‐900. [DOI] [PubMed] [Google Scholar]
- 18. Birkbak NJ, Wang ZC, Kim J‐Y, et al. Telomeric allelic imbalance indicates defective DNA repair and sensitivity to DNA‐damaging agents. Cancer Discov. 2012;2(4):366‐375. [DOI] [PMC free article] [PubMed] [Google Scholar]
- 19. Takaya H, Nakai H, Takamatsu S, Mandai M, Matsumura N. Homologous recombination deficiency status‐based classification of high‐grade serous ovarian carcinoma. Sci Rep. 2020;10(1):1‐8. [DOI] [PMC free article] [PubMed] [Google Scholar]
- 20. Ellrott K, Bailey MH, Saksena G, et al. Scalable open science approach for mutation calling of tumor exomes using multiple genomic pipelines. Cell Syst. 2018;6(3):271‐281.e7. [DOI] [PMC free article] [PubMed] [Google Scholar]
- 21. Mayakonda A, Lin D‐C, Assenov Y, Plass C, Koeffler HP. Maftools: efficient and comprehensive analysis of somatic variants in cancer. Genome Res. 2018;28(11):1747‐1756. [DOI] [PMC free article] [PubMed] [Google Scholar]
- 22. Matey‐Hernandez ML, Brunak S, Izarzugaza JM. Benchmarking the HLA typing performance of Polysolver and Optitype in 50 Danish parental trios. BMC Bioinformatics. 2018;19(1):239. [DOI] [PMC free article] [PubMed] [Google Scholar]
- 23. Reynisson B, Alvarez B, Paul S, Peters B, Nielsen M. NetMHCpan‐4.1 and NetMHCIIpan‐4.0: improved predictions of MHC antigen presentation by concurrent motif deconvolution and integration of MS MHC eluted ligand data. Nucleic Acids Res. 2020;48(W1):W449‐W454. [DOI] [PMC free article] [PubMed] [Google Scholar]
- 24. Nielsen M, Lundegaard C, Blicher T, et al. NetMHCpan, a method for quantitative predictions of peptide binding to any HLA‐A and‐B locus protein of known sequence. PLoS One. 2007;2(8):e796. [DOI] [PMC free article] [PubMed] [Google Scholar]
- 25. Rajasagi M, Shukla SA, Fritsch EF, et al. Systematic identification of personal tumor‐specific neoantigens in chronic lymphocytic leukemia. Blood. 2014;124(3):453‐462. [DOI] [PMC free article] [PubMed] [Google Scholar]
- 26. Rooney MS, Shukla SA, Wu CJ, Getz G, Hacohen N. Molecular and genetic properties of tumors associated with local immune cytolytic activity. Cell. 2015;160(1‐2):48‐61. [DOI] [PMC free article] [PubMed] [Google Scholar]
- 27. Robinson MD, McCarthy DJ, Smyth GK. edgeR: a bioconductor package for differential expression analysis of digital gene expression data. Bioinformatics. 2010;26(1):139‐140. [DOI] [PMC free article] [PubMed] [Google Scholar]
- 28. Metsalu T, Vilo J. ClustVis: a web tool for visualizing clustering of multivariate data using principal component analysis and heatmap. Nucleic Acids Res. 2015;43(W1):W566‐W570. [DOI] [PMC free article] [PubMed] [Google Scholar]
- 29. Subramanian A, Kuehn H, Gould J, Tamayo P, Mesirov JP. GSEA‐P: a desktop application for gene set enrichment analysis. Bioinformatics. 2007;23(23):3251‐3253. [DOI] [PubMed] [Google Scholar]
- 30. Therneau T, Lumley T. R Survival Package. 2013.
- 31. Tibshirani R. Regression shrinkage and selection via the lasso. J R Stat Soc Series B Stat Methodol. 1996;58(1):267‐288. [Google Scholar]
- 32. Li T, Fan J, Wang B, et al. TIMER: a web server for comprehensive analysis of tumor‐infiltrating immune cells. Cancer Res. 2017;77(21):e108‐e110. [DOI] [PMC free article] [PubMed] [Google Scholar]
- 33. Zohar Y, Wildbaum G, Novak R, et al. CXCL11‐dependent induction of FOXP3‐negative regulatory T cells suppresses autoimmune encephalomyelitis. J Clin Invest. 2014;124(5):2009‐2022. [DOI] [PMC free article] [PubMed] [Google Scholar]
- 34. Li B, Severson E, Pignon J‐C, et al. Comprehensive analyses of tumor immunity: implications for cancer immunotherapy. Genome Biol. 2016;17(1):1‐16. [DOI] [PMC free article] [PubMed] [Google Scholar]
- 35. Petitprez F, Meylan M, de Reyniès A, Sautès‐Fridman C, Fridman WH. The tumor microenvironment in the response to immune checkpoint blockade therapies. Front Immunol. 2020;11:784. [DOI] [PMC free article] [PubMed] [Google Scholar]
- 36. Li J, Hua X, Haubrock M, Wang J, Wingender E. The architecture of the gene regulatory networks of different tissues. Bioinformatics. 2012;28(18):i509‐i514. [DOI] [PMC free article] [PubMed] [Google Scholar]
- 37. Ding L, Kim HJ, Wang Q, Kearns M, Zhao JJ. PARP inhibition elicits STING‐dependent antitumor immunity in Brca1‐deficient ovarian cancer. Cell Rep. 2018;25(11):2972‐2980.e5. [DOI] [PMC free article] [PubMed] [Google Scholar]
- 38. Reid BM, Permuth JB, Sellers TA. Epidemiology of ovarian cancer: a review. Cancer Biol Med. 2017;14(1):9‐32. [DOI] [PMC free article] [PubMed] [Google Scholar]
- 39. Hyman DM, Puzanov I, Subbiah V, et al. Vemurafenib in multiple nonmelanoma cancers with BRAF V600 mutations. N Engl J Med. 2015;373(8):726‐736. [DOI] [PMC free article] [PubMed] [Google Scholar]
- 40. Bollag G, Clapp DW, Shih S, et al. Loss of NF1 results in activation of the Ras signaling pathway and leads to aberrant growth in haematopoietic cells. Nat Genet. 1996;12(2):144‐148. [DOI] [PubMed] [Google Scholar]
- 41. Nichols RJ, Haderk F, Stahlhut C, et al. RAS nucleotide cycling underlies the SHP2 phosphatase dependence of mutant BRAF‐, NF1‐and RAS‐driven cancers. Nat Cell Biol. 2018;20(9):1064‐1073. [DOI] [PMC free article] [PubMed] [Google Scholar]
- 42. Voelker R. A new treatment for children with neurofibromatosis type 1. JAMA. 2020;323(19):1887‐1887. [DOI] [PubMed] [Google Scholar]
- 43. Bösken CA, Farnung L, Hintermair C, et al. The structure and substrate specificity of human Cdk12/Cyclin K. Nat Commun. 2014;5:3505. [DOI] [PMC free article] [PubMed] [Google Scholar]
- 44. Colvin RA, Campanella GS, Sun J, Luster AD. Intracellular domains of CXCR3 that mediate CXCL9, CXCL10, and CXCL11 function. J Biol Chem. 2004;279(29):30219‐30227. [DOI] [PubMed] [Google Scholar]
- 45. Tokunaga R, Zhang W, Naseem M, et al. CXCL9, CXCL10, CXCL11/CXCR3 axis for immune activation–a target for novel cancer therapy. Cancer Treat Rev. 2018;63:40‐47. [DOI] [PMC free article] [PubMed] [Google Scholar]
- 46. Chen Y‐A, Shen Y‐L, Hsia H‐Y, Tiang Y‐P, Sung T‐L, Chen L‐Y. Extrachromosomal telomere repeat DNA is linked to ALT development via cGAS‐STING DNA sensing pathway. Nat Struct Mol Biol. 2017;24(12):1124‐1131. [DOI] [PubMed] [Google Scholar]
- 47. Pellegrino B, Musolino A, Llop‐Guevara A, et al. Homologous recombination repair deficiency and the immune response in breast cancer: a literature review. Transl Oncol. 2020;13(2):410‐422. [DOI] [PMC free article] [PubMed] [Google Scholar]
- 48. Chopra N, Tovey H, Pearson A, Cutts R, Turner NC. Homologous recombination DNA repair deficiency and PARP inhibition activity in primary triple negative breast cancer. Nat Commun. 2020;11(1):2662. [DOI] [PMC free article] [PubMed] [Google Scholar]
- 49. Litchfield K, Reading JL, Puttick C, et al. Meta‐analysis of tumor‐ and T cell‐intrinsic mechanisms of sensitization to checkpoint inhibition. Cell. 2021;184(3):596‐614.e14. [DOI] [PMC free article] [PubMed] [Google Scholar]
- 50. Li A, Yi M, Qin S, Song Y, Chu Q, Wu K. Activating cGAS‐STING pathway for the optimal effect of cancer immunotherapy. J Hematol Oncol. 2019;12(1):35. [DOI] [PMC free article] [PubMed] [Google Scholar]
Associated Data
This section collects any data citations, data availability statements, or supplementary materials included in this article.
Supplementary Materials
Supporting information
Supporting Figure S1 Molecular characteristics of patients in the HRD and non‐HRD groups. (A) GSEA identified that DNA replication, homologous recombination, and mismatch repair signaling pathways were upregulated in the HRD group compared to non‐HRD group. (B) Violin plot of MSI sensor score in the HRD and non‐HRD groups. (C) Venn diagram showing the shared genes between the HRD and non‐HRD groups
Supporting information
Supporting Figure S2 Mutations in the homologous recombination pathway of the HRD and non‐HRD groups. (A and B) Genetic profile of the HRD and non‐HRD patients in the homologous recombination pathway. (C) Copy number variation in homologous recombination pathway of patients in the HRD and non‐HRD groups
Supporting information
Supporting Figure S3 CXCL11 expression signature was associated with OSC patients’ survival in the GEO validation cohorts. (A and B) Kaplan–Meier estimates of OS of patients with the CXCL11‐positive or CXCL11‐negative tumors in the GEO validation cohorts (log‐rank test). (C) Correlation between the CXCL11 expression signature and immune cell subpopulations in the TCGA pan‐cancer cohorts
Supporting information
Supporting Figure S4 Correlation between the expression of CXCL11 and MHC molecules in the GEO validation cohort. (A) Correlation between the CXCL11 expression signature and MHC molecules in the GSE140082 cohort. (B) Violin plot of HLA molecules associated with antigen presentation in the CXCL11‐positive and CXCL11‐negative groups (Wilcoxon signed rank test, ***p < .001)
Supporting information
Supporting Figure S5 Multivariate Cox regression analysis of the CXCL11 expression signature with gender, smoking, ECOG score, and immunophenotype were taken into account
Supporting information
Supporting information


