

Abstract
Opportunistic pathogens such as Legionella are of significant public health concern in hospitals. Microbiological and water chemistry parameters in hot water throughout an Ohio hospital were monitored monthly before and after the installation of a monochloramine disinfection system over 16 months. Water samples from fifteen hot water sampling sites as well as the municipal water supply entering the hospital were analyzed using both culture and qPCR assays for specific microbial pathogens including Legionella, Pseudomonas spp., nontuberculous Mycobacteria [NTM], as well as for heterotrophic bacteria. Legionella culture assays decreased from 68% of all sites being positive prior to monochloramine addition to 6% positive after monochloramine addition, and these trends were parallel to qPCR results. Considering all samples, NTMs by culture were significantly reduced from 61% to 14% positivity (p<0.001) after monochloramine treatment. Mycobacterium genus-specific qPCR positivity was reduced from 92% to 65%, but the change was not significant. Heterotrophic bacteria (heterotrophic bacteria plate counts [HPCs]) exhibited large variability which skewed statistical results on a per room basis. However, when all samples were considered, a significant decrease in HPCs was observed after monochloramine addition. Lastly, Pseudomonas aeruginosa and Vermamoeba vermiformis demonstrated large and significant decrease of qPCR signals post-chloramination. General water chemistry parameters including monochloramine residual, nitrate, nitrite, pH, temperature, metals and total trihalomethanes (TTHMs) were also measured. Significant monochloramine residuals were consistently observed at all sampling sites with very little free ammonia present and no water quality indications of nitrification (e.g., pH decrease, elevated nitrite or nitrate). The addition of monochloramine had no obvious impact on metals (lead, copper and iron) and disinfection by-products.
Keywords: Legionella, Drinking water, Hospital, Monochloramine
1. Introduction
Opportunistic pathogens such as Legionella are of public health concern especially in buildings where sensitive populations are present (Mancini et al., 2015; Demirjian et al., 2015; Baron et al., 2014; Marchesi et al., 2013; Flannery et al., 2006). Such pathogens have been reported to cause disease in hospital patients, who are often immunocompromised from illness or treatments and are thus more susceptible to agents of disease (Anaissie et al., 2002; Squier et al., 2000; Kool et al., 1999).
Many factors in building water supplies and plumbing systems have been reported to influence the growth of Legionella and other opportunistic pathogens including water temperature, disinfectant type and residual, iron, copper, distal sites and others (Rakic et al., 2012; Wang et al., 2012; Serrano-Suarez et al., 2013; Lu et al., 2015; Baron et al., 2015; Kyritsi et al., 2018; LeChevalier, 2019). Some hospitals install disinfection systems to boost disinfectant levels in their building’s drinking water supply to overcome disinfectant residual demand and provide protection against opportunistic pathogens. Treatment options include free chlorine, chlorine dioxide, monochloramine and copper-silver ionization (Baron et al., 2014; Duda et al., 2014; Marchesi et al., 2013; Lin et al., 2011; USEPA, 2016).
Monochloramine is an attractive disinfectant option because it does not react readily with natural organic matter to form regulated disinfection byproducts (DBPs) (total trihalomethanes [TTHM] and haloacetic acids [HAA5]) like free chlorine does. Monochloramine has a more persistent and stable disinfectant residual than chlorine because of its lower reactivity (White, 1999). As a result, it is effective for controlling bacterial regrowth and biofilms due to its ability to penetrate the biofilm, although excess ammonia can cause biofilm growth (LeChevallier et al., 1988a, 1988b; Pressman et al., 2012).
An extensive review of monochloramine disinfection and Legionella can be found elsewhere (USEPA, 2016) but relevant information is summarized. Controlled laboratory studies have demonstrated the effectiveness of monochloramine to kill Legionella under a variety of conditions (e.g., Jakubek et al., 2013; Dupuy et al., 2011; Jacangelo et al., 2002; Donlan et al., 2002; Türetgen, 2004). The effectiveness of monochloramine to control Legionella within biofilm on surfaces has been studied as well (Wang et al., 2012; Loret et al., 2005). Several studies have documented monochloramine addition in building hot water systems to varying degrees of benefit and comprehensiveness (Baron et al., 2015, 2014a; Duda et al., 2014; Casini et al., 2014; Marchesi et al., 2013, 2012). Others (Weintraub et al., 2008; Flannery et al., 2006; Moore et al., 2006; Heffelfinger et al., 2003; Kool et al., 2000, 1999) have assessed Legionella control in buildings supplied with chloraminated municipal water.
Monochloramine (NH2Cl) addition has potential adverse implications that include the possibility of excess ammonia, biological nitrification (formation of nitrite and nitrate), and bacterial ecological shifts (Kirmeyer et al., 2004; Baron et al., 2015; Revetta et al., 2013), and the formation disinfection byproducts such as N-nitrosodimethylamine (NDMA) (Choi and Valentine, 2002). The application of monochloramine has also been associated with an increase in Mycobacterium and total coliform bacteria (Pryor et al., 2004; Moore et al., 2006; Baron et al., 2014). In the US, monochloramine disinfectant is regulated with a maximum residual disinfectant level (MRDL) of 4.0 mg Cl2/L. Lastly, monochloramine can attack rubber and plastic components (Kirmeyer et al., 2004).
Despite the efficacy of monochloramine for Legionella control, few reports are available that have comprehensively examined the efficacy and practicality of applying disinfection approaches for controlling other pathogenic microorganisms in building drinking water systems. Furthermore, very few case studies are available that consider the potential unintended consequences of installing disinfection treatment in large buildings such as hospitals (Triantafyllidou et al., 2016). Therefore, the objective of this work was to monitor microbiological and water chemistry parameters in the drinking water of a medium-sized hospital at 16 sampling sites for 16 months before and after the addition of monochloramine disinfection. The three main goals were to better understand the effectiveness of monochloramine disinfection in reducing opportunistic pathogens (e.g., Legionella pneumophila, Pseudomonas spp., nontuberculous Mycobacteria [NTM]); to monitor for evidence of nitrification (e.g., nitrate, nitrite); and to monitor for changes in other important drinking water quality parameters (e.g., total chlorine, monochloramine, pH, temperature, lead, copper, and other metals).
2. Methods and materials
2.1. Hospital
The study facility is a medium-sized (317 beds, six floors) urban teaching hospital in Ohio, with most patient rooms having overnight capabilities including full restrooms. The hospital receives chlorinated drinking water from the local water utility that uses lime softening to treat its source water that is designated as surface water, and practices pH and alkalinity adjustment for corrosion control. After passing through the community’s distribution system, drinking water enters the hospital at two locations.
The hospital performed sampling of hot and cold water for Legionella by culture between 2006 and 2013. In April 2013, they observed positive samples in the domestic hot water systems for Legionella pneumophila which triggered a more extensive monitoring effort. The hospital contracted with a consultant to survey hot and blended water faucets for the presence of Legionella bacteria prior to initiation of this work. Culture results from 2014 revealed that hot water was positive for L. pneumophila serogroup 1 (sg1) at 71% of sampled faucets, although no cases of legionellosis had been reported. In response, hospital staff systematically flushed every tap in the facility with superheated water once every two weeks. While effective at first, analysis indicated that Legionella reappeared shortly after treatment. Furthermore, patient scalding risk concerns eliminated the possibility of a consistent regular building-wide increase in hot water temperature. The hospital decided to proactively install on-site monochloramine disinfection to the facility’s hot water.
At the time of the study, the Ohio EPA (OEPA) considered installation of monochloramine disinfection to the hospital’s hot water as a treatment process which voided the exemption of 40 CFR Section 141.3(a). For the monochloramine system to be approved, the OEPA required the hospital to submit detailed plans. Upon approval of detail plans the hospital was designated a Class 1, non-transient non-community public water system (PWS), subjected to regular water quality monitoring, reporting and operator staffing (White et al., 2016). The OEPA did not impose all Safe Drinking Water Act (SDWA) standards on the hospital, in accordance with 40 CFR Section 141.29, as they were a purchased water system. However, operational monitoring was required as special conditions of plan approval and was limited to analytes that could be impacted by monochloramine (Table 1).
Table 1.
Ohio EPA (OEPA) sampling requirements of the hospital following monochloramine treatment during this study. OEPA requirements may have changed since this work. Hospital monitoring results will not be presented here. The table does not include the EPA study sampling plan.
| Analyte | Frequency | Sampling Location |
|---|---|---|
| Required OEPA Regulatory Sampling | ||
| Monochloramine | Weekly | Entry Point to DS |
| HPCs | 1 per month then reduced to quarterly | Distribution Point |
| Free ammonia | Daily | Entry Point to DS |
| Nitrate | Daily | Entry Point to DS |
| Nitrite | Daily | Entry Point to DS |
| Lead and copper | Per US EPA LCR | Distribution Cold Water |
| TTHM and HAA5 | 2 sites, 1 per year | Distribution Point |
| Self-Study Sampling | ||
| Monochloramine | Daily | 5 Distribution Points |
| Free ammonia | Daily | 5 Distribution Points |
| Nitrate | Daily | 5 Distribution Points |
| Nitrite | Daily | 5 Distribution Points |
| Legionella | 3 sites, quarterly | Distribution Point |
2.2. Monochloramine system
The monochloramine system was added to the recirculating hot water system in mid-June 2015. The patented system (Sanipur Sanikill, Brescia, Italy) produces monochloramine on-site by combining ammonium ions, supplied as ammonium salt, with sodium hypochlorite (Fig. 1a). An electronic control system was used to maintain an initial desired monochloramine residual of 2–3.5 mg Cl2/L that was eventually adjusted to a target concentration range 1–1.5 mg Cl2/L at all sampling sites in the facility. The system limited the accumulation of excess ammonium ions based on redox potential. The disinfection system was connected to the tempered hot water system that served the two building loops. These two loops were supplied by a single set of hot water tanks and heat exchangers.
Fig. 1.

Photographs of (a) monochloramine on-site generator, (b) sampling site taps with double lever push button, (c) taps with traditional double lever, and (d) shower-heads.
2.3. Water sampling
Water sampling was performed over 16 months between December 2014 and April 2016. “Baseline” (no treatment) sampling was performed monthly between December 2014 and June 2015 for water chemistry parameters, and sampling in March, April and May of 2015 included microbiological samples. Post monochloramine sampling for chemical and microbiological parameters was performed in seven months between June 2015 and April 2016 based in hospital staff availability and hospital activities.
Water samples were collected from 16 locations or sites throughout the hospital. Thirteen hot water samples (cold water was not sampled) were collected throughout the hospital from patient and medical rooms, a rehabilitation facility, and bathrooms (total of eleven sites) (Table 2). The sites were selected to capture differences in water usage, facility age, plumbing material, water age and distance from monochloramine treatment system. Hot water was also collected from shower heads at two of the sites (i.e., a faucet and shower head were collected from the same room). Because the sampling sites were in actual active hospital patient rooms, there were instances where gaining location access during a sampling event was not possible for various reasons (e.g., medical exams or procedures were occurring, potentially infectious patients were in the room, water was in use). The hospital campus and associated plumbing systems were split by age. The “old” section (constructed before 1971) consisted of copper and galvanized materials and was represented by sampling sites 1–5 (Table 2). The “new” section (built after 1983) was plumbed with copper and was represented by sampling sites 6–11. Hot water samples were also collected from two locations in the hot water recirculation loop: the hot water entering the loop (after the boiler) and the hot water return location (before returning to the boiler). Lastly, municipal drinking water entering the hospital was sampled the main entry point. Four different types of taps were represented at the locations: traditional double lever, double lever push button, spigot taps, and shower heads (Fig. 1, Table 2).
Table 2.
Description of EPA study sampling site locations including tap type and water usage. Water usage was based on system operator’s observations and knowledge of building operations. Sampling sites 1–5 were in the “old” section of the building (constructed before 1971) and was plumbed with copper and galvanized plumbing materials. Sampling sites 6–11 were in the “new” section (built after 1983) and was plumbed with copper.
| Sampling site ID | Description | Tap type | Building Section | Usage |
|---|---|---|---|---|
| 1 | Physical therapy wound care sink, 2nd floor | traditional double lever | Old | Frequent |
| 2 | Women’s bathroom sink, 2300 | double lever push button | Old | Frequent |
| 3 | Nuclear medicine west sink, 1st floor | traditional double lever | Old | Seldom |
| 4 | Medical room sink, 6600 | traditional double lever | Old | Seldom |
| 5 | Staff bathroom sink, 6600 | traditional double lever | Old | Seldom |
| 6 | ICU patient room, sink, 3214 | traditional double lever | New | Frequent |
| 7 | Patient surgical recovery room, sink 3903 | traditional double lever | New | Moderate |
| 8A | Patient room, sink, 6102 | traditional double lever | New | Frequent |
| 8B | Patient room, shower, 6102 | shower head | New | Moderate |
| 9 | Adult behavior room, sink, 5128 | double lever push button | New | Seldom |
| 10 | MICU patient room, sink, 4205 | traditional double lever | New | Frequent |
| 11A | Patient room, sink, 4102 | traditional double lever | New | Frequent |
| 11B | Patient room, shower, 4102 | shower head | New | Moderate |
| 12 | Influent water from city supply | spigot | – | – |
| 13 | Hot water loop (CUP 2nd floor) | spigot | – | – |
| 14 | Hot water loop (Return CUP, 2nd floor) | spigot | – | – |
Water samples were collected after random and uncertain stagnation times because locations were actively used by medical staff and patients. This study limitation was unavoidable and should be recognized when evaluating unintended consequences. A series of hot water samples were sequentially collected from each location without pre-flushing as follows: 500 mL (on-site analysis of temperature, dissolved oxygen, pH, free ammonia, nitrite, free chlorine, and monochloramine; with the remaining volume sent to U.S. Environmental Protection Agency (USEPA) (Cincinnati, Ohio) for metals, organic carbon, total ammonia, nitrite, nitrate, orthophosphate, TTHMs, and total alkalinity analyses), out of which 15 mL were poured off and analyzed on-site for oxidation–reduction potential (ORP), pH, temperature and conductivity; 1000 mL (microbial culture of Legionella, heterotrophic plate counts [HPCs], and Pseudomonas); 1000 mL (microbial culture of NTMs); two 1000 mL (pooled for microbial DNA analysis); and lastly, 15 mL (repeat on-site analysis of ORP, pH, temperature and conductivity). Bottles designated for microbiological analyses were sterile and contained sodium thiosulfate (0.1 mL of 3% sodium thiosulfate per 120 mL). The NTM culture sample bottle did not contain sodium thiosulfate based on the work of Thomson et al. (2008).
2.4. Chemical and microbiological analyses
Details regarding the analysis of water sample for chemical and microbiological parameters are provided in the SI. Specifically, field (on-site) measurements (section S1), laboratory water quality analyses (section S2), microbiological (qPCR) analyses (section S3), microbiological (culture-based) analyses (section S4), and statistical analyses (section S5) are fully described.
3. Results
3.1. General water quality
The pH of incoming water ranged between 8.45 and 8.78, and the temperature ranged between 12.3–22.9 °C, with warmer and colder temperatures observed in the summer and winter, respectively (Supporting Information [SI] Table S1) over the entire study period. The calcium, magnesium and total organic carbon (TOC) concentrations averaged 17 mg/L, 26 mg/L and 0.75 mg C/L, respectively, and total hardness averaged 151 mg CaCO3/L. Iron levels entering the hospital were negligible averaging 0.02 mg/L. Total alkalinity, chloride, nitrate and sulfate averaged 89 mg CaCO3/L, 62 mg/L, 1.1 mg N/L and 44 mg/L, respectively, over the entire study. Nitrite and ammonia concentrations were negligible. Seasonal water quality changes, except for temperature and free chlorine (Section 3.2), were not apparent.
Water quality in the hot water outlet and return locations prior to monochloramine addition were similar to the source water with respect to major anion concentrations. Calcium, magnesium, sodium and other cations reflected the impact of ion exchange softening used to treat a fraction (approximately 50% removed) of hot water to minimize scaling issues throughout the study (Table S1). Iron levels in the hot water entry and return locations were elevated, averaging 0.17 mg/L and 0.67 mg/L, respectively, although it should be noted that the return sampling location had elevated individual samples (2.89 and 0.89 mg/L). Hot water temperature in the recirculation loop ranged between 40.2 °C and 50.2 °C over the entire study.
On-site measurements of pH, temperature and ORP at all sampling sites collected at the beginning and end (after approximately 4.5 L) of the sample series were compared pre- and post-chloramination treatment (Table S2). The pH remained relatively consistent between the first and last samples whereas temperature increased from the first to last sample as water was pulled in from the hot water recirculating hot loop (sites 13 and 14). ORP reflects the presence of a disinfectant residual and did not appear to change from the first and last sample. The ORP did, however, increase following treatment reflecting the presence of monochloramine. ORP levels in the building sites were considerably lower than the water entering the hospital reflecting the differences in ORP of a chlorinated versus a chloraminated drinking water (Copeland and Lytle, 2014).
3.2. Chlorine and monochloramine
The free and total chlorine residual entering the hospital over the entire study period averaged 0.81 and 0.78 mg Cl2/L, respectively (Table S1). Free chlorine levels were as high as 1.1 mg Cl2/L in winter months to as low as 0.64 mg Cl2/L during summer months. Prior to monochloramine addition, the free (and total) chlorine residual in the hot water loop averaged 0.04 mg Cl2/L (0.04 mg Cl2/L) and 0.04 mg Cl2/L (0.04 mg Cl2/L) in the outlet and return loop locations, respectively. Enhanced chlorine decay in hot water, extended water age in the large premise plumbing system, and other factors contributed to the chlorine demand.
Following the installation of the monochloramine treatment system, monochloramine levels entering the hot water loop and at the hot loop return averaged 2.01 ± 0.66 mg Cl2/L and 1.96 ± 0.90 mg Cl2/L, respectively (Table S1). Although there was some variability in monochloramine residuals, they were reliably within the initial target dose range of 2–3.5 mg Cl2/L, remained relatively unchanged as the water moved through the loop, and were enough to reach the sampling sites. Total chlorine levels were slightly greater than monochloramine averaging 2.18 ± 0.82 mg Cl2/L (Table S1).
Monochloramine levels in water at sites immediately (within 48 h) after treatment start-up varied widely and ranged between undetectable (<0.03 mg Cl2/L) to 3.9 mg Cl2/L (Fig. 2), while the hot water entering the loop and return locations had 4.01 mg Cl2/L and 3.5 mg Cl2/L, respectively. During this period, monochloramine feed adjustments were being optimized and system demand was likely greatest since previous oxidation–reduction potential (ORP) was low. After the initial sampling event, monochloramine levels in sampling sites averaged between 0.38–2.08 mg Cl2/L (Fig. 2, Table S3) and were lower than the hot water loop that fed them. Differences in concentration between the hot water loop and sampling locations reflected differences in monochloramine degredation rates, plumbing material, stagnation time, and location between sampling taps. Despite the demand, monochloramine residuals were always present in the first 500 mL water draw at all sampling locations including showers during the study. Total chlorine levels were similar to monochloramine levels at all locations throughout the study (Table S2) indicating low free chlorine levels from the treatment plan, and low monochloramine conversion to other chloramine species.
Fig. 2.
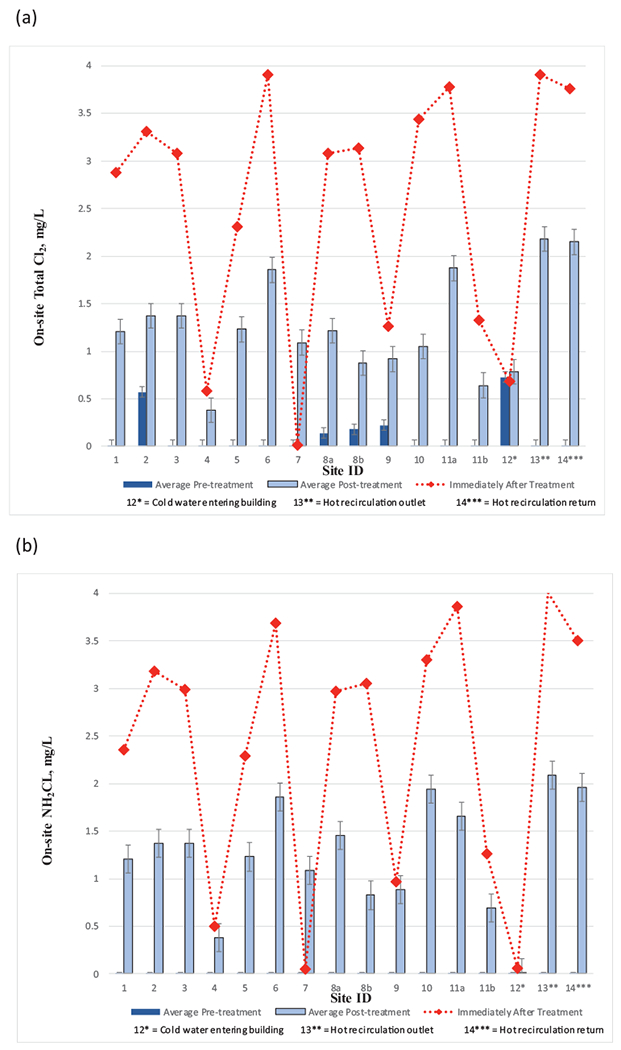
The concentrations of (a) total chlorine, and (b) monochloramine, before and after the installation of the monochloramine feed. Immediately after treatment refers to within 48 h after monochloramine startup. Error bars represent standard deviations.
3.3. Ammonia, nitrite, and nitrate
Monitoring of nitrogen species was required by OEPA (Table 1) and the results can also be used as an indicator of nitrification. Decomposition products of monochloramine include ammonia, nitrate, nitrogen gas, and chloride, whereas biological nitrification can produce nitrite and nitrate. Nitrite and nitrate have acute health-based drinking water maximum contaminant level (MCL) standards of 1 and 10 mg N/L, respectively (USEPA. 1991d).
Free ammonia levels based on-site measurements post-monochloramine treatment were very low, averaging 0.01 ± 0.01 mg N/L and 0.05 ± 0.05 mg N/L at the hot water loop entry and return, respectively (Table S1), closely matching the levels entering the hospital (0.03 mg N/L). Total ammonia (free ammonia and combined ammonia included ammonia associated with monochloramine) based on laboratory analyses averaged 0.41 ± 0.12 mg N/L and 0.40 ± 0.12 mg N/L entering the hot water loop and at the hot loop return (includes first sampling day after treatment start-up), respectively (Table S1). Total ammonia concentrations in the hot water loop corresponded to an average calculated monochloramine dose of approximately 2.08 mg Cl2/L which was consistent with measured values (Table S1). Nitrite and nitrate levels in the hot water loop were essentially unchanged from the source water entering the building. Nitrite levels (based on laboratory analyses) averaged 0.01 ± 0.00 mg N/L and 0.01 ± 0.00 mg N/L entering the hot water loop and at the hot loop return, respectively (Table S1). Nitrate levels averaged 1.24 ± 0.29 mg N/L and 1.11 ± 0.56 mg N/L entering the hot water loop and at the hot loop return, respectively (Table S1), which were nearly the same to nitrate levels entering the hospital. Field on-site screening measurements of nitrite were consistent with laboratory results (Table S1). Hot water loop analysis results indicated that the monochloramine feed consistently met desired target levels without degradation after an initial adjustment period. No indication of nitrification (e.g., increase in nitrite and/or nitrate) was noted throughout the hot water loop that fed the hospital wings.
Average free ammonia levels measured at hospital hot water sampling sites after treatment over the entire study ranged between 0.05–0.33 mg N/L (Table S3), and the highest measured value was 0.71 mg N/L (site 7). Free ammonia levels immediately after treatment start-up were considerably greater than the respective average levels following extended treatment at half of the locations as the treatment system was being adjusted (Fig. 3a). The presence of free ammonia could have resulted from the decay of monochloramine and/or monochloramine reactions with organics, biofilm, pipe metals and other plumbing materials. Total ammonia levels were considerably greater than average levels at nearly every location during the first sampling event collected within 48 h after monochloramine treatment start-up before the chemical feed system was adjusted and optimized. During this adjustment period, total ammonia levels ranged from 0.14–0.89 mg N/L at sampling locations and the hot water loop was 0.76 mg N/L (Fig. 3b). The range of total ammonia levels was consistent with corresponding total chlorine and monochloramine levels (Fig. 2). Except for sampling site 6, average total ammonia concentrations after the initial post treatment sampling event were near or below the average total ammonia concentration in the hot water recirculation loop (0.4 mg N/L) and ranged between 0.21–0.45 mg N/L (Fig. 3b). Differences in total ammonia concentration decrease were likely associated with sampling site-specific differences in monochloramine decomposition pathways and product distributions and/or nitrification.
Fig. 3.
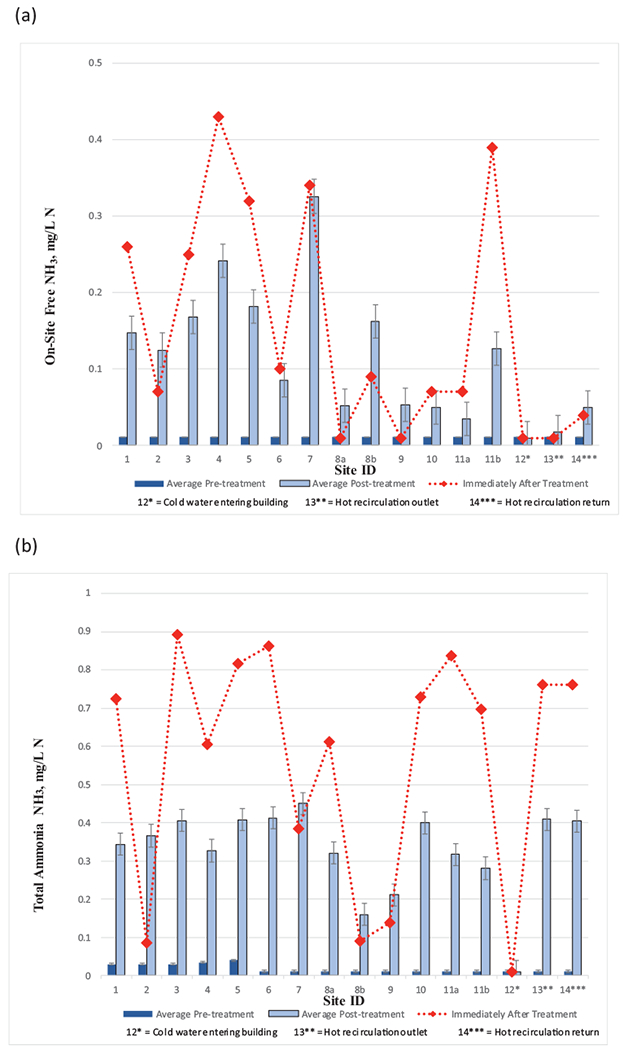
The concentrations of (a) free ammonia, and (b) total ammonia, before and after the installation of the monochloramine feed. Immediately after treatment refers to within 48 h after monochloramine startup. Error bars represent standard deviations.
Field measured nitrite levels pre- and post- monochloramine treatment averaged low, ranging between 0.010–0.10 mg N/L (Fig. 4a, Table S3). Site 4 had the greatest average nitrite concentration. Laboratory analysis results were consistent with field measurements. The highest recorded nitrite level recorded post-monochloramine addition was 0.20 mg N/L at site 4. Low nitrite levels could indicate nitrification was not a concern.
Fig. 4.
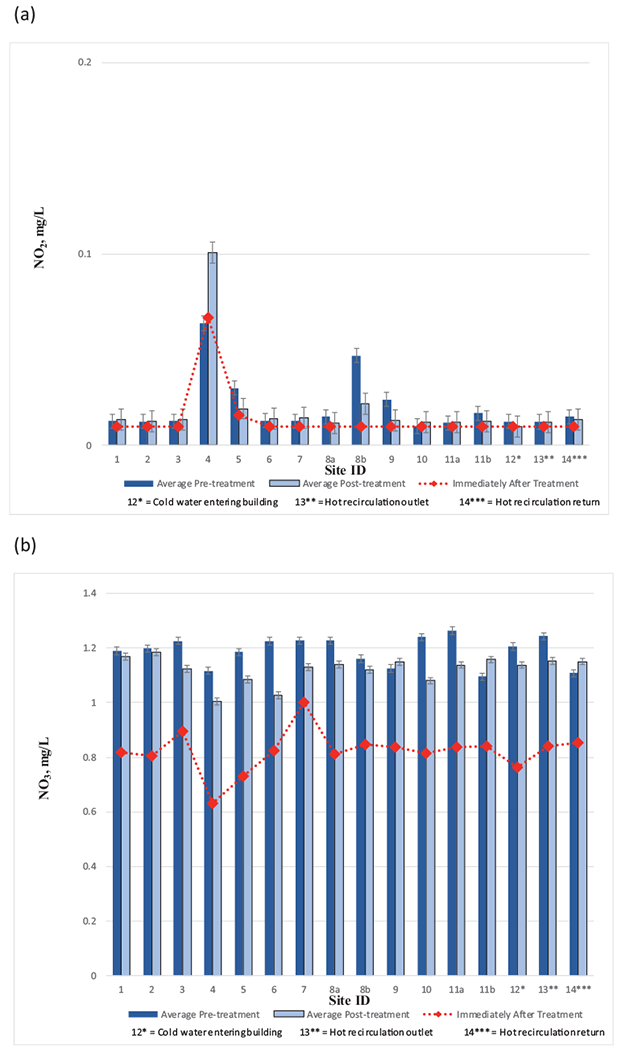
The concentrations of (a) nitrite, and (b) nitrate, before and after the installation of the monochloramine feed. Immediately after treatment refers to within 48 h after monochloramine startup. Error bars represent standard deviations.
Average nitrate levels at sampling sites prior to and post monochloramine treatment ranged between 1.09–1.26 mg N/L and 1.01–1.19 mg N/L, respectively (Fig. 4b, Table S3), which were both well within the bounds of the city water entering the hospital prior to and post monochloramine treatment 1.21 ± 0.28 mg N/L and 1.13 ± 0.20 mg N/L, respectively. The absence of increase in nitrate (or nitrite) concentration indicates an environment not conducive to nitrification over the study period.
3.4. Disinfection byproducts
In this study, chlorinated disinfection byproducts, total trihalomethanes (TTHMs), in drinking water entering the hospital and at hot water locations were monitored during three sampling events prior to and three sampling events post-monochloramine treatment (Figure S1). TTHMs in the cold water entering the facility were 28 μg/L and 34 μg/L in the successive sampling dates prior to monochloramine addition (Figure S1a). TTHMs increased to as high as 54 μg/L (94%) (site 10) and 43 μg/L (26%) (site 1) on corresponding dates between the hospital entry point sampling location and the hot water recirculation loop as chlorine was consumed through reactions with organic matter in the water and plumbing surfaces (Figure S1a). Additional increase in TTHM levels in plumbing between the hot water recirculation loop and site sampling locations was generally minimal (Figure S1a) likely because little to no free chlorine residual was present (i.e., much of TTHM formation was assumed to have occurred in the cold water). Chloroform was the specific TTHM that observed the greatest increase as water moved through the facility, increasing from 7 μg/L in the water entering the hospital to a maximum of 29 at site 10 in April 2015 (Figure S1b), for example, at the hot water sampling taps throughout the hospital. The addition of monochloramine did not increase TTHM formation (Figure S1a).
Nitrosamine compounds including N–Nitroso-dimethyline (NDMA) have been linked to monochloramine disinfection byproducts. One set of NDMA samples were analyzed from all sampling locations post-monochloramine treatment installation. NDMA was not detected (< 2.5 ng/L) in any water sample.
3.5. Lead, copper and iron
Although a complete suite of metals was routinely analyzed at all sampling locations, no regulated metals were found above the respective MCLs and therefore, except for lead, copper, and iron, are not presented. Lead and copper have “action levels” (ALs) of 0.015 mg/L and 1.3 mg/L, respectively, in a 1 L water sample collected from faucets after more than 6 h of stagnation as described under the USEPA’s Lead and Copper Rule (LCR) (USEPA, 1991a, 1991b, 1991c). Although water samples collected under the study plan were not performed in accordance with the LCR protocol (i.e., samples were collected from hot water and, in some cases, showers, and were not 1 L first draw samples collected after 6 h of stagnation), examination of the data is worthwhile. Monochloramine addition did not impact lead and copper concentrations in drinking water through the hospital (Figure S2). Prior to the initiation of monochloramine, the mean and standard error for lead and copper were 0.003 ± 0.006 mg/L and 0.071 ± 0.055 mg/L, respectively. The median lead and copper levels were 0.002 mg/L and 0.071 mg/L, respectively. Following the addition of monochloramine, the mean and standard error for lead and copper were 0.003 ± 0.004 mg/L and 0.056 ± 0.024 mg/L, respectively. The median lead and copper levels were 0.003 mg/L and 0.054 mg/L, respectively. Considering all samples, lead ranged from the analytical method detection limit of 0.002- 0.043 mg/L. Only three water samples (all shower samples) out of 218 samples (1.4%) (pre- and post-treatment) had lead levels above the 0.015 mg/L AL. Copper ranged from the analytical method detection limit of 0.001–0.388 mg/L and all levels were all well below the AL.
LCR sampling of cold-water taps at twenty locations in the hospital were required given the small shared temperature volume in some faucets. The facilities staff selected taps based on distance of the location from drinking entry point and plumbing age. Since the initiation of monochloramine treatment, three LCR sampling events have been performed. Only five compliance samples (out of sixty total samples or 8%) had lead levels above the reporting limit (2 μg/L), the highest of which was 5.6 μg/L. Copper compliance samples ranged between 0.021–0.219 mg/L across all events.
There was no apparent impact of monochloramine addition on iron levels (Figure S3). Prior to the initiation of monochloramine treatment, the mean and standard error for iron for all sites was 0.17 ± 0.41 mg/L (median concentration was 0.02 mg/L). Following the addition of monochloramine, the iron concentration was 0.14 ± 0.37 mg/L (median of 0.01 mg/L). There were individual sites that had relatively high average iron levels before and/or after monochloramine treatment, although they could generally be attributed to one iron spike (likely particulate in nature). For example, site 3 (post-treatment) and site 5 (pre-treatment) had iron spikes of 2.45 mg/L and 1.59 mg/L, respectively. Elevated iron spike observances appeared to be more prevalent in the old section of the hospital where galvanized materials had been used.
3.6. Legionella
Cold water entering the hospital contained no detectable culturable Legionella. Legionella culture results prior to the addition of monochloramine (5–7 monthly sampling events per location) showed that the frequency of positive Legionella detects in hot water taps ranged from 0 to 100% per room (faucets and shower-heads) (Table 3), and 9 of the 13 sampling (room) sites had detects >50% of the time. Sampling Site 7 never had a positive Legionella detect and Sites 9 and 6 only had one and two detects, respectively, prior to monochloramine addition. There was no apparent relationship between Legionella detects, faucet type (traditional double lever versus double lever push button) and observed water usage trends. Furthermore, Legionella positive samples in showerhead water samples were only more frequent than the faucet sampled from the same location (Table 3, Site 8a and 8b, and 11a and 11b) in one of the two locations. However, there was a much greater frequency of detects in the old section of the building (sites 1–5), where 97% (30/31) of samples collected were Legionella positive before monochloramine treatment, and presumptive Legionella colonies ranged from 10,000 to nearly 100,000 CFU/L. By contrast, 47% (24/51) of all samples or 39% (15/38) of samples excluding shower sites in the new building section were positive. Interestingly, positive Legionella detects were not predictable as they varied within sites from month to month (not shown). Legionella was detected in the hot water recirculation loop outlet and return 86% and 71% of the time, respectively (Table 3). Considering all 96 hot water samples collected in the hospital prior to monochloramine addition, 68% were Legionella positive, which was consistent with the 2014 independent building investigation. The positivity rate was well above the empirically derived 30% positivity threshold above which it has been suggested action should be taken to lower risk for disease transmission (Stout et al., 2007; VHA 2008).
Table 3.
Legionella culture monitoring results pre- and post-monochloramine treatment. Results are presented by indicating presence (positive).
|
Legionella by Culture |
||
|---|---|---|
| Sampling Site ID | Positives Pre-monochloramine | Positives Post-monochloramine |
| 1 | 6/6 (100%) | 0/7 (0%) |
| 2 | 5/5 (100%) | 1/6 (17%) |
| 3 | 7/7 (100%) | 0/7 (0%) |
| 4 | 6/6 (100%) | 1/7 (14%) |
| 5 | 6/7 (86%) | 0/7 (0%) |
| 6 | 2/7 (29%) | 0/6 (0%) |
| 7 | 0/6 (0%) | 0/7 (0%) |
| 8A | 4/7 (57%) | 0/7 (0%) |
| 8B | 3/7 (43%) | 0/7 (0%) |
| 9 | 1/5 (20%) | 1/7 (14%) |
| 10 | 5/7 (71%) | 0/5 (0%) |
| 11A | 3/6 (50%) | 0/7 (0%) |
| 11B | 6/6 (100%) | 3/6 (50%) |
| 13 | 6/7 (86%) | 0/7 (0%) |
| 14 | 5/7 (71%) | 0/7 (0%) |
| Totals | 65/96 (68%) | 6/100 (6%) |
After monochloramine start-up, Legionella was never detected in the hot water recirculation outlet (site 13) and return loop (site 14), and in the water entering the hospital (site 12) (Table 3). In initial sampling performed six days after the onset of chloramination, all 15 sites (excluding cold water entering the hospital) were negative for Legionella whereas 10 of 15 sites were positive during the last sampling event prior to treatment start-up (data not shown). Legionella detects in hot water following the addition of monochloramine (5–7 monthly sampling events per sampling location) ranged from 0 to 50% per site and detect frequency was reduced at all sites (Table 3). Nine sampling sites had no detects and three sites had only 1 Legionella detect after monochloramine addition. The shower head sampled in location 11 (site 11b) had Legionella detected in 50% of the samples. Considering all 100 hot water samples collected in the hospital after monochloramine addition, only 6% (6/100) were positive with Legionella, far less frequent than before treatment. The improvement was noteworthy in the old building section where the number of Legionella positives decreased to 6% (2/34) after monochloramine addition with the highest colony count of 750 CFU/L.
Legionella spp. were not detected in the water entering the hospital at any stage of the study based on qPCR analysis. A summary of qPCR testing for Legionella (16S) in water samples from the rooms showed that there were significant differences of average levels between pre- (7040 cell equivalents [CE]/L) and post-monochloramine treatment (200 CE/L) (Fig. 5a). Sample site 6 was an anomaly in that Legionella was never detected in water samples despite being detected by culture method (albeit relatively infrequently). Although Legionella spp. levels appeared to be higher in shower heads (pretreat: 200 CE/L) as compared to adjacent faucets in the same room (room 8 and 11), the differences were not statistically different (p8=0.123 and p11=0.280). This was consistent with culture results as well. Legionella in the hot water outlet (site 13) and return loop (site 14) averaged 1350 CE/L and 638 CE/L, respectively, showed no significant difference (p13–14=0.162) and were in most cases lower than the average levels in room sampling sites, suggesting Legionella was replicating between the hot water loop and the plumbing lines to the faucets. There were also no significant differences between traditional double lever faucets and shower head (p8A-8B=0.121, p11A-11B=0.199). The further detection showed that 100% of Legionella occurrence and copy number prior to treatment were L. pneumophila (Fig. 5b), and the occurrence and copy numbers of L. pneumophila sg 1 accounted for 99% and 62% of the L. pneumophila, respectively (Fig. 5c). In general, Legionella numbers were higher as a group in the old section of the hospital (sites 1–5).
Fig. 5.
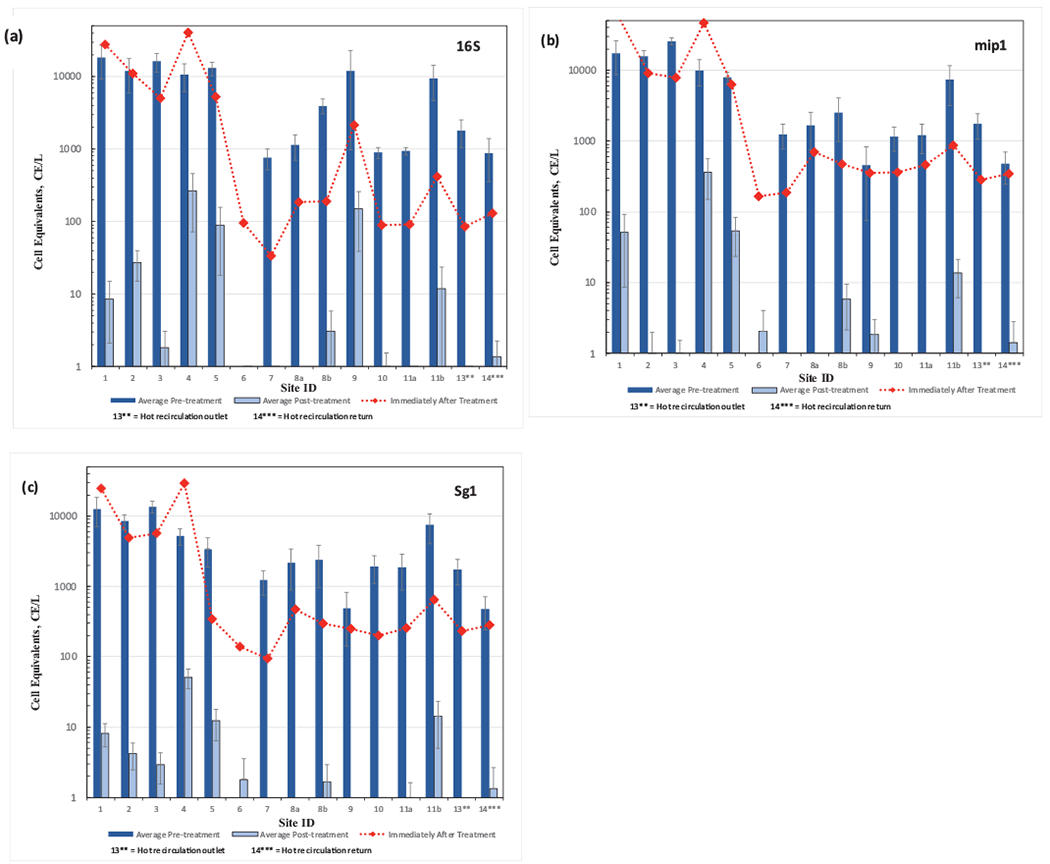
Results from qPCR analysis of water samples at all locations before and after monochloramine treatment (a) to Legionella spp, (b) Legionella pneumophila, and (c) Legionella pneumophila sg 1. Immediately after treatment refers to within 48 h after monochloramine startup. Site 12, municipal drinking water entering the hospital, did not have detections and is not shown. Non-detect data points below CE 1/L are not shown. Error bars represent standard deviations.
3.7. NTMs, HPCs and pseudomonas by culture methods
NTM were never detected by culture (< 5 CFU/200 mL) before or after monochloramine treatment at 27% of sampling sites (Sites 6, 7, 10, 11a) (Table 4, Fig. 6a) and the cold water entry site. Presumptive NTM levels in the old section of the building (sites 1–5) were greater than the new section of the building (sites 6–11) throughout the study. Five sites including the hot water recirculation outlet (site 13) and return loop (site 14) had detections higher on average before monochloramine treatment but not after (Sites 4, 8a, 8b, 13, and 14). NTM were detected continuously at one site, site 2, during the entire study and at relatively high levels (>400 CFU/200 mL water sampled).
Table 4.
Heterotrophic bacteria and Mycobacterium culture monitoring results pre- and post-monochloramine treatment (* data was normally distributed).
| Heterotrophic bacteria CFU/mL |
Mycobacterium CFU/200 mL |
||||||||
|---|---|---|---|---|---|---|---|---|---|
| n | avg | std | Signif at 0.05 | n | avg | std | Signif at 0.05 | ||
| Site 1 | Pre | 6 | 10,453 | 16,435 | Y | 4 | 400 | 0 | Y |
| Post | 4 | 2.8 | 2.3 | P = 0.01 | 7 | 5.9 | 10.2 | P = 0.006 | |
| Site 2 | Pre | 5 | 14,310 | 16,357 | N* | 3 | 269 | 228 | N |
| Post | 3 | 107 | 82.8 | P = 0.124 | 5 | 392 | 18 | P = 0.786 | |
| Site 3 | Pre | 7 | 3914 | 3927 | Y | 3 | 400 | 0 | Y |
| Post | 4 | 12.1 | 21.6 | P = 0.006 | 7 | 9 | 15.3 | P = 0.017 | |
| Site 4 | Pre | 6 | 6276 | 3671 | N* | 3 | 400 | 0 | Y |
| Post | 2 | 2833 | 2573 | P = 0.420 | 7 | 1.3 | 2.4 | P = 0.017 | |
| Site 5 | Pre | 6 | 8690 | 8272 | N | 3 | 400 | 0 | Y |
| Post | 3 | 2845 | 4595 | P = 0.262 | 7 | 6.6 | 13.9 | P = 0.017 | |
| Site 6 | Pre | 7 | 6830 | 17,149 | N | 3 | 3 | 1.5 | N* |
| Post | 3 | 3.3 | 5.8 | P = 0.067 | 6 | 0.4 | 0.8 | P = 0.081 | |
| Site 7 | Pre | 6 | 2022 | 4765 | N | 3 | 1.7 | 1.2 | N |
| Post | 3 | 30.3 | 51.7 | P = 0.167 | 7 | 0.7 | 1.9 | P = 0.117 | |
| Site 8A | Pre | 7 | 387 | 888 | Y | 4 | 52.2 | 104 | N |
| Post | 4 | 0.3 | 0.5 | P = 0.024 | 7 | 0.7 | 1.9 | P = 0.412 | |
| Site 8B | Pre | 5 | 4715 | 5861 | N* | 4 | 258 | 100 | Y |
| Post | 3 | 1741 | 1509 | P = 0.286 | 7 | 0.9 | 2.5 | P = 0.006 | |
| Site 9 | Pre | 5 | 34,587 | 43,883 | N* | 4 | 45.9 | 54.5 | N |
| Post | 4 | 1613 | 1780 | P = 0.125 | 7 | 15.9 | 32.1 | P = 0.369 | |
| Site 10 | Pre | 5 | 325 | 705 | N | 4 | 1.8 | 0.6 | Y* |
| Post | 4 | 2.3 | 2.3 | P = 0.556 | 5 | 0.2 | 0.3 | P = 0.012 | |
| Site 11A | Pre | 6 | 135 | 283 | N | 4 | 4.9 | 5.2 | Y |
| Post | 4 | 52.5 | 102 | P = 0.914 | 7 | 0.29 | 0.4 | P = 0.006 | |
| Site 11B | Pre | 5 | 14,086 | 28,270 | N | 4 | 235 | 194 | Y |
| Post | 2 | 723 | 1022 | P = 0.571 | 7 | 57.1 | 151 | P = 0.042 | |
| Site 13 | Pre | 6 | 1138 | 2755 | N | 4 | 65.0 | 97.4 | N |
| Post | 4 | 2.5 | 4.4 | P = 0.352 | 7 | 0.1 | 0.2 | P = 0.412 | |
| Site 14 | Pre | 7 | 61.2 | 135 | N | 4 | 119 | 190 | Y |
| Post | 4 | 4.3 | 7.2 | 0.527 | 7 | 0.7 | 1.5 | P = 0.012 | |
Fig. 6.
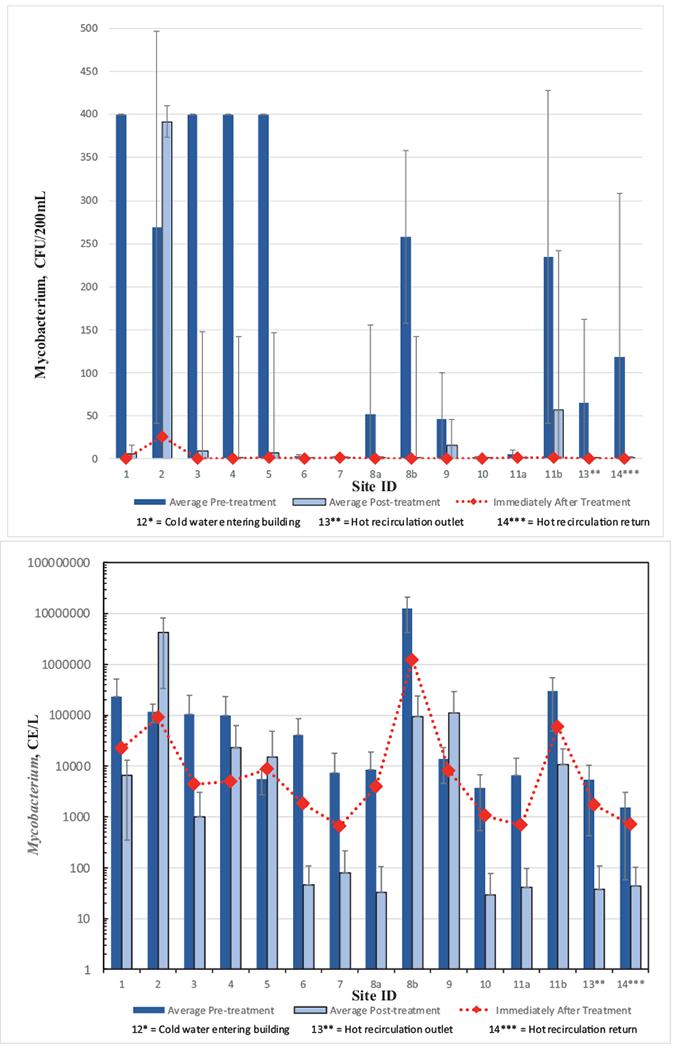
Mycobacterium analysis of water samples at all locations before and after monochloramine treatment (a) by culture method, and (b) by qPCR. Immediately after treatment refers to within 48 h after monochloramine startup. Site 12, municipal drinking water entering the hospital, did not have detections and is not shown. Error bars represent standard deviations.
Examining the data more closely, an interesting observation was that NTM were not detected at any location except site 2 (26 ± 37 CFU/200 mL) during the June 2015 sampling period collected within six days after treatment start-up (Fig. 6a). In sampling performed after the initial monochloramine start-up samples, seven sites showed statistically significant decreases in average NTM concentrations, including sites 1, 3, 4, 5, 8b, 11b and 14 (Fig. 6a, Table 4). Except for site 2, monochloramine decreased average NTM levels in the old section of the hospital. It is also noteworthy that although statistical NTM differences in pre- and post-treatment samples were not identified in sites 8a and 13 (hot loop entry location), average post-treatment levels were below detection on average. Statistical analyses were not performed on the four sites that had average NTM levels below detection.
Of 139 isolates submitted for 16S rRNA gene sequencing, 118 isolates produced high quality sequences. Of those, 51 were putative NTM species. Thirty Mycobacterium isolates were obtained prior to addition of monochloramine treatment from seven sites (sites 1, 2, 5, 6, 9, 11a, 14) and 21 isolates were obtained after treatment was added from three sites (sites 2, 3, 9). A breakdown of Mycobacterium species recovered before and after treatment are in Table 5. The growth medium for mycobacteria is not genus selective, and seven other isolates identified as potential pathogens were obtained, all of which were isolated after addition of monochloramine treatment: Neiserria subflava (site 10), Pseudomonas mendocina (sites 3, 4, 5), Pseudomonas stutzeri (site 2), and Stenotrophomonas maltophila (site 1). Other isolates were not known to be pathogenic (e.g., Bradyrhizobia species, Rhodopseudomonas species, Brevibacillus species).
Table 5.
Number and species of mycobacteria isolated before and after addition of monochloramine.
| Site | Faucet type | Room type | Isolate ID (no. of isolates) Before monochloramine | Isolate ID (no. of isolates) After monochloramine |
|---|---|---|---|---|
| 1 | Double lever | Physical therapy wound care | M. gordonae (1) | |
| 2 | Push button | Psychiatric patient room | M. phocaicum (1) |
M. phocaicum (8) M. liatzerense (1) Mycobacterium spp. (1) |
| 3 | Double lever | Nuclear medicine lab | M. gordonae (1) | |
| 5 | Double lever | Staff bathroom sink |
M. gordonae (2) M. mucogenicum (3) M. phocaicum (3) |
|
| 6 | Double lever | ICU patient room | M. kansasii (3) | |
| 9 | Push button | Adult behavior room | M. phocaicum (3) |
M. phocaicum (9) M. mucogenicum (1) |
| 11A | Double lever | Patient room |
M. kansasii (3) M. mucogenicum (2) |
|
| 14 | spigot | Hot water return loop | M. kansasii (9) |
Average HPC measurements were consistently higher in the pre-chloramination samples when compared to post-chloramination (Fig. 7, Table 4). As a point of reference, before treatment, only four sites had average HPC levels below the recommended upper limit of 500 CFU/mL (USEPA, 1989) whereas after treatment, ten sites were below, although the limit was not intended to be applied to buildings. However, due to high temporal variability for most sampling sites before monochloramine treatment (see calculated standard deviations, Table 4), statistical testing at the 0.05 significance level indicated that only three sites (1, 3 and 8a) showed significant HPC differences after treatment.
Fig. 7.

Heterotrophic bacteria analysis of water samples at all locations before and after monochloramine treatment. Immediately after treatment refers to within 48 h after monochloramine startup. Site 12, municipal drinking water entering the hospital, did not have detections and is not shown. Dashed line represents 500 CFU/mL. Non-detect data points below 1 CFU/mL are not shown. Error bars represent standard deviations.
Methods for testing of P. aeruginosa, which provide results within 24 h, produced largely negative results in both pre- and post-chloramination. Overall, only six of 102 samples (6%) tested positive in the pre-chloraminated testing and nine out of 85 samples were positive post-chloramination. In seven of the 15 samples that were positive by the assay, the MPN value was greater than the largest possible value (>2420 MPN/100 mL).
3.8. Mycobacterium, vermamoeba vermiformis and pseudomonas aeruginosa by qPCR methods
Mycobacterium results using genus-specific qPCR primers showed that average cell equivalents (CEs) for the pre-chloramination samples were consistently higher than in the post-chloramine treated samples except sites 2 and 9 (Fig. 6b) and there were not detections in cold water entering the hospital. Site 2 was also identified as a problematic site with respect to NTM levels by culture as well (Fig. 6a). Although averages were lower at all other sites following treatment, the decreases were not statistically significant (P > 0.05) at five sites (sites 2, 4, 5, 9, and 14). Decreases in Mycobacterium levels were generally observed at most sites shortly after treatment start-up (June 2015) when compared to mean levels before treatment at most sites; however, the reductions were not as evident as the culture results. M. avium were not detected by qPCR at any location during the study. M. intracellulare/chimera were detected by qPCR in six samples: five samples in April 2015, prior to chloramination addition (sites 3, 5, 11B, 12, and 14) and one sample after addition of chloramination in June 2015 (site 1). All detections were below the limit of quantification (<10 CE).
The qPCR results for Pseudomonas aeruginosa and Vermamoeba vermiformis showed measurable CE levels in most of the pre-chloramination samples, with rare detections in the post-chloramination samples (Fig. 8) and no detections in cold water entering the hospital. For these two assays, except in rare cases, the CE levels dropped to non-detection or very low in the sampling event immediately after chloramination was initiated (June 2015 sampling event). For the Pseudomonas aeruginosa ecfx gene primer sets, 19 of 45 samples had measurable CE levels pre-chloramination, ranging from 0 to 62,112 CE/L, while in the post-chloramination samples only one of 90 samples had a detection (excluding June 2015 sampling event). For the Vermamoeba vermiformis assay, 40 of 45 samples tested were positive pre-chloramination with CE values ranging from 0 to 8424 CE/L and for post chloramination samples, 16 of 86 samples had CEs above the detection limit (excluding the June 2015 sampling event). In general, both results prior to treatment were higher as a group in the old section of the hospital (sites 1–5).
Fig. 8.
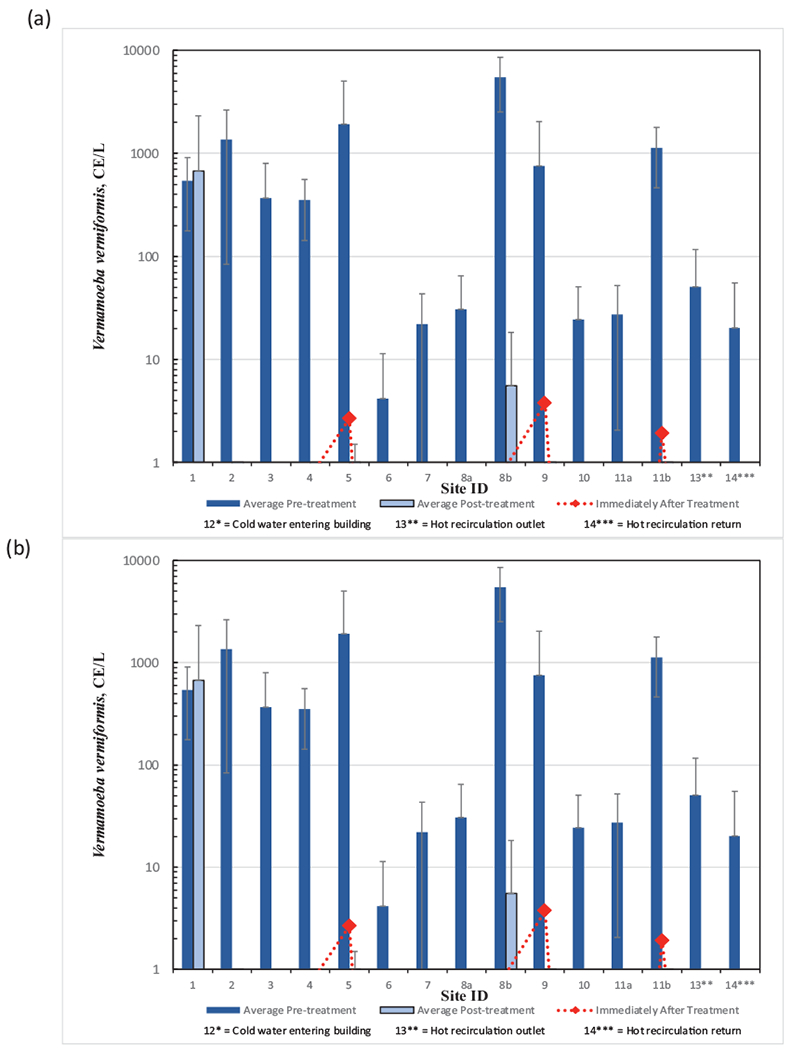
Results from qPCR analysis of water samples at locations before and after monochloramine treatment (a) Pseudomonas aeruginosa, and (b) Vermamoeba vermiformis. Immediately after treatment refers to within 48 h after monochloramine startup. Site 12, municipal drinking water entering the hospital, did not have detections and is not shown. Non-detect data points below 1 CE/L are not shown. Error bars represent standard deviations.
4. Discussion and conclusions
The on-site monochloramine generation system performed within the parameters recommended by the manufacturer and maintained detectable concentrations of monochloramine without exceeding the respective MRDL at any hot water site monitored during the 16-month study period. Given the random nature of sampling and uncertain stagnation period before sampling, it was impressive that significant monochloramine residuals were always present. Free ammonia levels were minimal at building sample taps and there were no water quality indications that nitrification was occurring in the hospital during the study following the introduction of monochloramine. The role of hot water in inhibiting nitrification could be important in this observation. There were no other water quality changes or known unintended consequences after monochloramine addition including increases in lead and copper, iron and disinfection by-products including NDMA, although these conclusions were based on a single sampling event.
Reduction in culturable Legionella was the most notable of the microbiological evaluations. The number of taps that tested culture positive decreased from 68% prior to chloramination to 6% after chloramination, which is well below the 30% positivity threshold for action to lower risk for disease transmission (Stout et al., 2007; VHA, 2008). It was also notable that culturable Legionella decreased below the limit of detection at all 15 sampling sites (excluding cold water entering the hospital) six days following the onset of chloramination. Sites from the old section of the hospital (sites 1–5) exhibited high presumptive Legionella colonies prior to chloramination but were reduced after monochloramine addition. Considering all pre- and post-treatment samples, Legionella based on culture were significantly reduced (p < 0.001) after monochloramine treatment (Table 6). Legionella qPCR trends generally followed culture trends. Legionella culture and qPCR results differed with respect to the first sampling event performed six days after chloramination treatment was initiated. Legionella culture results exhibited an immediate conversion to no growth on the plates whereas the qPCR signal remained high before dropping off after subsequent sampling events. This potentially corresponds to a time period where Legionella cells may have entered a viable but non-culturable (VBNC) state but were subsequently inactivated after prolonged exposure to monochloramine. Alternatively, the large number of positive qPCR CE values may be from the sloughing off as dead or dying cells since the first sampling event was just six days after chloramination was started. Considering all pre- and post-treatment samples, Legionella pneumophila sg1 based on qPCR results were significantly reduced (p = 0.006) after monochloramine treatment (Table 6).
Table 6.
Summary of all microbiological parameters before and after monochloramine treatment. Results and statistical comparisons consider all samples collected.
| Microbiological Parameter | Units | Pre-Treatment | Post-Treatment | Significance |
|---|---|---|---|---|
| HPC (culture) | CFU/mL | 6952 CFU/mL | 1204 CFU/mL | Yes, p<0.05 (p<0.001) |
| Mycobacterium (culture) | positivity | 33/54 (61%) | 14/101 (14%) | Yes, p<0.05 (p<0.001) |
| Legionella (culture) | positivity | 65/96 (68%) | 6/100 (6%) | Yes, p<0.05 (p<0.001) |
| Legionella pneumophila sg1 (qPCR) | positivity | 40/48 (83%) | 31/91 (34%) | Yes, p<0.05 (p = 0.006) |
| Mycobacterium (qPCR) | positivity | 44/48 (92%) | 59/91 (65%) | No, p>0.05 (p = 0.11) |
| Pseudomonas aeruginosa (qPCR) | positivity | 19/48 (40%) | 1/96 (1%) | Yes, p<0.05 (p = 0.011) |
| Vermamoeba vermiformis (qPCR) | positivity | 42/48(88%) | 16/92 (17%) | Yes, p<0.05 (p<0.001) |
Heterotrophic bacteria culture results exhibited large variability between sampling events. Although average HPC values were consistently lower after chloramination, variability (i.e., large standard errors) between sampling events, particularly before treatment, contributed to the outcome that only three sites significantly decreased after treatment. However, considering all pre- and post-treatment samples, HPCs were significantly reduced (p < 0.001) by 83% after monochloramine treatment (Table 6). The results were consistent with the observations of Duda et al. (2014). HPCs did not statistically correlate to Legionella indicating that they were not a reliable indicator of Legionella but results generally reflected disinfection system operations.
NTM culture results showed that 64% (7/11) of sampling sites with detection before treatment had a significant reduction in NTM CFUs after treatment. Again, sites 1–5 and the shower sites had the highest levels of NTM colonies. NTMs were significantly reduced from 61% to 14% positivity (p < 0.001) after monochloramine treatment (Table 6). The Mycobacterium genus-specific qPCR results were highly variable. When comparing culture and qPCR results over the entire testing period, seven of 15 sites were positive 100% of the time for qPCR testing whereas only one site was 100% positive for culture testing. Site 2 was positive 100% of the time for both culture and qPCR. On average, Mycobacterium levels indicated by qPCR generally decreased after monochloramine treatment although the difference was not as apparent as culture results. Considering all pre- and post-treatment samples, Mycobacterium positivity was reduced from 92% to 65%; however, the difference was not statistically significant (p < 0.11) (Table 6). Although biofilm analyses were not performed, one possible explanation for differences between culture and qPCR results could be NTM survived in the biofilm.
The qPCR testing for Pseudomonas aeruginosa demonstrated a significant decrease (p = 0.011) of signal post-chloramination (Table 65). Considering all samples, 40% positivity pre-monochloramine treatment decreased to 1% post-treatment.
The qPCR testing for the amoeba Vermamoeba vermiformis demonstrated a significant decrease (p < 0.001) of signal post-chloramination. Considering all samples, 88% positivity pre-monochloramine treatment decreased to 17% post-treatment. If chloramination truly inactivates a broad range of grazing biofilm protozoans, this would eliminate a vector for NTMs and Legionella as they are known to be associated with intracellular infection and transmission.
Lastly, the most apparent association with poor microbiological water quality in the hospital was the age of plumbing and the shower. Old plumbing and the presence of galvanized plumbing appeared to more likely to harbor Legionella and other microorganisms prior to treatment perhaps due to factors including time to colonize building plumbing and the protective nature of iron corrosion by-products. Shower locations may be more susceptible to Legionella and biofilm growth because of the relative lack of use.
Supplementary Material
Acknowledgements
The authors acknowledge the hospital’s management and staff for facilitating this sampling effort and the Ohio EPA for support. We would also like to acknowledge Maily Pham and Dan Williams of the USEPA for assistance with analyses of water samples, and Ken Rotert and Dave Wahman of the USEPA for providing manuscript reviews. At the time of this work, Colin White was supported by a graduate research traineeship through Cooperative Agreement Grant CR 83558601 from the USEPA to the University of Cincinnati.
Footnotes
Notice
The information in this article has been reviewed in accordance with the U.S. Environmental Protection Agency’s (USEPA’s) policy and approved for publication. The views expressed in this article are those of the authors and do not necessarily represent the views or the policies of USEPA. Any mention of trade names, manufacturers, or products does not imply an endorsement by the U.S. Government or USEPA; USEPA and its employees do not endorse any commercial products, services, or enterprises. This project was supported in part by an appointment to the Research Participation Program at the Office of Research and Development, USEPA, administered by the Oak Ridge Institute for Science and Education through an interagency agreement between the U.S. Department of Energy and USEPA.
Declaration of Competing Interest
The authors declare that they have no known competing financial interests or personal relationships that could have appeared to influence the work reported in this paper.
Supplementary materials
Supplementary material associated with this article can be found, in the online version, at doi:10.1016/j.watres.2020.116656.
References
- Anaissie EJ, Penzak SR, Dignani MC, 2002. The hospital water supply as a source of nosocomial infections. Arch. Intern. Med 162, 1483–1492. [DOI] [PubMed] [Google Scholar]
- Baron JL, Kirk Harris J, Holinger EP, Duda S, Stevens MJ, Robertson CE, Ross KA, Pace NR, Stout JE, 2015. Effect of monochloramine treatment on the microbial ecology of Legionella and associated bacterial populations in a hospital hot water system. Syst. Appl. Microbiol 38, 198–205. [DOI] [PubMed] [Google Scholar]
- Baron JL, Vikram A, Duda S, Stout JE, Bibby K, 2014. Shift in the microbial ecology of a hospital hot water system following the introduction of an on-site monochloramine disinfection system. PLoS ONE 9, e102679. [DOI] [PMC free article] [PubMed] [Google Scholar]
- Casini B, Buzzigoli A, Cristina ML, Spagnolo AM, DelGiudice P, Brusaferro S, Poscia A, Moscato U, Valentini P, Baggiani A, Privitera G, 2014. Long-term effects of hospital water network disinfection on Legionella and other waterborne bacteria in an Italian University Hospital. Infect. Control Hosp. Epidemiol 35 (3), 293–299. [DOI] [PubMed] [Google Scholar]
- Choi J, Valentine RL, 2002. Formation of N-nitrosodimethylamine (NDMA) from reaction of monochloramine: a new disinfection byproduct. Water Res. 26, 817–824. [DOI] [PubMed] [Google Scholar]
- Copeland A, Lytle DA, 2014. Measuring the oxidation-reduction potential of important oxidants in drinking water. J. Am. Water Works Assoc 106 (1), E10–E20. [Google Scholar]
- Demirjian A, Lucas CE, Garrison LE, Kozak-Muiznieks NA, States S, Brown EW, Wortham JM, Beaudoin A, Casey ML, Marriott C, Ludwig AM, Sonel AF, Muder RR, Hicks LA, 2015. The importance of clinical surveillance in detecting Legionnaires’ disease outbreaks: a large outbreak in a hospital with a Legionella disinfection system – Pennsylvania, 2011-2012. Clin. Infect. Dis 60, 1596–1602. [DOI] [PubMed] [Google Scholar]
- Donlan R, Murga R, Carpenter J, Brown E, Besser R, Fields B, 2002. Monochloramine disinfection of biofilm-associated Legionella pneumophila in a potable water model system. In: Marre R, Kwaik YA, Bartlett C (Eds.), Legionella. American Society for Microbiology, Washington, DC, pp. 406–410. [Google Scholar]
- Duda S, Kandiah S, Stout JE, Baron JL, Yassin M, Fabrizio M, Ferrelli J, Hariri R, Wagener MW, Goepfert J, Bond J, Hannigan J, Rogers D, 2014. Evaluation of a new monochloramine generation system for controlling Legionella in building hot water systems. Infect. Control Hosp. Epidemiol 4, 1356–1363. [DOI] [PubMed] [Google Scholar]
- Dupuy M, Mazoua S, Berne F, Bodet C, Garrec N, Herbelin P, Menard-Szczebara F, Oberti S, Rodier MH, Soreau S, Wallet F, Héchard Y, 2011. Efficiency of water disinfectants against Legionella pneumophila and Acanthamoeba. Water Res. 45, 1087–1094. [DOI] [PubMed] [Google Scholar]
- Flannery B, Gelling LB, Vugia DJ, Weintraub JM, Salerno JJ, Conroy MJ, Stevens VA, Rose CE, Moore MR, Fields BS, Besser RE, 2006. Reducing Legionella colonization of water systems with monochloramine. Emerg. Infect. Dis 12, 588–596. [DOI] [PMC free article] [PubMed] [Google Scholar]
- Jacangelo JG, Patania NL, Trussel RR, Haas CN, Gerba C, 2002. Inactivation of Waterborne Emerging Pathogens by Selected Disinfectants. AWWA Research Foundation and AWWA, Denver, Colo.. [Google Scholar]
- Heffelfinger JD, Kool JL, Fridkin S, Fraser VJ, Hageman J, Carpenter J, Whitney CG, 2003. Risk of hospital-acquired Legionnaires’ disease in cities using monochloramine versus other water disinfectants. Infect. Control Hosp. Epidemiol 24 (8), 569–574. [DOI] [PubMed] [Google Scholar]
- Jakubek D, Guillaume C, Binet M, Leblon G, Dubow M, Le Brun M, 2013. Susceptibility of Legionella strains to the chlorinated biocide, monochloramine. Microbes Environ. 28 (3), 336–345. [DOI] [PMC free article] [PubMed] [Google Scholar]
- Kirmeyer GJ, LeChevallier M, Barbeau H,K, Martel, Thompson G, et al. , 2004. Optimizing Chloramine Treatment, 2nd ed. Prepared for the Water Research Foundation, Denver, CO. [Google Scholar]
- Kool JL, Carpenter JC, Fields BS, 1999. Effect of monochloramine disinfection of municipal drinking water on risk of nosocomial Legionnaires’ disease. Lancet 353, 272–277. [DOI] [PubMed] [Google Scholar]
- Kool JL, Carpenter JC, Fields BS, 2000. Monochloramine and Legionnaires’ disease. Am. Water Works Asso 92 (9), 88–96. [Google Scholar]
- Kyritsi MA, Mouchtouri VA, Katsioulis A, Kostara E, Nakoulas V, Hatzinikou M, Hadjichristodoulou C, 2018. Legionella colonization of hotel water systems in touristic places of Greece: association with system characteristics and physicochemical parameters. Int. J. Environ. Res. Public Health 15 (12). [DOI] [PMC free article] [PubMed] [Google Scholar]
- LeChevallier MW, Cawthon CD, Lee RG, 1988a. Factors promoting survival of bacteria in chlorinated water supplies. Appl. Environ. Microbiol 54 (3), 649–654. [DOI] [PMC free article] [PubMed] [Google Scholar]
- LeChevallier MW, Cawthon CD, Lee RG, 1988b. Inactivation of biofilm bacteria. Appl. Environ. Microbiol 54 (10), 2492–2499. [DOI] [PMC free article] [PubMed] [Google Scholar]
- LeChevallier MW, 2019. Occurrence of culturable Legionella pneumophila in drinking water distribution systems. AWWA Water Sci. 1 (3). [Google Scholar]
- Lin YE, Stout JE, Yu VL, 2011. Controlling Legionella in hospital drinking water: an evidence-based review of disinfection methods. Infect. Control Hosp. Epidemiol 32, 166–173. [DOI] [PubMed] [Google Scholar]
- Loret JF, Robert S, Thomas V, Cooper AJ, McCoy WF, Lévi Y, 2005. Comparison of disinfectants for biofilm, protozoa and Legionella control. IWA J. Water Health 3 (4), 423–433. [DOI] [PubMed] [Google Scholar]
- Lu J, Struewing I, Yelton S, Ashbolt N, 2015. Molecular survey of occurrence and quantity of Legionella spp., Mycobacterium spp., Pseudomonas aeruginosa and amoeba hosts in municipal drinking water storage tank sediments. J. Appl. Microbiol 119, 278–288. [DOI] [PubMed] [Google Scholar]
- Mancini B, Scurti M, Dormi A, Grottola A, Zanotti A, Cristino S, 2015. Effect of monochloramine treatment on colonization of a hospital water distribution system by Legionella spp.: a 1 year experience study. Environ. Sci. Technol 49, 4551–4558. [DOI] [PubMed] [Google Scholar]
- Marchesi I, Cencetti S, Marchegiano P, Frezza G, Borella P, Bargellini A, 2012. Control of Legionella contamination in a hospital water distribution system by monochloramine. Am. J. Infect. Control 40, 279–281. [DOI] [PubMed] [Google Scholar]
- Marchesi I, Ferranti G, Bargellini A, Marchegiano P, Predieri G, Stout JE, Borella P, 2013. Monochloramine and chlorine dioxide for controlling Legionella pneumophila contamination: biocide levels and disinfection byproduct formation in hospital water networks. J. Water Health 11, 738–747. [DOI] [PubMed] [Google Scholar]
- Moore MR, Pryor M, Fields B, Lucas C, Phelan M, Besser RE, 2006. Introduction of monochloramine into a municipal water system: impact on colonization of buildings by Legionella spp. Appl. Environ. Microbio 72 (1), 378–383. [DOI] [PMC free article] [PubMed] [Google Scholar]
- Pressman JG, Lee WH, Bishop PL, Wahman DG, 2012. Effect of free ammonia concentration on monochloramine penetration within a nitrifying biofilm and its effect on activity, viability, and recovery. Water Res. 46, 882–894. [DOI] [PubMed] [Google Scholar]
- Pryor M, Springthorpe S, Riffard S, Brooks T,T, Huo, et al. , 2004. Investigation of opportunistic pathogens in municipal drinking water under different supply and treatment regimes. Water Sci. Technol 50 (1), 83–90. [PubMed] [Google Scholar]
- Rakic A, Peric J, Foglar L, 2012. Influence of temperature, chlorine residual and heavy metals on the presence of Legionella pneumophila in hot water distribution systems. Ann. Agric. Environ. Med 19 (3), 431–436. [PubMed] [Google Scholar]
- Revetta RP, Gomez-Alvarez V, Gerke TL, Curioso C, Santo Domingo JW, Ashbolt NJ, 2013. Establishment and early succession of bacterial communities in monochloramine-treated drinking water biofilms. Microbiol. Ecol 86, 404–414. [DOI] [PubMed] [Google Scholar]
- Serrano-Suárez A, Dellundé J, Salvadó H, Cervero-Aragó S, Méndez J, Canals O, Blanco S, Arcas A, Araujo R, 2013. Microbial and physicochemical parameters associated with Legionella contamination in hot water recirculation systems. Environ. Sci. Pollut. Res 20 (8), 5534–5544. [DOI] [PubMed] [Google Scholar]
- Squier C, Yu VL, Stout JE, 2000. Waterborne nosocomial infections. Curr. Infect. Dis. Rep 2, 490–496. [DOI] [PubMed] [Google Scholar]
- Stout JE, Muder RR, Mietzner S, et al. , 2007. Role of environmental surveillance in determining the risk of hospital-acquired legionellosis: a national surveillance study with clinical correlations. Infect. Control Hosp. Epidemiol 28 (7), 818–824. [DOI] [PubMed] [Google Scholar]
- Thomson R, Carter R, Gilpin C, Coulter C, Hargreaves M, 2008. Comparison of methods for processing drinking water samples for the isolation of Mycobacterium avium and Mycobacterium intracellulare. Appl. Environ. Microbiol 74, 3094–3098. [DOI] [PMC free article] [PubMed] [Google Scholar]
- Triantafyllidou S, Lytle D, Muhlen C, 2016. Copper-Silver Ionization at a US Hospital: interaction of treated drinking water with plumbing materials, aesthetics and other considerations. Water Res. 02, 1–10. [DOI] [PMC free article] [PubMed] [Google Scholar]
- Türetgen I, 2004. Comparison of the efficacy of free residual chlorine and monochloramine against biofilms in model and full-scale cooling towers. Biofouling 20 (2), 81–85. [DOI] [PubMed] [Google Scholar]
- USEPA, 1989. National primary drinking water regulations; surface water treatment rule. Federal Register, 40 CFR 141.70-141.75. USEPA. 54 FR 27527. [PubMed] [Google Scholar]
- USEPA, 1991a. Drinking water regulations; maximum contaminant level goals and national primary drinking water regulations for lead and copper. Federal Register, 40 CRF Parts 141 and 142. USEPA; 56, 32112. [Google Scholar]
- USEPA, 1991b. Maximum contaminant level goals and national primary drinking water regulations for lead and copper. Federal Register, 40 CFR Part 141, Subpart I. 56:26460. [Google Scholar]
- USEPA, 1991c. Final Regulatory Impact Analysis Of National Primary Drinking Water Regulations For Lead And Copper (1991.W.91.E.A). EPA, Washington. [Google Scholar]
- USEPA, 1991d. National primary drinking water regulations: final rule. Federal Register, 40 CFR Parts 141, 142, and 143. USEPA; 56 (20) 3526–3507. [Google Scholar]
- USEPA, 2016. Technologies for Legionella control in premise plumbing systems: scientific literature review. Office of Water (4607 M) EPA 810-R-16-001. Accessed at https://www.epa.gov/ground-water-and-drinking-water/technologies-legionella-control-premise-plumbing-systems. [Google Scholar]
- Veterans Health Administration (VHA), 2008. VHA Directive 2008-010: prevention of Legionella disease. Department of Veterans Affairs, Washington, DC. [Google Scholar]
- Wang H, Masters S, Hong Y, Stallings J, Falkinham JO III, Edwards MA, Pruden A, 2012. Effect of disinfectant, water age, and pipe material on occurrence and persistence of Legionella, mycobacteria, Pseudomonas, aeruginosa, and two amoebas. Environ. Sci. Technol 46, 11566–11574. [DOI] [PubMed] [Google Scholar]
- Weintraub JM, Flannery B, Vugia DJ, Gelling LB, Salerno JJ, Stevens VA, Rose CE, Besser RE, Fields BS, Moore MR, Conroy MJ, 2008. Legionella reduction after conversion to monochloramine for residual disinfection. Am. Water Works Assoc 100 (4), 129–139. [Google Scholar]
- White C, Lytle D, Jingrang Lu, 2016. Reducing Legionella in hospital hot water systems using monochloramine. 13th Annual USEPA Drinking Water Workshop. Cincinnati, OH, August 23-25. [Google Scholar]
- White GC, 1999. Handbook of Chlorination and Alternative Disinfectants, 4th ed. John Wiley & Sons, Inc., New York, NY. [Google Scholar]
Associated Data
This section collects any data citations, data availability statements, or supplementary materials included in this article.