

Abstract
Innate lymphoid cells (ILCs), comprising ILC1, 2, and 3 subpopulations, play unique roles in maintaining microbiome homeostasis, mucosal tissue integrity, and control of inflammation. So far, their characterization is dominantly based on tissue‐resident ILCs, whereas little information is available on circulating ILCs, in particular in newborns. In order to get a deeper understanding of neonatal innate immunity, we analyzed the transcriptomes and effector functions of cord blood (CB) ILCs. By RNAseq analysis, all ILC subsets could be clearly distinguished from each other. CB‐derived ILCs were generally closer related to neonatal T than natural killer (NK) cells and several factors shared by all three ILC subsets such as CD28, CCR4, and SLAMF1 are commonly expressed by T cells but lacking in NK cells. Notably, CB ILCs exhibited a unique signature of DNA binding inhibitor (ID) transcription factors (TF) with high ID3 and low ID2 expression distinct from PB‐ or tonsil‐derived ILCs. In vitro stimulation of sorted CB ILCs revealed distinct differences to tissue‐resident ILCs in that ILC1‐like and ILC3‐like cells were nonresponsive to specific cytokine stimulation, indicating functional immaturity. However, CB ILC3‐like cells expressed toll‐like receptors TLR1 and TLR2 and upon stimulation with the TLR2:1 ligand Pam3CSK4, responded with significantly increased proliferation and cytokine secretion. Together, our data provide novel insights into neonatal ILC biology with a unique TF signature of CB ILCs possibly indicating a common developmental pathway and furthermore a role of CB ILC3‐like cells in innate host defense.
Keywords: ID3, ILCs, TLR2:1, transcriptome, umbilical cord blood
This study presents a first thorough transcriptomic analysis of neonatal innate lymphoid cells (ILCs). We identified novel ILC subtype‐specific genes and found an unusual expression pattern of the inhibitor of DNA binding (ID) factors 2 and 3 common to all cord blood (CB) ILC subsets. Finally, we could demonstrate that CB ILC3‐like cells are activated by the TLR2:1 ligand Pam3CSK4.

Significance statement.
Innate lymphoid cells (ILCs) are a recently defined class of lymphocytes that is intimately involved in immune homeostasis and mucosal immunity. Knowledge on phenotypes and function mainly stems from murine tissue‐resident ILCs, whereas similar data are scarce for circulating ILCs. ILCs in cord blood (CB) are characterized by giving the unique opportunity to scrutinize innate lymphocyte phenotypes, transcriptomes, and functions in the newborn infant. CB‐derived ILCs exhibited a unique transcriptomic identity including an unusual signature of the master transcriptional regulator family inhibitor of DNA binding (ID) in comparison to circulating ILCs in adults and also in tissue‐resident ILCs leading to an improved understanding of neonatal innate immunity.
1. INTRODUCTION
Innate lymphoid cells (ILCs) play unique roles within mucosal barrier functions, microbiome homeostasis, and control of inflammation. Originally, the diverse ILC subsets were classified into three groups: group 1 ILCs comprising ILC1 and natural killer (NK) cells, group 2 harboring ILC2, and group 3 comprising ILC3 and lymphoid tissue inducer cells (LTis). 1 However, recently NK cells and LTi cells were assigned into independent groups leading to a total of five distinct ILC groups. 2 The current definition, which is based on differential expression of transcription factors (TFs) and effector functions is based on tissue‐derived ILCs. However, despite their phenotypic resemblance with their tissue‐resident counterparts, circulating ILCs do not seem to fit into this scheme and were recently shown to partly constitute precursors rather than mature ILC effector cells. In this regard, peripheral blood (PB) CD117+/ILC3‐like cells were shown to lack ILC3 effector functions including IL‐22 production but they had the potential to differentiate into all three ILC subsets and NK cells. 3 Along the same lines, we have recently demonstrated that circulating ILC1‐like cells derived from umbilical cord blood (CB) or PB lacked typical ILC1 effector functions such as IFNγ production but could be efficiently differentiated into functionally mature cytotoxic NK cells. 4 Hence, except ILC2, circulating ILCs possess ILC precursor (ILCp) and NK progenitor (NKPs) characteristics, respectively.
Although some studies focusing on human circulating ILCs from healthy donors as well as different pathological disorders are available, 5 , 6 , 7 , 8 little is known about the phenotype and function of circulating neonatal ILCs till date. In general, CB contains significantly higher ILC frequencies compared to pediatric or adult PB, 9 which enables to consistently isolate and characterize all three ILC subsets within a given CB. 7 , 9 , 10 , 11 The development and homeostasis of ILC, referred to as ILCpoiesis, seems to be subject to highly dynamic changes around the time of birth: ILC1‐like cells rapidly decreased with increasing gestational age and remain at comparable levels throughout lifetime. In contrast, from neonatal to adult and elderly adult blood, frequencies of ILC2 and ILC3‐like cells significantly decline. 4 , 9 These data suggest that circulating ILCs are transiently found in the circulation and based on differential expression of chemokine receptors rapidly migrate to the respective tissues to contribute to local ILCpoiesis ensuring location‐specific innate immune defense. This idea is supported by murine studies suggesting a vital role of neonatal ILC due to interaction with the environment and other immune cells. 12 , 13
To deepen our understanding of neonatal ILC function and to define the transcriptomes of all three CB ILC subsets, we performed in‐depth bulk RNA sequencing (RNAseq) analysis. In the present study, we have used our recently developed staining protocol for the identification of all CB ILCs and NK cells 10 to enable comparison of the transcriptomes of CB ILCs, CB‐derived NK and T cells, PB ILCs, and tonsillar ILC3s. Our data describe a unique transcriptional and functional identity of CB ILCs with shared genes indicating a common developing pathway and suggest a novel role of CB ILC3‐like cells in host defense pre‐birth.
2. MATERIALS AND METHODS
2.1. Human samples and ethics statement
Umbilical CB used within this study was collected from the José Carreras Stem Cell Bank at the Institut für Transplantationsdiagnostik und Zelltherapeutika (ITZ). The tonsils were kindly provided by the ENT clinic of the UKD. The study protocol was accepted by the institutional review board at the University of Düsseldorf (study numbers 2019‐383 and 4723 for the use of CB and tonsils, respectively) and is in accordance to the Declaration of Helsinki. CB samples and tonsils were processed directly.
2.2. Isolation of MNCs from CB and buffy coats
From each blood sample, aliquots were taken for the assessment of whole blood cell count (Cell Dyn 3500R, Abbott Laboratories, North Chicago, Illinois). CBs were diluted 1:1 with sterile 1× PBS (Gibco by Life Technologies, Carlsbad, California) and MNCs were isolated by density gradient centrifugation (Biocoll, 1.077 g/cm3, Biochrom Merck Millipore, Billerica, Massachusetts). Cells were resuspended in 5 mL of ice‐cold ammonium chloride solution (pH = 7.4, University Clinic Düsseldorf, Germany) for 5 minutes at room temperature (RT) to lyse residual erythrocytes and washed three times afterward. MNCs were counted and cryopreserved or directly used for further analyses. Single cell suspension from tonsils was done as previously described. 14
2.3. Flow cytometry analyses
Cells were extracellularly stained with the following fluorescein isothiocyanate (FITC) conjugated antibodies in the lineage panel, as previously described 10 : anti‐CD3 (UCHT1), anti‐CD1a (HI149), anti‐CD14 (HCD14), anti‐CD19 (HIB19) anti‐TCRαβ (IP26), anti‐TCRγδ (B1), anti‐CD123 (6H6), anti‐CD303/BDCA‐2 (201A), anti‐FcεR1a (AER‐37[CRA‐1]), anti‐CD235α (HI264), anti‐CD66b (G10F5), anti‐CD34 (581), and anti‐CD20 (2H7) all from BioLegend (San Diego, California). The following antibodies were further used within this study: anti‐CD94‐PE/Cy7 or ‐APC (DX22); anti‐CD56‐APC/Cy7 or BV650 (HCD56); anti‐CD117‐PE or BV421 (104D2); anti‐CRTH2‐PE/Dazzle 594 or APC/Cy7, (BM16); anti‐CCR4‐APC (L291H4); anti‐CD69‐PE/Dazzle 594 (FN60), anti‐NKp44‐APC (P44‐8), anti‐NKp46‐BV510 (9E2), anti‐CCR6‐PE (G034E3), anti‐CD25‐PE/Cy7 (BC96) all from BioLegend, anti‐CD127‐PE/Cy5 (R34.34), anti‐CD45RA‐APC (2H4), and anti‐CD28‐PE (28.2) from Beckman Coulter (Brea, California). Anti‐IL1R1‐PE (FAB269P) was purchased from R&D (Minneapolis, Minnesota). Intranuclear staining of anti‐Tbet‐BV605 (4B10) and anti‐GATA‐3‐BV421 (16E10A23) both BioLegend, anti‐Eomes‐PE‐eFluor610 (WD1928, Invitrogen, Carlsbad, California), anti‐RORC‐PE (clone: AFKJS‐9, eBioscience, Waltham, Massachusetts) was performed with the FoxP3 staining kit (Thermo Fischer Scientific, Waltham, Massachusetts) and corresponding protocol. All flow cytometric analyses were performed on a Cytoflex (Beckman Coulter) with previously described settings. 10 Analyses were performed with Kaluza software 2.1 (Beckman Coulter) or FlowJo (BD, Becton, Dickinson & Company, Franklin Lakes, New Jersey).
2.4. Cell sorting
Monocytes, T‐ and B‐cells, were depleted from CB MNCs with anti‐FITC beads (Miltenyi Biotec, Cat. No. 130‐048‐701, Bergisch Gladbach, Germany) following staining with FITC‐coupled mAbs anti‐CD3 (UCHT1), CD14 (HCD14), CD19 (HCD19), and CD66b (G10F5, all from BioLegend) according to manufacturer's instruction. In brief, for 1 × 10⁷ cells 5 μL antibody of each type was used. After 20 minutes incubation, the cells were washed with staining buffer (1× PBS [Gibco by life technologies] with 0.5% w/v BSA and 2 mM EDTA [both Roth, Karlsruhe, Germany]) and centrifuged for 10 minutes at 380g at 4°C. This step was repeated twice. Subsequently, 20 μL anti‐FITC beads (note: due to high number of FITC‐labeled cells this represents twice the recommend volume) and 80 μL staining buffer were used for 1 × 10⁷ cells. The labeled cells were run through three LD separation columns per sample (Miltenyi Biotec) and the LD columns were washed twice with staining buffer. The cells within the flow through were counted, if the cell count was <30 × 106 cells, the cells were stained, if the cell count was >30 × 106 cells, the cell suspension was run through another LD column. The cells were then further stained with additional lineage antibodies and ILC‐specific antibodies (see flow cytometry analyses). After additional washing steps, the cells were sorted (see Figure 1A for gating strategy). Cell sorting was performed on a MoFlo XDP (Beckman Coulter).
FIGURE 1.
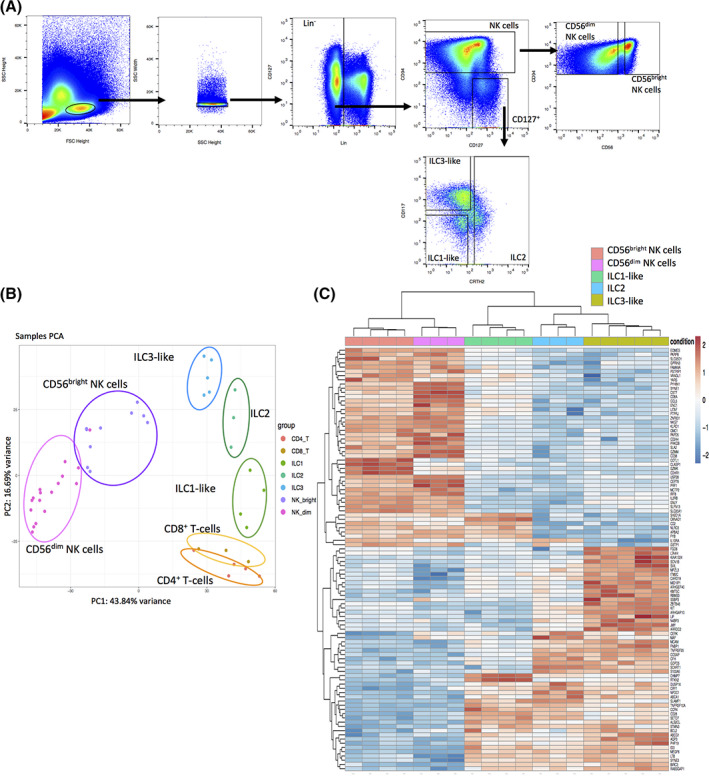
Unique transcriptional identity of cord blood (CB) innate lymphoid cells (ILCs) compared to T cells, natural killer (NK) cells, and tissue ILCs. A, Exemplary gating strategy for ILC sorting. B, CB mononuclear cells were enriched prior to sorting via FITC‐labeled antibodies (anti‐CD3/CD14/CD19/CD66b) and sorted for CB ILC1‐like cells (lin−CD94−CD127+CD117−CRTH2−, n = 4), ILC2 (lin−CD94−CD127+CD117−/+CRTH2+, n = 3), ILC3‐like cells (lin−CD94−CD127+CD117+CRTH2−, n = 5), as well as CB‐ and peripheral blood (PB)‐derived CD56bright NK cells (lin−CD94+CD56bright, n = 9), CD56dim NK cells (lin−CD94+CD56dim, n = 17), CD8+ T cells (CD3+CD8+, n = 3), and CD4+ T cells (CD3+CD4+, n = 5). RNA sequencing was done on the Illumina platform. A two‐dimensional principle component analyses (PCA) was performed based on the top 2000 differential expressed genes of CB ILC1‐like, ILC2, ILC3‐like as well as CB and PB CD56bright NK cells, CD56dim NK cells, CD8+ and CD4+ T cells. C, Heatmap showing the top 100 differentially expressed genes between ILC3‐like and CD56bright NK cells including ILC2, ILC1‐like, and CD56dim NK cells. Data represent at least three donors from three different experiments. Lineage (Lin) cocktail contains antibodies against CD3, CD14, CD19, CD66b, CD123, FcɛR1a, TCRα𝛽, TCRγδ, CD1a, CD235a, CD20, BDCA2, and CD34
2.5. Functional analyses of CB ILCs
Sorted cells were stimulated with human (h) IL‐12 (5 ng/mL) and hIL‐18 (50 ng/mL) for ILC1‐like cells and NK cells, IL‐33 (50 ng/mL) and IL‐2(10 U/mL) for ILC2, 15 and IL1𝛽 (10 ng/mL) and IL‐23 (10 ng/mL) for ILC3‐like cells. 16 For analysis of LIF production, CB ILC3‐like cells were stimulated with IL1𝛽 (50 ng/mL), IL‐23 (50 ng/mL), and IL‐2 (1000 U). 17 For cytokine production analyses, supernatant was taken at day 1 and 5 and the LEGENDplex Human Th Panel and the LEGENDplex Human Hematopoietic Stem Cell Panel from LEGENDplex (Cat: 740722 & 740611, BioLegend) was used and experiments done according to manufactured instructions.
2.6. RNA sequencing and data analysis
Flow cytometrically sorted cells were stored in TRIzol Reagent (Invitrogen) for extraction of total RNA. Reverse transcription and library production were carried out with an Illumina Truseq RNA preparation kit as described in the company's protocol. Sequencing of the libraries was performed with an Illumina HiSeq4000 (single‐read 1 × 50 bp). Sequence reads were mapped to the human genome (hg38) with STAR (version STAR_2.5Oa) and read counts of gene transcripts were determined using gtf file Homo_sapiens.GRCH38.84.gtf and featureCount (v1.5.0‐p1). Analysis of differential gene transcription and normalization of read counts and principle component analyses (PCA) were performed with R package DESeq2 (v.1.22.2). 18 Four‐way plots and MA plots were generated with R package vidger (v.1.2.1). 19 Venn Diagrams were created using the R package “VennDiagramm” 20 with a cutoff of P‐adjust <.001 and a log2 fold change of >2. Top 100 (ILCs) and top 200 (CD56bright NK cells) differentially upregulated genes were analyzed using g:Profiler (https://biit.cs.ut.ee/gprofiler/gost) for enriched GO biological processes with only annotated genes, a g:SCS threshold, a P‐value of <.05, and numeric IDs treated as “Ilumina_humanwg_6_V1.” Pathway analyses as well as read counts of TF and cytokines were analyzed using the R package ggplot2. 21 For comparison, we downloaded the bulk sorted PB ILC data from Li et al 22 and normalized the data with our data via the R package DESeq2 (v.1.22.2). 18
2.7. Gene expression analyses
Flow cytometrically sorted cells were stored in TRIzol Reagent (Invitrogen) for extraction of total RNA. All centrifugation steps were done using 12.200g at 4°C. In brief, RNA extraction was done by a 5 minutes incubation at RT followed by addition of chloroform 1/5 of the TRIzol volume. After resuspension and centrifugation for 15 minutes, the aqueous phase was taken. Isopropanol (Roth) was added to the aqueous phase, resuspended, and left overnight at −20°C. On the next day, the tubes were centrifuged for 30 minutes, the supernatant removed, the pellet washed with 80% ethanol, and centrifuged for 10 minutes. The last two steps were repeated twice. After careful drying, the pellet was resuspended in 10 μL of RNase free water (Qiagen, Venlo, the Netherlands). The whole RNA was reverse transcribed into cDNA by adding 9 μL RNA, 2 μL Oligo(dt) 15, 2 μL random primer (both from Promega, Fitchburg, WI, 500 μg/mL), and 4 μL RNase free water. This was left for 5 minutes at 70°C and put directly on ice afterwards. Then, a second master mix containing 5× MMLV RT buffer, MMLV reverse transcriptase, RNAsin (all from Promega, Fitchburg, Wisconsin), and dNTPs (10 nmol/μL, Peqlab) was added and the reverse transcription reaction was run for 100 minutes at 42°C and 15 minutes at 72°C. Gene expression analyses was done using Taqman Universal Master Mix II (with UNG, Applied Biosystems, Waltham, Massachusetts), Taqman probes for GAPDH (Hs02786624_g1), ID3 (Hs00171409‐m1), and ID2 (Hs04187239‐m1) were purchased from Thermo Fischer Scientific. The StepOne (Applied Biosystems) thermocycler was used with the following cycle conditions: 2 minutes 50°C, 10 minutes 95°C, then 40 cycles with 15 seconds 95°C and 1 minute 60°C. Data were analyzed by taking the ∆CT values for each sample for ID2 and ID3 against the house keeping gene GAPDH, then calculating the ∆∆CT of ID3 minus ID2 with subsequent fold change calculation by raising the ∆∆CT by 2̂‐(∆∆CT).
2.8. Statistical analyses
All tests were either performed with a parametric or a nonparametric assumption (depending on normal distribution) and a 0.05 significance level. All analyses were done using the GraphPad Prism 8.0.0 (GraphPad Software, San Diego, California, www.graphpad.com).
3. RESULTS
3.1. CB ILC subsets have unique transcriptome signatures more similar to CB T cells than CB NK cells
In order to obtain transcriptomic signatures of human neonatal ILCs, we sorted CB ILCs with a lineage cocktail specifically adapted for CB to accommodate the increased presence of early myeloid and lymphoid progenitors as previously described 10 and defined the subsets as following: ILC1‐like (lin−CD94−CD127+CD117−CRTH2−), ILC2 (lin−CD94−CD127+CD117−/+CRTH2+), and ILC3‐like (lin−CD94−CD127+CD117+CRTH2−) (Figure 1A). We further sorted CB‐derived and PB‐derived CD56dim NK cells (lin−CD94+CD56dim), and CD56bright NK cells (lin−CD94+CD56bright) as well as CD8+ (CD3+CD8+) and CD4+ (CD3+CD4+) T cells. After sorting, the cells were subjected to RNA isolation and in‐depth bulk sequencing on the Illumina platform.
In order to establish the relationship between the individual cell populations, we performed a PCA based on the top 2000 most differentially expressed genes of ILC1‐like, ILC2, ILC3‐like, CD56bright NK cells, CD56dim NK cells, CD4+ T cells, and CD8+ T cells. We observed a clear separation of all three CB ILC subsets from each other and from CD56dim and CD56bright NK cells as well as from CD4+ and CD8+ T cells. Within the first principle component (PC) making up 43.8% of variance, ILCs and T cells clustered together and away from NK cells. Within the second PC making up 16.7% variance, ILCs and T cells could be further differentiated from each other. Considering both components together, CB ILCs were surprisingly similar to T cells with ILC1‐like cells having the closest relationship to T cells, ILC3‐like cells exhibiting some similarity to CD56bright NK cells, and ILC2 showing closest relation to the other two ILC groups (Figure 1B).
In order to further explore the differential expression patterns between ILC and NK cells, we performed a heatmap comparing the top 100 most differentially expressed genes between the more closely related ILC3‐like and CD56bright NK cells and included ILC1‐like cells, ILC2, and CD56dim NK cells in the analysis. The heatmap shows 47 upregulated genes in CD56bright NK cells compared to 53 upregulated genes within ILC3‐like cells. Overall, we observed a clear separation between both NK cell subsets and all three ILC subsets with a unique set of 23 genes preferentially expressed by all three ILC subsets compared to NK cells. The three ILC subsets were further divided into one branch containing ILC1‐like cells against a second branch containing ILC2 and ILC3‐like cells (Figure 1C). ILC1‐like cells did not share exclusive genes with either ILC2 or ILC3‐like cells, but had seven genes in common with NK cells including SH2D1A, a cytoplasmic adapter regulating receptors of the signaling lymphocytic activation molecule (SLAM) family, which are preferentially expressed in T and NK cell (Figure 1C). As expected, CD56dim NK cells shared most of the upregulated genes with CD56bright NK cells except for few genes including the gene GZMK, encoding granzyme K, which is an established marker for CD56bright NK cells and is downregulated in CD56dim NK cells. 23
3.2. Transcriptional differences between neonatal ILCs and NK cells
In order to deepen our understanding of the underlying transcriptional differences between CB ILC and NK cells, we generated a Venn Diagram with the 50 most differentially expressed genes between ILC1‐like, ILC2‐ or ILC3‐like cells compared to CD56bright NK cells with a P‐adjust cutoff at <.001 and a log2 fold change >2. We observed nine shared genes expressed by all three CB ILC subsets but not CD56bright NK cells: the coactivation molecule CD28, SLAMF1, encoding the signaling lymphocyte activation molecule 1 (SLAMF1/CD150), SETD7, encoding the histone‐ lysine N‐methyltransferase SETD7, TNFRSF10A, encoding the tumor necrosis factor receptor superfamily member 10A, CHMP7, encoding the ESCRT‐III‐like protein CHMP7, the chemokine receptor CCR4, the nucleotide exchange factor ALS2CL, MEGF6, encoding the multiple epidermal growth factor‐like domains protein 6, and the TF ID3 (Figure 2A). Furthermore, each ILC subtype showed unique upregulated genes within distinct pathways (Figure 2A; Supplementary Figure 1). To verify whether these differences in RNA transcription also result in differential protein expression, we analyzed the surface expression of CD28 and CCR4 by flow cytometry. We observed significantly higher CD28 expression on all three ILC subsets compared to CD56bright NK cells (ILC1‐like cells mean: 75.8% vs CD56bright NK cells mean: 1.1%, ****P‐value <.0001, ILC2 mean: 54.9% vs CD56bright NK cells mean: 1.1%, ****P‐value <.0001, ILC3‐like cells mean: 36.2% vs CD56bright NK cells mean: 1.1%, **P‐value = .003). Similarly, we observed CCR4 expression in all three ILC subsets but not NK cells with statistically significant differences in CCR4 expression of ILC2‐ and ILC3‐like compared to CD56bright NK cells (ILC2 mean: 35.01% vs CD56bright NK cells mean: 0.25%, *P‐value = .0497, ILC3‐like cells mean: 41.3% vs CD56bright NK cells mean: 0.25%, *P‐value = .0189) (Supplementary Figure 2) indicating a possible shared migratory route of all three neonatal ILC subsets.
FIGURE 2.
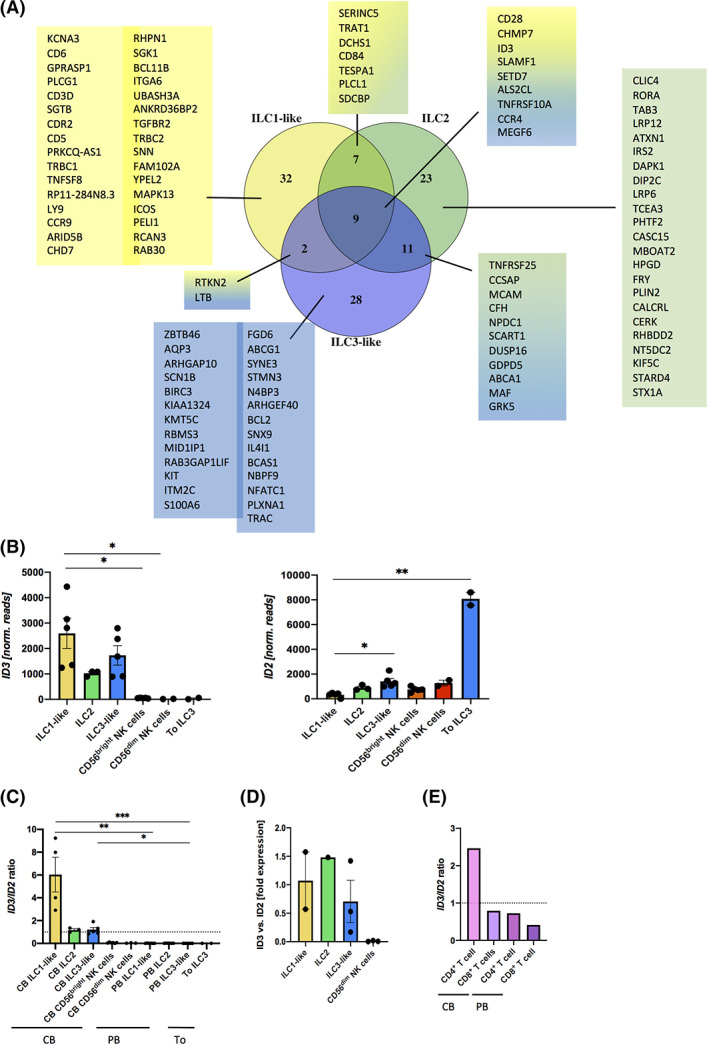
Cord blood (CB) innate lymphoid cell (ILC)‐specific gene expression includes a unique pattern of ID transcription factors. A, Venn Diagram showing the 50 most differentially upregulated genes of ILC1‐like (yellow), ILC2 (green), and ILC3‐like cells (blue) against CD56bright natural killer (NK) cells with an adjusted P‐value cutoff of <.001 and a log2 fold change of >2. B, Normalized read counts of ID3 (left hand side) and ID2 (right hand side) of CB ILC1‐like, ILC2, ILC3‐like cells, CB CD56bright NK cells, CB CD56dim NK cells, and tonsillar ILC3 and C, a ratio between ID3/ID2 from the same populations as in (B) as well as PB ILC1‐like, ILC2, and ILC3‐like cells based on data generated by Li et al. 22 D, Fold gene expression of ID3 to ID2 of freshly sorted CB ILC1‐like cells, ILC2, ILC3‐like cells and CD56dim NK cells (n = 1‐3). E, Ratio between ID3/ID2 for CB and PB CD4+ and CD8+ T cells (n = 2). The height of the bars represents the mean ± SEM. Levels of significance were calculated with a nonparametric ANOVA (Kruskal‐Wallis test) with a multiple comparison post‐test (Dunn's). Data represent at least three donors from three different experiments (B,C)
Vice versa, we also looked at specific genes expressed in CD56bright NK cells compared to all three ILC subsets. For this, we used the top 200 upregulated genes in CD56bright NK cells against each ILC subset. We observed most upregulated genes when comparing CD56bright NK cells with ILC1‐like cells, which is very interesting given that distinguishing ILC1 and NK cells in the past seemed to be challenging. 2 We found 28 genes, which are uniquely upregulated in CD56bright NK cells against all three ILC populations. Among these genes were known NK cell‐specific genes such as PRF1, encoding Perforin, KLRC1, encoding NKG2A, KLRD1, encoding CD94, GNLY, encoding granulysin, GZMK, encoding Granzyme K, and CD300A (Supplementary Figure 3).
3.3. CB ILC exhibit an unusual ratio of ID3/ ID2 TFs
When looking at TFs that are differentially expressed among CB ILC1‐like, ILC2, ILC3‐like, and NK cells, the expression of ID3 in ILCs caught our attention, as ID3 expression to our knowledge was not reported in human ILCs so far. ID3 expression was previously reported for IL‐10 producing murine regulatory ILCs (ILCregs). 24 Nevertheless, the development of human and murine ILCs as well as NK cells is thought to be dependent on the TF ID2, 7 , 25 and as both TFs are sharing similar recognition sites on target genes, we comparatively analyzed ID2 and ID3 expression patterns in ILCs and NK cells. ID3 expression was restricted to the three CB ILC subsets and not found in CB NK cells or tonsillar ILC3. Vice versa, ID2 transcripts were highest in tonsillar ILC3 but hardly found in CB ILC1‐like cells and moderately in ILC2, ILC3‐like, and NK cells (Figure 2B). Consequently, in ILCs, the ratio of ID3/ID2 was larger than one with the highest ratio in ILC1‐like cells, whereas both NK cell subsets and tonsillar ILC3 showed values close to zero (Figure 2C). In order to find out if ID3 expression is specific for CB ILCs, we compared our data to bulk RNAseq data of PB ILCs previously published by Li et al. 22 Indeed, ID3/ID2 ratios were very low in PB‐derived ILCs reflecting strong ID2 expression and an almost complete lack of ID3 expression in all three PB ILC groups (Figure 2C). These observations were verified by quantitative real‐time PCR, again showing higher ID3/ID2 ratios for all three ILC subsets compared to CD56dim NK cells, which lacked ID3 expression (Figure 2D). Of note, the unusual ID3/ID2 ratio could be similarly found in CB‐derived CD4+ T cells. In contrast, PB CD4+ as well as CB CD8+ and PB CD8+ T cells had low ID3/ID2 ratios (Figure 2E). The data might point to a common role of ID3 in the neonatal development of innate and adaptive helper lymphocytes.
3.4. Transcriptional differences between ILC1‐like, ILC2, and ILC3‐like subsets
In order to determine ILC subtype‐specific genes, we compared the transcriptomes of CB ILC1‐like, ILC2, and ILC3‐like cells (Figure 3; Supplementary Figure 4). Several novel genes showing differential expression in one but not the other ILC subtypes were found. In four‐way PCA analysis, a comparatively high number of genes were shared between CB ILC2 and ILC3‐like cells, which were not or lowly expressed in ILC1‐like cells. Vice versa, ILC1‐like cells had only few differentially expressed genes in common with either ILC2‐ or ILC3‐like subsets suggesting a closer relationship between ILC2‐ and ILC3‐like transcriptomes (Figure 3A) in accordance with unsupervised clustering analysis (Figure 1C).
FIGURE 3.

Gene expression patterns defining the identity of each cord blood (CB) innate lymphoid cell (ILC) subtype. A, A four‐way plot with a log2 fold change cut off at ±1 (dotted lines) and adjusted P‐values of .05 showing differentially expressed genes of CB ILC1‐like (“control”) compared ILC2 (“y”) and ILC3‐like cells (“x”). Blue dots represent genes with an adjusted P‐value <.05 with a fold change >1. Green dots represent genes with an adjusted P‐value <.05 with a fold change between >1 (x‐axis) and <1 (y‐axis). Gray dots represent genes with an adjusted P‐value >.05. Red dots represent genes with an adjusted P‐value <.05 with fold rates <1 (x‐axis) and >1 (y‐axis). Selected genes differentially expressed between ILC1‐like cells, ILC2, and ILC3‐like cells are highlighted. B‐D, MA plots showing all differentially expressed genes and heatmaps showing differential expressed genes between (B) ILC1‐like vs ILC2, (C) ILC3‐like vs ILC1‐like, and (D) ILC3‐like vs ILC2. In the MA plots, dotted lines represent a log2 fold change cut off of 1. Blue dots represent a P‐value <.05 and a log2 fold change of >1. Green dots represent a P‐value of <.05 and a log2 fold change of <1. Gray dots represent a P‐value >.05 and a log2 fold change of <1. Numbers of blue or green genes are indicated next to the MA plot. Selected blue genes are highlighted. E, Violin plots showing normalized read counts for LIF (left hand side) and ZBTB46 (right hand side) for CB ILC1‐like, ILC2, and ILC3‐like cells. Levels of significance were calculated with a nonparametric ANOVA (Kruskal‐Wallis test) with a multiple comparison post‐test (Dunn's), *P‐value <.05, **P‐value <.005. Data represent at least three donors from three different experiments
As previously reported for tissue and/or PB ILC1, we found T cell‐associated genes (CCR9, CCR4, CCR7, CD3D, CD6, CD2, CD5, CD8A, CD4) as well as genes encoding T‐cell receptor (TCR) chains (TRDV1, TRBV5‐1, TRBV23‐1) differentially expressed in ILC1‐like cells. 8 , 22 , 26 Also similar to previous analysis of tissue‐resident ILC, CB ILC2 differentially expressed IL1RL1 (encoding the IL33 receptor), IL13, RORA, PTGDR2 (encoding CRTH2), GATA3, CD84, KLRG1, IL4I1, GATA3‐AS1, KLRB1 (encoding CD161) FCRL3, HPGDS, and IL10RA) 15 , 26 , 27 and CB ILC3‐like cells preferentially expressed RORC, KIT, LIF, IL1R1, IL23R, CCR7, KLRF2, KLRC1, KLRB1, XCL1, XCL2, and TNFSF11 26 (Figure 3; Supplementary Figure 4). Finally, we observed a higher expression of the NK cell‐associated TFs eomesodermin (EOMES) and TBX21 (encoding TBET) as well as the CC‐chemokine ligand 5 (CCL5) in ILC1‐like cells compared to ILC2‐ and ILC3‐like cells, as previously reported in PB ILC1. 22
Besides previously reported genes, we also observed novel differentially expressed genes for each ILC subtype. ILC1‐like cells differentially expressed the gene CR2, encoding complement receptor 2 (CR2) responsible for proliferation and differentiation, 28 CD27, a costimulatory checkpoint molecule expressed on various lymphocyte subsets, 29 DICER1 responsible for miRNA processing, IL24, a member of the IL10 family 30 Figure 3B,C), NLRP6, constituting part of the inflammasome, 31 ZBTB18, a transcriptional repressor previously described to play a role in brain and neural development 32 (Figure 3B), CD200, the ligand for CD200 receptor limiting effector functions of the myeloid lineage, 33 and CD9, a receptor for cell adhesion 34 (Figure 3C). ILC2‐ and ILC3‐like cells on the other hand shared the expression of some genes that are lacking in ILC1‐like cells, such as CD70, the receptor for CD27, 35 CERCAM, a cell adhesion molecule, LARGE1, a glycosyltransferase‐like protein, and the low‐density lipoprotein receptor VLDLR (Figure 3A). Specific for ILC2 cells, we observed differential expression of the gene encoding the IL‐9 receptor (IL9R) (Figure 3D) as well as two novel lipid‐sensing receptors LRP12 and LRP6 (Figure 3B). For ILC3‐like cells, we observed the chemokine receptor CCR8, which was previously reported to be preferentially expressed in the thymus 36 (Figure 3C) as well as molecules associated with response to pathogens (NOD2, TBK1, IRAK3, IFNG) (Figure 3).
Finally, we newly identified ZBTB46, a zinc finger TF that was previously described in dendritic cells and their precursors, 37 , 38 to be highly expressed in ILC3‐like cells (Figure 3E). Notably, ZBTB46 was previously reported to induce LIF expression by directly binding to the LIF promoter, 39 which is compatible with the specific and high LIF expression in ILC3‐like cells (Figure 3E). Of note, LIF expression was also reported in human tonsillar ILC3. 40 Overall, our data demonstrate novel transcriptomic signatures of CB ILCs.
3.5. CB ILC1‐like and ILC3‐like cells are functionally immature, whereas ILC2 are fully functional
Next, we wanted to further define the transcriptional and functional identity of neonatal ILCs by analyzing expression of ILC subset‐specific TFs and responsiveness to cytokines previously described to stimulate the respective ILC subsets: TBET and IFNγ for ILC1, 41 GATA3 and IL‐5/IL‐13 (IL‐4) for ILC2, 15 RORC and IL‐22/IL‐17A for ILC3, 16 , 42 , 43 and EOMES, TBET, and IFNγ for both NK cell subsets. 44 As expected, we observed high expression of the TFs TBX21, encoding TBET, and EOMES in both NK cell subsets and the highest GATA3 expression within CB ILC2 on the transcriptomic and protein level (Figure 4A,B). Although CB ILC2 exhibited a TF signature comparable to tissue‐derived ILCs, this was only partially the case for ILC1‐like and ILC3‐like subsets. We detected moderate transcription of TBX21/TBET and EOMES in ILC1‐like cells and intracellular staining revealed that this was due to small subpopulations of TBET and EOMES‐expressing cells (Figure 4A,B). In case of ILC3‐like cells, RORC transcription was found by RNAseq analysis but this did not translate into detectable protein expression (Figure 4A,B). Possibly, the amount of RORγt was too low to be detected by intranuclear staining.
FIGURE 4.

Cord blood (CB) innate lymphoid cell subpopulation (ILC1)‐ and ILC3‐like cells are functionally immature, whereas CB ILC2 are fully functional. A, Normalized RNA sequencing read counts are displayed as violin plots for the signature transcription factors EOMES, GATA3, RORC, and T‐BET(Tbx21) for the indicated cell types. B, Histograms showing intranuclear staining for the signature TFs T‐bet, Eomes, Gata‐3, and RORC for ILC1‐like (filled yellow), ILC2 (filled green), ILC3‐like (filled blue), CD56bright natural killer (NK) cells (filled red), and CD56dim NK cells (taken as reference unfilled red). C, Normalized read counts of ex vivo sorted CB ILC1‐like, ILC2, ILC3‐like, CD56bright NK cells, and tonsillar ILC3 for IFNγ, IL‐5, IL‐13, IL‐4, IL‐17A, and IL‐22. D, CB ILC1‐like, ILC2, and ILC3‐like cells were sorted and specifically stimulated with IL‐12/IL‐18 (for ILC1‐like and CD56bright NK cells), IL‐2/IL‐33 (for ILC2), and IL1𝛽/IL‐23 ± IL‐2 (for ILC3‐like cells) for 5 days. IFNγ, IL‐4, IL‐5, IL‐13, IL‐22, IL‐17a, IL‐10 and E, LIF secretion was analyzed within the supernatant via multi‐cytokine assay at day 1 and 5 (LegendPlex©), n = 5 (ILC1‐like cells), n = 2 (CD56bright NK cells), n = 4 (ILC2), and n = 3‐7 (ILC3‐like cells). The height of the bars represents the mean ± SEM. Levels of significance were calculated with a nonparametric ANOVA (Kruskal‐Wallis test) with a multiple comparison post‐test (Dunn's), *P‐value <.05. Data represent at least three donors from three different experiments
With regard to cytokine expression, as expected high transcript levels were observed for IFNG in both NK cell subsets and moderate expression was seen in ILC1‐ and ILC3‐like cells. In line with previous studies, transcription of IL13 was highest in ILC2. Hardly any reads were seen for IL17A, IL5, IL4, or IL22 in CB ILCs or NK cells. The absence of IL22 transcripts in CB ILC3‐like cells contrasted with the high read counts within tonsillar ILC3 (Figure 4C), again stressing the marked functional differences between circulating and tissue‐resident ILCs. Next, we restimulated each CB cell population with their respective specific cytokines. We observed specific IFNγ secretion by CD56bright NK cells, but not by any of the ILC subsets, ILC2s specifically produced high amounts of IL‐5 and IL‐13 with moderate amounts of IL‐4, whereas CB ILC3‐like cells produced neither IL‐17A nor IL‐22 (Figure 4D). To determine if our CB ILCs might represent the human counterpart to the recently described IL‐10‐producing ID3+ murine ILCregs, 24 we looked for IL‐10 secretion. It is however unlikely that CB ILCs serve ILCreg function, since they did not produce considerable amounts of IL10 (Figure 4D). As we have seen LIF to be exclusively upregulated within ILC3‐like cells (Figure 3E), we were wondering if LIF might be secreted after IL‐23/IL‐1𝛽 stimulation. Similar to all other cytokines measured, hardly any secretion of LIF was seen in ILC3‐like cells when stimulated with IL‐23 and IL‐1𝛽. However, we observed a significant increase of LIF protein in the supernatant from day 1 to day 5 when adding IL‐2 (LIF mean: 2.89 pg/mL vs 76.80 pg/mL, *P = .0156), consistent with previous observations in tonsillar ILC3 (Figure 4E). 17 Our data suggest that CB NK cells and ILC2 execute the expected cell type‐specific functions, whereas CB ILC1‐ and ILC3‐like cells seem to be unresponsive to most cytokines previously described to stimulate the respective tissue‐resident ILC counterparts with the notable exception of IL‐2‐dependent LIF production by CB ILC3‐like cells. The latter subset is reminiscent of ILC3‐like cells in PB, called precursor ILCs (ILCP) based on their capacity to differentiate into all ILC subtypes. 3 In line with this, IL1R1 was more strongly expressed in CB ILC3‐like cells compared to CB NK cells, whereas CD45RA and CD69 showed similar expression in CB ILC3‐like and NK cells (Supplementary Figure 5A), again reminiscent of previous observations in PB ILC3‐like cells. 3 Moreover, CB as well as PB ILC3‐like cells lack bona fide tissue ILC3 “markers” such as IL23R, NKp44, CD56, AhR, and NKp46 suggesting that circulating ILC3‐like cells are more similar to each other than to tonsillar effector ILC3 (Supplementary Figure 5B,C). In line with this, we observed a clear transcriptomic difference between tonsillar ILC3s and CB ILC3‐like cells, with the latter being more similar to CB CD56bright NK cells (Supplementary Figure 6).
3.6. CB ILC3‐like cells are responsive to the TLR2:1 ligand Pam3CSK4
As outlined above and similar to the observations in PB ILC3‐like cells, no effector functions were observed within CB ILC3‐like cells following stimulation with IL1𝛽 and IL‐23. 3 We were nevertheless wondering if ILC3‐like cells might be responsive to alternative stimuli and went back to the transcriptome data. Two upregulated genes in ILC3‐like cells were NOD2, a intracellular pattern recognition receptor, 45 and TBK1, a molecule downstream of the toll‐like receptor (TLR) signaling cascade. 46 Hence, we looked at TLR chain read counts for all three ILC subtypes. ILC3‐like cells exhibited high expression of TLR1 and TLR2 (Figure 5A). In contrast, ILC1‐like cells expressed TLR1 but not TLR2, and ILC2 moderately expressed TLR2 but not TLR1 (Figure 5A). All other TLRs were hardly expressed in any of the three ILC subsets. Notably, TLR2 and TLR1 chains together form the TLR2:1 receptor representing a heterodimer of two TLR2 and one TLR1 molecules. TLR2:1 is extracellularly expressed on various human immune cells including monocytes, granulocytes, and B cells, 47 but also on endothelial cells. 48 The ligands for TLR2:1 in vivo are among others diacyl‐ and triacylglycerol moieties, which can be found on several bacteria, helminths, fungi, and to some extent viruses. 49 When analyzing expression of downstream molecules of the TLR2:1 pathway, we observed a significant upregulation for 10 (IRAK1, IRAK2, TRAF6, MAP3K7 encoding TAK1, NKFB1, NKFB2, IRF7, TBK1, JUN encoding AP‐1, and TICAM1 encoding TRIF) out of 13 known molecules contributing to this pathway when comparing CB ILC3‐like cells to CB T cells (Supplementary Figure 7).
FIGURE 5.

Cord blood (CB) innate lymphoid cell subpopulation (ILC3)‐like cells are sensing TLR2:1 ligands. A, Normalized read counts of RNAseq data of CB ILC1‐like, ILC2, and ILC3‐like cells for TLR 1‐9. B, Bar graphs showing the frequency of CB ILC3‐like cell survival in medium alone, with Pam3CSK4 alone, with IL‐2 alone, and a combination of IL‐2 and Pam3CSK4. C, Cryopreserved CB samples were stained for ILCs. Representative dot plots and quantification for CD117 and CD25 expression are shown for ILC1‐like cells, ILC2, ILC3‐like cells, CD56bright natural killer (NK) cells, and CD56dim NK cells. D, Normalized read counts for IL12RA encoding CD25 are shown for CB ILC3‐like cells and tonsillar ILC3 (E/F) Fresh CB MNCs were isolated, depleted of CD3, CD14, CD19, and CD66b‐expressing cells and subsequently purified by sorting for ILC3‐like cells (Lin−CD94−CD127+CD117+CRTH2−). ILC3‐like cells were stimulated for 5 days with IL‐2 with or without the TLR2:1 ligand Pam3CSK4. E, Expansion of ILC3‐like cells (n = 7); and F, TNFα, IFNγ, IL‐13, IL‐5, IL‐10, IL‐22, LIF, and GM‐CSF secretion is shown (n = 6). The height of the bars represents the mean ± SEM. Levels of significance were calculated with a nonparametric ANOVA (Kruskall‐Wallis with a Dunn's post‐test) (B,C) and t test (Mann‐Whitney) (E,F), *P‐value <.05, **P‐value <.005
To determine if a functional TLR2:1 receptor is expressed on ILC3‐like cells, we sorted ILC3‐like cells from CB and cultivated them for 5 days in medium alone, with IL‐2 alone, with the TLR2:1 ligand Pam3CSK4 50 alone, or a combination of IL‐2 and Pam3CSK4. We observed increased cell survival with the two conditions containing IL‐2, whereas with medium or Pam3CSK4 alone the cells died (Figure 5B). We therefore stained for surface expression of CD25, constituting the α chain of the high affinity IL‐2 receptor, and observed that 89% of ILC3‐like cells expressed CD25, which was higher than CB ILC1‐like cells, ILC2, CD56bright NK cells, and significantly higher compared to CD56dim NK cells (mean: 88,85% vs 0.71%, *P = .014) (Figure 5C). Moreover, the analysis of RNAseq data suggest that CB ILC3‐like cells also express higher levels of IL2RA than tonsillar ILC3 (Figure 5D). Consequently, we observed a significant higher proliferation rate in ILC3‐like cells treated with IL‐2 and Pam3CSK4 (Wilcoxon matched‐pairs signed rank test, *P‐value = .0117) indicating that ILC3‐like cells are activated upon TLR2:1 ligand exposure (Figure 5E). Since circulating ILC3‐like cells in many aspects functionally diverge from their tissue counterparts, we were wondering if they would be able to secrete other cytokines beyond IL‐22 upon TLR activation. We thus measured various pro‐ and anti‐inflammatory cytokines in the culture supernatant. Indeed, we observed significant higher cytokine secretion in ILC3‐like cells stimulated with IL‐2 and Pam3CSK4 of TNFα (10.3 vs 3.3 pg/mL, *P‐value = .013), IFNγ (283.3 vs 49.5 pg/mL, **P‐value = .0022), IL‐13 (563.3 vs 14.8 pg/mL, **P‐value = .0022), IL‐5 (2188.8 vs 4.2 pg/mL, **P‐value = .0022), IL‐10 (85.6 vs 1.3 pg/mL, **P‐value = 0.0087), IL‐22 (121.4 vs 1.6 pg/mL, **P‐value = .0022), LIF (30.9 vs 10.0 pg/mL, *P‐value = .0127), and GM‐CSF (626.4 vs 209.7 pg/mL, **P‐value = .0093) (Figure 5F). Our data thus suggest that although circulating neonatal ILC3‐like cells are not responding to IL‐1𝛽/IL‐23 alone, they are stimulated in the presence of microbial products in an IL‐2‐dependent way. This alternative mode of action could contribute to protection by ILC3‐like cells from invading pathogens of the fetus during pregnancy and early life.
4. DISCUSSION
Our data show a unique transcriptomic signature of neonatal ILCs not seen within PB or tissue ILC so far and with a clear distinction from CB‐ and PB‐derived T and NK cells. We could identify nine shared genes within all neonatal ILC subtypes upon comparison to CD56bright NK cells including CD28, CCR4, SLAMF1, and the TF ID3. ID factors are helix‐loop‐helix (HLH) proteins that are deeply involved in hematopoietic fate decisions by dominantly inhibiting TFs containing basic HLH motifs, which in turn activate E proteins such as E2A known to regulate lymphocytic differentiation. 51 Expression of ID3 in CB ILCs was unexpected since so far murine and human ILC development was thought to be majorly dependent on ID2 expression rather than ID3 with the exception of ILCregs. 7 , 25 , 52 This novel kind of regulatory ILC was described in mice to highly express ID3 and produce IL‐10 upon stimulation. 24 However, a recent publication questioned the existence of regulatory ILCs and identified murine intestinal ILC2s as producers of IL‐10. 53 The present CB ILCs did not produce IL‐10 and they also did not express high amounts of ID2.
ID3 expression was strong in all CB ILC subsets, but not in CB NK cells or tonsillar ILC3. In contrast to CB ILCs, CB NK cells and especially tonsillar ILC3 exhibited strong expression of ID2. Consequently, an ID3/ID2 ratio >1 was characteristic for neonatal ILCs but not PB ILC. 22 Interestingly, we observed this unique ID3/ID2 ratio >1 also in CB‐derived CD4+ T cells, which might point to a common developmental origin of CB ILCs and CB CD4 T cells, possibly located within the thymus. In case of CB ILC1‐like cells, the phenotypic resemblance to T cells also includes frequent αβ TCR rearrangement, which would support the hypothesis that CB ILC1‐like cells egress from the thymus after failure of productive TCR rearrangements. Of note, all three ILC subtypes have been identified within the human thymus. 7 In favor of a common origin of ILCs and T cells, an overall closer transcriptomic relationship exists between CB ILC and T cells compared to NK cells. Moreover, several genes commonly expressed in all three ILC subsets but not CD56bright NK cells are T cell‐associated factors: SLAMF1, CD28, and the chemokine receptor CCR4. Interestingly, CCR4 expression is essential for intrathymic lymphocyte selection and development. 54 The expression of CCR4 on all CB ILC subsets further contributes to the hypothesis that neonatal circulating ILCs might migrate from the thymus via the circulation into tissues to differentiate into mature ILCs. In general, the above data showing differential expression patterns of ID3/ID2 and other genes between CB and adult PB ILCs suggest that ILCs go through dynamic transcriptional changes affecting ILC‐mediated immunity comparable to previously described changes in other immune compartments such as T and B cells. 55
We have recently performed functional analysis of CB ILC1‐like cells in comparison to CB NK cells 4 and could show that neonatal ILC1‐like cells are unresponsive to specific cytokine stimulation but are able to differentiate into mature NK cells demonstrating their potential as novel NK cell progenitors. Here, by comparison to CB ILC2 and ILC3‐like cells, we could further define several novel receptors and CD molecules specifically expressed by ILC1‐like cells: CR2, CD27, CD200, and CD9. Strikingly, ILC1‐like cells expressed CD27, the ligand for CD70, whereas both ILC2 and ILC3‐like cells expressed CD70 potentially suggest an interaction between the respective ILC subpopulations. Although we could not detect significant functional capacity of ILC1‐like cells after specific interleukin stimulation, we detected high levels of IL24 and NLRP6 in ILC1‐like cells compared to ILC2‐ and ILC3‐like cells. IL‐24 has been described to be important for wound healing but also in the context of pro‐inflammatory autoimmune disorders, 56 whereas NRLP6 assembly is crucially involved in IL‐1𝛽 and IL‐8 secretion, 31 which could implicate an up to now hidden functionality of ILC1‐like cells.
ILC2 have been the focus of attention in recent years, especially in the context of the etiology of allergy and asthma. Here, we show that CB ILC2 are the only neonatal ILC subtype that exerts ILC effector functions comparable to tissue‐resident ILCs including secretion of IL‐13, IL‐5, and to some extent IL‐4. 15 Furthermore, they highly expressed typical genes previously described in tissue ILC2 such as KLRB1, KLRG1, IL1RL1 encoding IL‐33R, and GATA3, 26 suggesting a high resemblance to their PB and tissue counterparts. Nonetheless, we observed several genes unique for CB ILC2 including the receptor for IL‐9 IL9R and two lipid sensing receptors (LRP12 and LRP6). This might be interesting for future studies, as murine 57 and human 58 literature suggested the sensing and uptake of lipids by ILC2 during allergic responses. Given the high resemblance in functionality and gene expression between circulating and tissue‐resident ILC2, consequently these receptors might also be expressed on tissue ILC2s and bear potential therapeutic potential.
Circulating ILC3‐like cells were previously described to contain ILC precursors, as they were able to differentiate into all three ILC subsets as well as NK cells. 3 In line with this study, CB ILC3‐like cells were lacking specific cytokine secretion after stimulation with IL‐1𝛽 and IL‐23. However, CB ILC3‐like cells were sensitive to IL‐2 stimulation and exerted full effector functions following stimulation with the TLR2:1 ligand Pam3CSK4. Of note, stimulation by TLR2:1 was previously reported for human tonsillar CD127+LTi‐like cells representing an early tissue‐resident ILC subset promoting development of lymphoid tissues. 59 However, the observation that CB ILC3 are responsive to TLR2:1 ligands sheds a new light on the role of circulating ILC3‐like cells, previously thought to represent a functionally inert ILC progenitor. This could be of particular interest in pregnancy, as one essential function of CB ILC3‐like cells probably is the protection against pathogens being able to pass the placental barrier. In this regard, infection during pregnancy with Toxoplasma gondii 60 represents a serious threat for mother and baby, in many cases leading to complications including abortion, preterm labor, and neurological defects. 60 As TLR2:1 can recognize glycosylphosphatidylinositol anchors present on T gondii, 49 human CB ILC3‐like cells could be part of the first line of defense to protect the fetus. In line with this, we observed upregulation of genes associated with intracellular responses to pathogens (NOD2, TBK1, IRAK3, IFNG) in ILC3‐like cells compared to ILC2 and/or ILC1‐like cells. Together, CB ILC3‐like cells exhibit limited functional capacity when stimulated with IL‐1𝛽 and IL‐23, but becomes fully functional upon exposure to TLR2:1 ligands in the presence of IL‐2. 3
Of note, in addition to CB‐derived ILCs, various distinct innate lymphocyte subsets were recently defined in the decidua (d) such as dILC3, dLTi, and dILC1, along with various novel NK cell subsets. 61 , 62 , 63 Functionally and phenotypically, dILCs resemble other tissue‐specific ILCs rather than CB‐derived ILCs. dILC3 for example functionally and phenotypically resemble tonsillar ILC3 by secretion of IL‐22 and expression of surface molecules such as CCR6, IL23R, and NKp44, whereas dILC1 resemble intraepithelial ILC3, which express CD103 and share NK cell surface molecules. 61 , 62 , 63 Therefore, despite their anatomical proximity, CB ILCs do not resemble dILCs and have a unique transcriptomic phenotype.
The role of CB ILCs for the formation of a competent postnatal immune system is just beginning to be appreciated. It was previously shown that a lack of colonizing commensal bacteria in postnatal mice leads to a decrease of IL‐22‐producing ILC3 increasing the risk of pneumonia. 12 Furthermore, postnatal lung inflation leads to an increase of IL‐33 production supporting the activation of IL‐13‐producing ILC2, which changes and maintains the phenotype of alveolar macrophages. 13 In the present study, we could show that CB ILC3‐like cells are highly responsive to TLR2:1 ligands and able to secrete LIF suggesting an essential role of CB ILC3‐like cells during active immune responses, in particular in the presence of IL‐2. CB ILCs also seem to play important roles for the so‐called ILCpoiesis. In this regard, it was recently shown that CB‐derived ILC1‐like cells constitute progenitors with a unique potential to generate NK cell populations with complex killer cell Ig‐like receptor repertoires, 4 thereby ensuring broad specificity for missing‐self based detection of aberrant cells. Adding to this, it was recently shown that human circulating innate lymphocytes have a general role in ILCpoiesis, such that human CD117+ cells constitute progenitors of ILC1, ILC2, ILC3, and NK cells. 3 Therefore, human neonatal ILCs might be generally essential for shaping the adult innate lymphocyte system.
5. CONCLUSION
ILCs are a recently defined heterogeneous class of lymphocytes that serve important functions in barrier immunity and early defense against invading pathogens. Here, we took a systems biology approach to analyze the transcriptomic and functional identity of ILC1, ILC2, and ILC3 cells in comparison to NK and T cells from CB. Unexpectedly, all three ILC subsets shared a characteristic pattern of DNA binding inhibitor (ID) TF with CB CD4 T cells but not with NK cells, possibly pointing toward a common thymic origin of all helper lymphocytes. Furthermore, the study substantiates fundamental differences between CB and PB ILCs that could contribute to the well‐described beneficial effects of CB in hematopoietic stem cell transplantation.
CONFLICT OF INTEREST
The authors declared no potential conflicts of interest.
AUTHOR CONTRIBUTIONS
S.B.B.: conception and design, collection/assembly of data, data analysis and interpretation, manuscript writing, revision of the manuscript, final approval of the manuscript; N.S., S.W., A.N.: collection/assembly of data, final approval of the manuscript; A.R.M.: conception and design, final approval of the manuscript; K.R.: provision of infrastructure, final approval of the manuscript; G.K.: provision of study material or patients, final approval of the manuscript; L.W.: collection/assembly of data, data analysis, final approval of the manuscript; M.U.: conception and design, data analysis and interpretation, manuscript writing, revision of the manuscript, final approval of the manuscript.
Supporting information
Supplementary Figure 1 | CB ILCs show unique transcriptional pathways Pathway analyses from the Top 100 up‐regulated genes from ILC1‐like, ILC2, ILC3‐like compared to CD56bright NK cells calculated using gProfiler. The P‐value corresponds inversely to the size of the pathway: the lower the P‐value the bigger the circle for the pathway.
Supplementary Figure 2 | CB ILCs express CD28 and CCR4 on the cell surface. Cryopreserved CB cells were stained for ILCs. Representative dot plots and quantification of CD28 (n = 13, top) and CCR4alt (n = 4, buttom) on CB ILC1‐like, ILC2, ILC3‐like, CD56bright and CD56dim NK cells. The height of the bars represents the mean ± SEM. Levels of significance were calculated with a non‐parametric ANOVA (Kruskal‐Wallis test) with a multiple comparison post‐test (Dunn's), * p value <0.05, ** P‐value <0.005, *** P‐value <0.001. Data represent at least three donors from three different experiments.
Supplementary Figure 3 | CD56 bright NK cells show a unique set of up‐regulated genes compared to ILC subsets. The top 200 up‐regulated genes of CD56bright NK cells against ILC1‐like(yellow), ILC2(green), ILC3‐like (blue) were calculated and displayed in a Venn Diagram for intersecting genes. The 28 shared genes are displayed and were taken for pathway analyses via gProfiler. The P‐value corresponds inversely to the size of the pathway: the lower the P‐value the bigger the circle for the pathway.
Supplementary Figure 4 | Heatmaps contrasting all three ILC subsets against each other. Heatmaps showing the top 100 most differentially expressed genes between ILC1‐like cells and ILC2 (top), ILC1‐like and ILC3‐like cells (middle), and ILC2 and ILC3‐like cells (bottom).
Supplementary Figure 5 | Expression of ILC3‐specific genes in CB ILC3‐like, CB NK, and tonsillar ILC3 cells. Cryopreserved CB cells were stained for ILC markers and representative histograms are shown for ILC3‐like cells (blue) and CD56dim NK cells for (A) IL1R1 (n = 3), CD45RA (n = 3), and CD69 (n = 3) and (B) NKp44 (n = 4), NKp46 (n = 4), CD56 (n = 5), and CCR6 (n = 3). (C) Normalized RNA sequencing read counts are displayed for CB ILC3‐like and tonsillar ILC3 cells as violin plots for IL23R and aryl hydrocarbon receptor (AhR). Levels of significance were calculated using a Mann‐Whitney test (non‐parametric t test).
Supplementary Figure 6 | CB ILC3‐like cells are more similar to CB CD56 bright NK cells than to tonsillar ILC3. Heatmap showing the top 100 most differentially expressed genes between tonsillar ILC3 and CB CD56bright NK cells with further inclusion of CB ILC3‐like cells.
Supplementary Figure 7 | CB ILC3‐like cells show upregulation of multiple genes of the TLR signaling pathway. Normalized read counts of RNAseq data visualized by violin plots for genes typically found within TLR signalling pathways: MYD88, IRAK4, IRAK1, IRAK2, TRAF6, MAP3K7 (TAK1), NFKB1, NFKB2, IRF7, IRF3, TBK1, JUN (AP‐1), and TICAM1 (TRIF) in ILC3‐like cells and T cells (CD4+ and CD8+). Levels of significance were calculated using a Mann‐Whitney test (non‐parametric t test), * P < 0.05, ** P < 0.001.
ACKNOWLEDGMENTS
The authors thank the cord blood (CB) and peripheral blood (PB) donors for providing blood samples, Dr Sonja Schavier (Institute of Medical Microbiology and Hospital Hygiene, Medical Faculty, Heinrich‐Heine University, Düsseldorf, Germany) for provision of the TLR2:1 ligand Pam3CSK4, Dr Hans‐Ingo Trompeter as well as Dr Vera Balz (ITZ, Düsseldorf) for excellent technical support, and Patrick Günther for an excellent introduction of R. This work was supported by funds from the Düsseldorf School of Oncology (funded by the Comprehensive Cancer Center Düsseldorf/Deutsche Krebshilfe and the Medical Faculty HHU Düsseldorf) and the Deutsche Forschungsgemeinschaft (DFG) SPP1937‐UH91/8‐1 (Markus Uhrberg). The authors declared no competing financial interests.
Bennstein SB, Scherenschlich N, Weinhold S, et al. Transcriptional and functional characterization of neonatal circulating Innate Lymphoid Cells. STEM CELLS Transl Med. 2021;10:867–882. 10.1002/sctm.20-0300
Authored by a member of CBA.
Funding information Deutsche Forschungsgemeinschaft (DFG), Grant/Award Number: SPP1937‐UH91/8‐1
DATA AVAILABILITY STATEMENT
RNA sequencing data for CB ILC1‐like cells, CD56bright NK cells and CD56dim NK cells were used in a previous study [4] and are accessible at NCBI Project ID: PRJNA594493 (http://www.ncbi.nlm.nih.gov/bioproject/594493). RNA sequencing data for CB ILC2 and ILC3‐like cells is accessible at NCBI Project ID: PRJNA642003 (https://www.ncbi.nlm.nih.gov/bioproject/?term=PRJNA642003).
REFERENCES
- 1. Spits H, Artis D, Colonna M, et al. Innate lymphoid cells ‐ a proposal for uniform nomenclature. Nat Rev Immunol. 2013;13(2):145‐149. [DOI] [PubMed] [Google Scholar]
- 2. Vivier E, Artis D, Colonna M, et al. Innate lymphoid cells: 10 years on. Cell. 2018;174(5):1054‐1066. [DOI] [PubMed] [Google Scholar]
- 3. Lim AI, Li Y, Lopez‐Lastra S, et al. Systemic human ILC precursors provide a substrate for tissue ILC differentiation. Cell. 2017;168(6):1086‐1100.e1010. [DOI] [PubMed] [Google Scholar]
- 4. Bennstein SB, Weinhold S, Manser AR, et al. Umbilical cord blood‐derived ILC1‐like cells constitute a novel precursor for mature KIR+NKG2A‐ NK cells. Elife. 2020;9:e55232. [DOI] [PMC free article] [PubMed] [Google Scholar]
- 5. Carvelli J, Piperoglou C, Bourenne J, et al. Imbalance of circulating innate lymphoid cell subpopulations in patients with septic shock [Clinical Trial] [in English]. Front Immunol. 2019;10:2179. [DOI] [PMC free article] [PubMed] [Google Scholar]
- 6. Gómez‐Massa E, Talayero P, Utrero‐Rico A, et al. Number and function of circulatory helper innate lymphoid cells are unaffected by immunosuppressive drugs used in solid organ recipients. Transpl Int. 2020;33(4):402‐413. [DOI] [PubMed] [Google Scholar]
- 7. Nagasawa M, Germar K, Blom B, et al. Human CD5+ innate lymphoid cells are functionally immature and their development from CD34+ progenitor cells is regulated by Id2 [in English]. Front Immunol. 2017;8:1047. [DOI] [PMC free article] [PubMed] [Google Scholar]
- 8. Roan F, Stoklasek TA, Whalen E, et al. CD4+ group 1 innate lymphoid cells form a functionally distinct ILC subset that is increased in systemic sclerosis. J Immunol. 2016;196(5):2051‐2062. [DOI] [PMC free article] [PubMed] [Google Scholar]
- 9. Vely F, Barlogis V, Vallentin B, et al. Evidence of innate lymphoid cell redundancy in humans. Nat Immunol. 2016;17(11):1291‐1299. [DOI] [PMC free article] [PubMed] [Google Scholar]
- 10. Bianca Bennstein S, Riccarda Manser A, Weinhold S, et al. OMIP‐055: characterization of human innate lymphoid cells from neonatal and peripheral blood. Cytometry A. 2019;95(4):427‐430. [DOI] [PubMed] [Google Scholar]
- 11. Mehta RS, Shpall EJ, Rezvani K. Cord blood as a source of natural killer cells [in English]. Front Med. 2016;2:93‐93. [DOI] [PMC free article] [PubMed] [Google Scholar]
- 12. Gray J, Oehrle K, Worthen G, et al. Intestinal commensal bacteria mediate lung mucosal immunity and promote resistance of newborn mice to infection. Sci Trans Med. 2017;9(376):eaaf9412. [DOI] [PMC free article] [PubMed] [Google Scholar]
- 13. Saluzzo S, Gorki A‐D, Rana BMJ, et al. First‐breath‐induced type 2 pathways shape the lung immune environment. Cell Rep. 2017;18(8):1893‐1905. [DOI] [PMC free article] [PubMed] [Google Scholar]
- 14. Freud AG, Caligiuri MA. Purification of human NK cell developmental intermediates from lymph nodes and tonsils. In: Campbell KS, ed. Natural Killer Cell Protocols: Cellular and Molecular Methods. Totowa, NJ: Humana Press; 2010:1‐14. [DOI] [PubMed] [Google Scholar]
- 15. Mjösberg JM, Trifari S, Crellin NK, et al. Human IL‐25‐ and IL‐33‐responsive type 2 innate lymphoid cells are defined by expression of CRTH2 and CD161. Nat Immunol. 2011;12:1055‐1062. [DOI] [PubMed] [Google Scholar]
- 16. Ahn Y‐O, Blazar BR, Miller JS, Verneris MR. Lineage relationships of human interleukin‐22–producing CD56+ RORγt+ innate lymphoid cells and conventional natural killer cells. Blood. 2013;121(12):2234‐2243. [DOI] [PMC free article] [PubMed] [Google Scholar]
- 17. Cella M, Otero K, Colonna M. Expansion of human NK‐22 cells with IL‐7, IL‐2, and IL‐1β reveals intrinsic functional plasticity. Proc Natl Acad Sci USA. 2010;107(24):10961‐10966. [DOI] [PMC free article] [PubMed] [Google Scholar]
- 18. Love MI, Huber W, Anders S. Moderated estimation of fold change and dispersion for RNA‐seq data with DESeq2. Genome Biol. 2014;15(12):550. [DOI] [PMC free article] [PubMed] [Google Scholar]
- 19. Monier B, McDermaid A, Zhao J, et al. vidger: create rapid visualizations of RNAseq data in R; 2020.
- 20. Chen H. VennDiagramm: generate high‐resolution venn and euler plots. R package Version 1.6.20; 2018. https://CRANR-projectorg/package=VennDiagram
- 21. Wickham H. ggplot2: Elegant Graphics for Data Analysis. In: Springer‐Verlag; New York, NY, 2016: https://ggplot2.tidyverse.org [Google Scholar]
- 22. Li S, Morita H, Sokolowska M, et al. Gene expression signatures of circulating human type 1, 2 and 3 innate lymphoid cells. J Allergy Clin Immunol. 2019;143:2321‐2325. [DOI] [PubMed] [Google Scholar]
- 23. Bratke K, Kuepper M, Bade B, Virchow J C, Luttmann W. Differential expression of human granzymes A, B, and K in natural killer cells and during CD8+ T cell differentiation in peripheral blood [in English]. Eur J Immunol. 2005;35(9):2608‐2616. [DOI] [PubMed] [Google Scholar]
- 24. Wang S, Xia P, Chen Y, et al. Regulatory innate lymphoid cells control innate intestinal inflammation. Cell. 2017;171(1):201‐216.e218. [DOI] [PubMed] [Google Scholar]
- 25. Yokota Y, Mansouri A, Mori S, et al. Development of peripheral lymphoid organs and natural killer cells depends on the helix‐loop‐helix inhibitor Id2. Nature. 1999;397(6721):702‐706. [DOI] [PubMed] [Google Scholar]
- 26. Bjorklund AK, Forkel M, Picelli S, et al. The heterogeneity of human CD127+ innate lymphoid cells revealed by single‐cell RNA sequencing [Resource]. Nat Immunol. 2016;17(4):451‐460. [DOI] [PubMed] [Google Scholar]
- 27. Nagasawa M, Heesters BA, Kradolfer CMA, et al. KLRG1 and NKp46 discriminate subpopulations of human CD117+CRTH2‐ ILCs biased toward ILC2 or ILC3. J Exp Med. 2019;216(8):1762‐1776. [DOI] [PMC free article] [PubMed] [Google Scholar]
- 28. Tolnay M, Tsokos GC. Complement receptor 2 in the regulation of the immune response. Clin Immunol Immunopathol. 1998;88(2):123‐132. [DOI] [PubMed] [Google Scholar]
- 29. Lens SM, Tesselaar K, van Oers MH, et al. Control of lymphocyte function through CD27‐CD70 interactions [in English]. Semin Immunol. 1998;10(6):491‐499. [DOI] [PubMed] [Google Scholar]
- 30. Wang M, Liang P. Interleukin‐24 and its receptors [in English]. Immunology. 2005;114(2):166‐170. [DOI] [PMC free article] [PubMed] [Google Scholar]
- 31. Ghimire L, Paudel S, Jin L, Jeyaseelan S. The NLRP6 inflammasome in health and disease. Mucosal Immunol. 2020;13(3):388‐398. [DOI] [PMC free article] [PubMed] [Google Scholar]
- 32. Okado H, Ohtaka‐Maruyama C, Sugitani Y, et al. The transcriptional repressor RP58 is crucial for cell‐division patterning and neuronal survival in the developing cortex. Dev Biol. 2009;331(2):140‐151. [DOI] [PubMed] [Google Scholar]
- 33. Vaine CA, Soberman RJ. The CD200‐CD200R1 inhibitory signaling pathway: immune regulation and host‐pathogen interactions [in English]. Adv Immunol. 2014;121:191‐211. [DOI] [PMC free article] [PubMed] [Google Scholar]
- 34. Reyes R, Cardeñes B, Machado‐Pineda Y, et al. Tetraspanin CD9: a key regulator of cell adhesion in the immune system [in English]. Front Immunol. 2018;9:863. [DOI] [PMC free article] [PubMed] [Google Scholar]
- 35. Hendriks J, Gravestein LA, Tesselaar K, van Lier RAW, Schumacher TNM, Borst J. CD27 is required for generation and long‐term maintenance of T cell immunity. Nat Immunol. 2000;1(5):433‐440. [DOI] [PubMed] [Google Scholar]
- 36. Kremer L, Carramolino L, Goya I, et al. The transient expression of C‐C chemokine receptor 8 in thymus identifies a thymocyte subset committed to become CD4+ single‐positive T cells [in English]. J Immunol. 2001;166(1):218‐225. [DOI] [PubMed] [Google Scholar]
- 37. Satpathy AT, KC W , Albring JC, et al. Zbtb46 expression distinguishes classical dendritic cells and their committed progenitors from other immune lineages. J Exp Med. 2012;209(6):1135‐1152. [DOI] [PMC free article] [PubMed] [Google Scholar]
- 38. Meredith MM, Liu K, Darrasse‐Jeze G, et al. Expression of the zinc finger transcription factor zDC (Zbtb46, Btbd4) defines the classical dendritic cell lineage [in English]. J Exp Med. 2012;209(6):1153‐1165. [DOI] [PMC free article] [PubMed] [Google Scholar]
- 39. Liu Y‐N, Niu S, Chen W‐Y, et al. Leukemia inhibitory factor promotes castration‐resistant prostate cancer and neuroendocrine differentiation by activated ZBTB46. Clin Cancer Res. 2019;25(13):4128‐4140. [DOI] [PMC free article] [PubMed] [Google Scholar]
- 40. Cella M, Fuchs A, Vermi W, et al. A human NK cell subset provides an innate source of IL‐22 for mucosal immunity. Nature. 2009;457(7230):722‐725. [DOI] [PMC free article] [PubMed] [Google Scholar]
- 41. Bernink JH, Peters CP, Munneke M, et al. Human type 1 innate lymphoid cells accumulate in inflamed mucosal tissues. Nat Immunol. 2013;14(3):221‐229. [DOI] [PubMed] [Google Scholar]
- 42. Tang Q, Ahn Y‐O, Southern P, Blazar BR, Miller JS, Verneris MR. Development of IL‐22–producing NK lineage cells from umbilical cord blood hematopoietic stem cells in the absence of secondary lymphoid tissue. Blood. 2011;117(15):4052‐4055. [DOI] [PMC free article] [PubMed] [Google Scholar]
- 43. Hoorweg K, Peters CP, Cornelissen F, et al. Functional differences between human NKp44(−) and NKp44(+) RORC(+) innate lymphoid cells. Front Immunol. 2012;3:72. [DOI] [PMC free article] [PubMed] [Google Scholar]
- 44. Collins A, Rothman N, Liu K, Reiner SL. Eomesodermin and T‐bet mark developmentally distinct human natural killer cells. JCI Insight. 2017;2(5):e90063. [DOI] [PMC free article] [PubMed] [Google Scholar]
- 45. Strober W, Watanabe T. NOD2, an intracellular innate immune sensor involved in host defense and Crohn's disease. Mucosal Immunol. 2011;4(5):484‐495. [DOI] [PMC free article] [PubMed] [Google Scholar]
- 46. Clark K, Takeuchi O, Akira S, Cohen P. The TRAF‐associated protein TANK facilitates cross‐talk within the IkappaB kinase family during toll‐like receptor signaling [in English]. Proc Natl Acad Sci USA. 2011;108(41):17093‐17098. [DOI] [PMC free article] [PubMed] [Google Scholar]
- 47. Flo TH, Halaas Ø, Torp S, et al. Differential expression of toll‐like receptor 2 in human cells. J Leukoc Biol. 2001;69(3):474‐481. [PubMed] [Google Scholar]
- 48. Zhang FX, Kirschning CJ, Mancinelli R, et al. Bacterial lipopolysaccharide activates nuclear factor‐κB through Interleukin‐1 signaling mediators in cultured human dermal endothelial cells and mononuclear phagocytes. J Biol Chem. 1999;274(12):7611‐7614. [DOI] [PubMed] [Google Scholar]
- 49. Oliveira‐Nascimento L, Massari P, Wetzler LM. The role of TLR2 in infection and immunity. Front Immunol. 2012;3:79‐79. [DOI] [PMC free article] [PubMed] [Google Scholar]
- 50. Jin MS, Kim SE, Heo JY, et al. Crystal structure of the TLR1‐TLR2 heterodimer induced by binding of a tri‐acylated lipopeptide. Cell. 2007;130(6):1071‐1082. [DOI] [PubMed] [Google Scholar]
- 51. Ling F, Kang B, Sun XH. Id proteins: small molecules, mighty regulators [in English]. Curr Top Dev Biol. 2014;110:189‐216. [DOI] [PubMed] [Google Scholar]
- 52. Xu W, Cherrier DE, Chea S, et al. An Id2(RFP)‐reporter mouse redefines innate lymphoid cell precursor potentials [in English]. Immunity. 2019;50(4):1054‐1068.e1053. [DOI] [PMC free article] [PubMed] [Google Scholar]
- 53. Bando JK, Gilfillan S, Di Luccia B, et al. ILC2s are the predominant source of intestinal ILC‐derived IL‐10 [in English]. J Exp Med. 2020;217(2). [DOI] [PMC free article] [PubMed] [Google Scholar]
- 54. Cowan JE, McCarthy NI, Parnell SM, et al. Differential requirement for CCR4 and CCR7 during the development of innate and adaptive αβT cells in the adult thymus [in English]. J Immunol. 2014;193(3):1204‐1212. [DOI] [PMC free article] [PubMed] [Google Scholar]
- 55. Olin A, Henckel E, Chen Y, et al. Stereotypic immune system development in newborn children. Cell. 2018;174(5):1277‐1292.e1214. [DOI] [PMC free article] [PubMed] [Google Scholar]
- 56. Mitamura Y, Nunomura S, Furue M, Izuhara K. IL‐24: a new player in the pathogenesis of pro‐inflammatory and allergic skin diseases. Allergol Int. 2020;69:405‐411. [DOI] [PubMed] [Google Scholar]
- 57. Karagiannis F, Masouleh SK, Wunderling K, et al. Lipid‐droplet formation drives pathogenic group 2 innate lymphoid cells in airway inflammation. Immunity. 2020;52(4):620‐634.e626. [DOI] [PubMed] [Google Scholar]
- 58. Konya V, Mjösberg J. Lipid mediators as regulators of human ILC2 function in allergic diseases. Immunol Lett. 2016;179:36‐42. [DOI] [PubMed] [Google Scholar]
- 59. Crellin NK, Trifari S, Kaplan CD, Satoh‐Takayama N, di Santo JP, Spits H. Regulation of cytokine secretion in human CD127+ LTi‐like innate lymphoid cells by toll‐like receptor 2. Immunity. 2010;33(5):752‐764. [DOI] [PubMed] [Google Scholar]
- 60. Robbins JR, Zeldovich VB, Poukchanski A, Boothroyd JC, Bakardjiev AI. Tissue barriers of the human placenta to infection with Toxoplasma gondii . Infect Immun. 2012;80(1):418‐428. [DOI] [PMC free article] [PubMed] [Google Scholar]
- 61. Huhn O, Ivarsson MA, Gardner L, et al. Distinctive phenotypes and functions of innate lymphoid cells in human decidua during early pregnancy. Nat Commun. 2020;11(1):381. [DOI] [PMC free article] [PubMed] [Google Scholar]
- 62. Vacca P, Montaldo E, Croxatto D, et al. Identification of diverse innate lymphoid cells in human decidua. Mucosal Immunol. 2015;8(2):254‐264. [DOI] [PubMed] [Google Scholar]
- 63. Vazquez J, Chasman DA, Lopez GE, et al. Transcriptional and functional programming of decidual innate lymphoid cells [in English]. Front Immunol. 2020;10:3065. [DOI] [PMC free article] [PubMed] [Google Scholar]
Associated Data
This section collects any data citations, data availability statements, or supplementary materials included in this article.
Supplementary Materials
Supplementary Figure 1 | CB ILCs show unique transcriptional pathways Pathway analyses from the Top 100 up‐regulated genes from ILC1‐like, ILC2, ILC3‐like compared to CD56bright NK cells calculated using gProfiler. The P‐value corresponds inversely to the size of the pathway: the lower the P‐value the bigger the circle for the pathway.
Supplementary Figure 2 | CB ILCs express CD28 and CCR4 on the cell surface. Cryopreserved CB cells were stained for ILCs. Representative dot plots and quantification of CD28 (n = 13, top) and CCR4alt (n = 4, buttom) on CB ILC1‐like, ILC2, ILC3‐like, CD56bright and CD56dim NK cells. The height of the bars represents the mean ± SEM. Levels of significance were calculated with a non‐parametric ANOVA (Kruskal‐Wallis test) with a multiple comparison post‐test (Dunn's), * p value <0.05, ** P‐value <0.005, *** P‐value <0.001. Data represent at least three donors from three different experiments.
Supplementary Figure 3 | CD56 bright NK cells show a unique set of up‐regulated genes compared to ILC subsets. The top 200 up‐regulated genes of CD56bright NK cells against ILC1‐like(yellow), ILC2(green), ILC3‐like (blue) were calculated and displayed in a Venn Diagram for intersecting genes. The 28 shared genes are displayed and were taken for pathway analyses via gProfiler. The P‐value corresponds inversely to the size of the pathway: the lower the P‐value the bigger the circle for the pathway.
Supplementary Figure 4 | Heatmaps contrasting all three ILC subsets against each other. Heatmaps showing the top 100 most differentially expressed genes between ILC1‐like cells and ILC2 (top), ILC1‐like and ILC3‐like cells (middle), and ILC2 and ILC3‐like cells (bottom).
Supplementary Figure 5 | Expression of ILC3‐specific genes in CB ILC3‐like, CB NK, and tonsillar ILC3 cells. Cryopreserved CB cells were stained for ILC markers and representative histograms are shown for ILC3‐like cells (blue) and CD56dim NK cells for (A) IL1R1 (n = 3), CD45RA (n = 3), and CD69 (n = 3) and (B) NKp44 (n = 4), NKp46 (n = 4), CD56 (n = 5), and CCR6 (n = 3). (C) Normalized RNA sequencing read counts are displayed for CB ILC3‐like and tonsillar ILC3 cells as violin plots for IL23R and aryl hydrocarbon receptor (AhR). Levels of significance were calculated using a Mann‐Whitney test (non‐parametric t test).
Supplementary Figure 6 | CB ILC3‐like cells are more similar to CB CD56 bright NK cells than to tonsillar ILC3. Heatmap showing the top 100 most differentially expressed genes between tonsillar ILC3 and CB CD56bright NK cells with further inclusion of CB ILC3‐like cells.
Supplementary Figure 7 | CB ILC3‐like cells show upregulation of multiple genes of the TLR signaling pathway. Normalized read counts of RNAseq data visualized by violin plots for genes typically found within TLR signalling pathways: MYD88, IRAK4, IRAK1, IRAK2, TRAF6, MAP3K7 (TAK1), NFKB1, NFKB2, IRF7, IRF3, TBK1, JUN (AP‐1), and TICAM1 (TRIF) in ILC3‐like cells and T cells (CD4+ and CD8+). Levels of significance were calculated using a Mann‐Whitney test (non‐parametric t test), * P < 0.05, ** P < 0.001.
Data Availability Statement
RNA sequencing data for CB ILC1‐like cells, CD56bright NK cells and CD56dim NK cells were used in a previous study [4] and are accessible at NCBI Project ID: PRJNA594493 (http://www.ncbi.nlm.nih.gov/bioproject/594493). RNA sequencing data for CB ILC2 and ILC3‐like cells is accessible at NCBI Project ID: PRJNA642003 (https://www.ncbi.nlm.nih.gov/bioproject/?term=PRJNA642003).