Abstract
Existing computational models used for simulating the flow and species transport in the human airways are zero-dimensional (0D) compartmental, three-dimensional (3D) computational fluid dynamics (CFD), or the recently developed quasi-3D (Q3D) models. Unlike compartmental models, the full CFD and Q3D models are physiologically and anatomically consistent in the mouth and the upper airways, since the starting point of these models is the mouth–lung surface geometry, typically created from computed tomography (CT) scans. However, the current resolution of CT scans limits the airway detection between the 3rd–4th and 7th–9th generations. Consequently, CFD and the Q3D models developed using these scans are generally limited to these generations. In this study, we developed a method to extend the conducting airways from the end of the truncated Q3D lung to the tracheobronchial (TB) limit. We grew the lung generations within the closed lung lobes using the modified constrained constructive optimization, creating an aerodynamically optimized network aiming to produce equal pressure at the distal ends of the terminal segments. This resulted in a TB volume and lateral area of ∼165 cc and ∼2000 cm2, respectively. We created a “sac–trumpet” model at each of the TB outlets to represent the alveoli. The volumes of the airways and the individual alveolar generations match the anatomical values by design: with the functional residual capacity at 2611 cc. Lateral surface areas were scaled to match the physiological values. These generated Q3D whole lung models can be efficiently used for conducting multiple breathing cycles of drug transport and deposition simulations.
Keywords: CFD; quasi-3D (Q3D); Q3D lung airway; constrained constructive optimization; sac–trumpet, CCO
Graphical Abstract
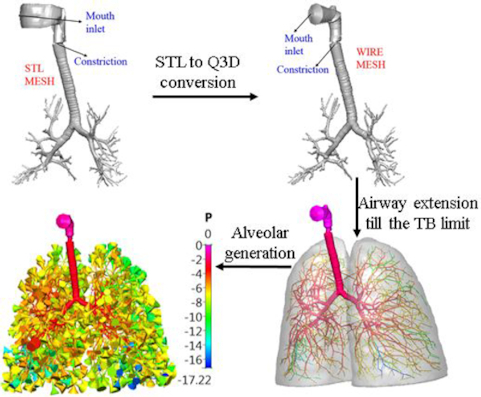
Graphical Abstract.
Highlights
Extending the airways from the end of the truncated quasi-3D (Q3D) lung to the tracheobronchial (TB) limit. This is done using computational fluid dynamics (CFD) research corporation’s modified constrained constructive optimization algorithm.
Creating “sac–trumpet” models, at each of the TB outlets, with these sac–trumpets representing the alveoli (generation 16–24).
This Q3D whole lung can be easily adapted (to get a locally diseased lung).
The simulation time on such Q3D meshes is nearly 10 000 times faster than CFD meshes.
Nomenclature
- 0D
Zero dimensional
- 1D
One dimensional
- 3D
Three dimensional
- CCO
Constrained constructive optimization
- CFD
Computational fluid dynamics
- CT
Computed tomography
- DOF
Degrees of freedom
- E–E
Euler–Euler
- FRC
Functional residual capacity
- isRootBody
A Boolean variable, associated with all segments of the CCO tree.
- MASS
Macro air sac system
- Ncon
A used determined number of segments, for the CCO model
- PNNL
Pacific Northwest National Laboratory
- Q3D
Quasi-3D
- SIP
Stochastic individual pathway
- TB
Tracheobronchial
- TPL
Typical path length
- WLAM
Whole lung airway model
- xnew
A coordinate point, used in the CCO process
1. Introduction
In general, there are three approaches to simulate flow and particle transport in the human lung airways. The first is the zero-dimensional (0D) compartmental approach, where each airway is treated as a 0D compartment. The assumptions used in this approach include (i) constant diameters and lengths in a particular airway section, (ii) a 1:2 branching ratio (i.e. a parent branch will have two daughter branches) in accordance with the typical path lung (TPL) model (Schum & Yeh, 1980; Yeh & Schum, 1980; Weibel, 1991), (iii) no effect of the anatomical geometry, i.e. the three-dimensional (3D) geometrical structure, and (iv) uniform division of the flow rate when the parent airway branches into two daughter airways. These assumptions make the extension to nonstandard lung geometries (for instance the diseased lungs) nontrivial. Nevertheless, this approach has been widely used as the driver for particle transport simulations for various lung models (Weibel, 1991; ICRP Publication 66, 1994; NCRP Report, 1997).
The second approach uses 3D computational fluid dynamics (CFD) modeling. This approach involves first obtaining the surface mesh from computed tomography (CT) scans or other images, then creating volumetric meshes inside the lung domain, and lastly solving the flow conservation equations in the volumetric computational domain. Some common issues with this approach, as detailed in previous publications (Kolanjiyil & Kleinstreuer, 2013; Kannan et al., 2016, 2017b), include large computational cell counts resulting in large numbers of degrees of freedom (DOF), mesh generation effort, solver robustness, and convergence issues.
To address some of the issues with fully 3D CFD, a third approach, namely the quasi-3D (Q3D) approach, was presented by Kannan et al. (2017a) for modeling the airflow in human lungs. The Q3D approach is a robust, fast running, and easily adaptable alternative to the fully 3D CFD approach. Its starting point is the 3D surface mesh obtained from a patient-specific CT scan, which is then contracted to a structure of connected wires, in order to approximate the surface mesh as close as possible. The radius information is present in every computational Q3D node. Additional details, on the Q3D data structure, can be obtained from the earliest Q3D paper (Kannan et al., 2017a). This connected wire or tube structure defines a simplified computational domain for the CFD solver and the total number of DOFs is much smaller than that of a 3D volumetric mesh. Recently, this Q3D model was extended to (i) solve the drug transport and absorption in the lung (Kannan et al., 2018) and (ii) to calibrate the structure of the diseased lungs using spirometry computations (Kannan et al., 2018).
There are also one-dimensional (1D) models, which attempt to model the lung (Tawhai & Lin, 2010; Yin et al., 2013). The Q3D model has additional dimensionality than the above models including (i) the capability to be extracted from 3D STereoLithography (STL)/other-surface meshes, (ii) having all the three components of velocity, pressure, and the density components in each computational cell, needed for running 3D Navier Stokes equations, (iii) the capability to incorporate turbulence models, (iv) having the radius as a parameter in each computational cell, thereby making it straightforward to create diseased version by constricting required sections of the Q3D lung, (v) using the approximation of using analytical shear stress on the Q3D walls (Kannan et al., 2017a), (vi) the capability to be spread out in 3D space, (vii) the capability of extending to species transport and lung physiologically based pharmacokinetic (PBPK) models (Kannan et al., 2018), and (viii) the capability of extending to other areas, like oral drug delivery and gastroIntestinal tract (GUT) PBPK models (Kannan & Andrzej, 2020), and for cytotoxicity of analysis of COVID-19-related drugs (Kannan & Przekwas, 2020).
Unlike compartmental models, the CFD and Q3D models are both physiologically and anatomically consistent. Anatomically consistent means that the geometric parameters like the volumes, areas, 3D shapes, slopes, and curvatures must be very similar to the human. However, the anatomical consistencies are often limited to the mouth and the upper airways; i.e. the above parameters are similar for the CFD/Q3D models and the human only in the mouth and the upper airways. The current resolution of CT scans often limits accurate detection of the lung airways between 3 and 4 airway generations (Kolanjiyil & Kleinstreuer, 2013; Tian et al., 2015) and in the best possible scenario [for example, given a highly detailed lung airway geometry such as the one from the Zygote 3D anatomical database (Zygote, American Fork, UT, USA; https://www.zygote.com/)], an average of 7–9 airway generations can be extracted. In the past, we had used this Zygote model, until the 8th generation, to get the spatially accurate depositions (Kannan et al., 2018). Consequently, the resulting CFD and the Q3D models are generally limited to between 3–4 or 7–9 airway generations. Hence, researchers who wish to consider flow and species transport deeper in the lung are forced to employ less realistic approaches to model the remainder of the airway generations. Some of these include the following: (i) the use of the 0D compartmental approach beyond the ends of the truncated lung models (Kannan et al., 2018); (ii) the use of the stochastic individual pathway (SIP) formulation (Tian et al., 2011, 2015), wherein individual pathways extend from the end of the basal CFD mesh to the terminal bronchioles; and (iii) the use of the Wind–Kessel boundary condition (Kannan et al., 2016), at the outlets of the truncated lung models.
For the SIP formulation method, the airways are individual conduits from a given outlet, and thus do not account for the overall perfusion of the airways in the lung lobes. Consequently, they may not be as accurate for species transport and deposition studies as a full lung. The Wind–Kessel boundary condition algorithm allows the “escaped” particles to re-enter the airway through the outlets, thereby partially accounting for the drawbacks of having a finite number of lung generations in the computational mesh. The main crux of this algorithm is that the particles leaving outlets of the truncated lung (i.e. during inhalation) are allowed to “continuously move” in an imaginary straight tube. After the flow reversal (i.e. during exhalation), the particle outside the lung-domain moves toward the exit face and eventually re-enters the computational domain.
Inclusion of 0D or SIP models constitutes a compromise in simulation realism, which may compromise accuracy, especially for simulations involving several breathing cycles. In such cases, there is (i) a continual influx of the particles/species from the lower lung to the upper lung during the exhalation phase and (ii) a redistribution of the pressure, at the upper lungs, based on the pressure in the alveoli. If a compromise in realism leads to an inaccurate computation of alveolar pressures using the approximate models, this potential inaccuracy can translate to an incorrect pressure in the upper airways and the mouth. The mass deposited in the lower lungs may also be incorrectly modeled using the approximate models. This may lead to an erroneous mass value for particles re-entering the upper airways. The error may be further magnified when certain sections of the lower airways and/or the alveoli are diseased. This can affect the spirometry-type computations needed to calibrate the health of the lung (Kannan et al., 2018).
For this study, a mesh of the complete lung airways is generated by (i) extending the airways from the end of the truncated Q3D lung to the tracheobronchial (TB) limit and (ii) creating “sac–trumpet” models, at each of the TB outlets, with these sac–trumpets representing the alveoli (generation 16–24). The extension of the airways to the TB limit is carried out by growing the existing tree network defined by the Q3D mesh, within the closed lung lobes, using the modified constrained constructive optimization (CCO) algorithm (Karch et al., 1999). The CCO algorithm creates an aerodynamically optimized network aimed at producing equal pressure at the distal ends of the terminal segments. In the past, the CCO algorithm has been used to generate arterial-to-prearteriolar trees in extreme detail, to the order of nearly 10 000 segments, starting from the main artery (Van Beek et al., 1989; Schreiner, 1993). It was used in the context of the arterial tree structure, efficiently adding new segments and perfusing to all sections of a given tissue (Van Beek et al., 1989; Schreiner, 1993). The main differences between the current implementation and the existing approaches are as follows: (i) In the current approach, newly created segments can only be connected to the terminal branches of the existing lung tree model rather than to the body of the existing lung tree; (ii) the length/diameter ratio of any new segment is always kept higher than a prescribed value; and (iii) the addition of new segments stops when the overall TB lung volume exceeds the cutoff volume [in this case, the lung TB functional residual capacity (FRC): the FRC in the TB section]. Due to these differences, the current approach has some unique advantages, including the following: (i) physiologically consistency since all the airways connected to the original Q3D lung should have already been obtained from the CT scans; (ii) smooth transition of the airway diameters from the original Q3D lung model to the distal limit of the TB section; and (iii) improved numerical convergence.
For respiratory airways, each outlet of the Q3D extended lung (till the TB limit) is fitted with a control volume, which visually resembles a trumpet. These sac–trumpets represent the alveoli generations 16–24. The volumes of the individual alveolar generations match the anatomical values, i.e. the generation-specific alveolar component of the FRC. The lateral surface areas of the TB and the individual alveolar generations need to be scaled in the computational solver, to match the physiological lateral surface areas. In general, the lower airways and the alveoli are highly folded. This folding provides a much greater surface area for the gas exchange to occur (Roan & Christopher, 2011).
The Q3D whole lung model may be a starting point for conducting the whole lung multiple breathing cycle particle/drug transport and deposition simulations directly using a Euler–Euler (E–E) simulation approach (Frederix, 2016; Frederix et al., 2017). The E–E Q3D approach can predict deposition in the alveoli and the lower lungs, more accurately and much faster than CFD simulations. Hence, the effects of drug formulations can be quickly tested using such simulations and subsequently optimize the delivery to the lower lung and the alveoli. This Q3D lung can also be easily modified (i.e. shrinking of the radii or changing the alveolar capacitances), at desired locations, to mimic the effect of diseases such as chronic obstructive pulmonary disease. It has also been demonstrated to be an ideal candidate for spirometry calibrations [currently performed, using a combination of Q3D and 0D compartmental models (Kannan et al., 2018)].
Thus, the main contributions of this paper are as follows: (i) develop the modified CCO algorithm, to extend any truncated lung, to the TB limit. This modeling approach is one of the first efforts to create a 3D, spatially heterogeneous, lung-lobe-filling whole lung model. The lateral surface area of the extended lung was in the same range as the experimental measurements. (ii) Create a Q3D whole lung model, by inserting alveolar sacs at the TB outlets and (iii) demonstrate that this whole lung can be used for simulations (i.e. conservation equations can be implemented), by running sample flow transport simulations. This Q3D whole lung model can serve as the starting step for conducting whole lung multiple breathing cycle particle/drug transport and deposition simulations, and thus eventually help in optimizing the drug delivery to the lower lung and the alveoli.
This paper is organized as follows. For Section 2, a detailed introduction to the Q3D model and its role in the creation of the lung geometry is given in the Materials and Methods section. A description of the CCO algorithm and its variant, adapted here in the context of the extension of the truncated Q3D lung, is provided in Section 3 (Theory/Calculations section). The creation of the sac–trumpet model is also provided in the same section. The extension and the sac–trumpet creation are demonstrated for the Zygote and PNNL (Pacific Northwest National Laboratory) lung models in Section 4 (Results and Discussions section). Finally, conclusions from this study are summarized in Section 5.
2. Materials and Methods
2.1. The Q3D model
In many biomedical and engineering problems, physical processes occur in networks of pipes/tubes, cables, wires, or other 1D structures. The best examples are the human vascular system, lymphatic network, neurons with a network of dendrites and axons, microfluidic channels in biochips, and of course the case of airflow transport in the lung. Full-fledged 3D computational simulations of such large tubing structures are possible for some cases such as inhaled particle transport and deposition in the lung airways [wherein the total physical time is on the order of seconds (Kannan et al., 2016)]. However, 3D computational simulations that require a physical time scale greater than several tens of seconds (or more) are computationally demanding and in some cases, not feasible (for instance, simulating the particle transport/deposition in the lung airways, for several breathing cycles).
A 1D modeling of a tubing network distributed in a 3D space is well suited to solving such a problem. Kannan et al. (Kannan et al., 2017a, 2020; Kannan & Andrzej, 2020) have developed a wire/tube model to solve such problems. The major advantage of this approach is the ease of model setup, high computational speed, simple visualization of results, and an easy link to compact models such as spring/mass/damper devices, valves, pumps, controllers, and 0D compartmental models.
In this study, the surface mesh for the human lung airway obtained from the Zygote male full body anatomy model (www.zygote.com) was used first for demonstration purposes. This mesh corresponds to the 50% percentile male adult human (by height). This geometry represents the lung surface very well and can capture several features like the cartilaginous ring structures, the radius dimensions, and the one-to-many bifurcations (details provided in Kannan et al., 2017a, b). The algorithm of Au et al. (2008) is used to extract the Q3D mesh out of the Zygote lung surface mesh.
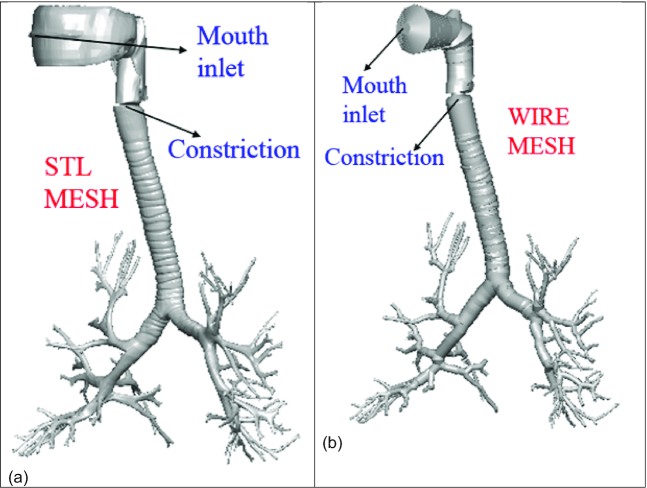
The nasal region from the Zygote model was truncated. The surface mesh for the model has approximately six to eight airway generations, where the surface mesh and the wire mesh are shown in Fig. 1. It can be seen in the figure that lung geometry details are still preserved (for instance, the cartilaginous rings). The wire mesh has around 1000 wire or tubular cells (i.e. DOF). The mouth region is not a high-fidelity representation of the original surface mesh since that region is overly complicated and cannot be accurately represented by a tubular or cylindrical geometry (i.e. wire with radius). In the past, the deposition in the mouth regions was obtained from a compartmental model, instead of the Q3D approximated mouth (Kannan et al., 2018) (hence there are ways to overcome this mouth modeling situation). A traditional fully 3D CFD mesh built using the surface mesh would result in approximately 2–5 million (M) cells (Tian et al., 2011, 2015; Kolanjiyil & Kleinstreuer, 2013; Kannan et al., 2016, 2017b). Solving the transport equations on such a mesh may require several parallel machines and result in several days of simulation time, depending on the application. The Q3D wire mesh can produce a result that may be qualitatively acceptable within a few minutes of (forward run) simulation time because they are approximately 10 000 times faster than CFD methods (Kannan et al., 2017a). This is due to its simple geometrical cell representation and a significant reduction in cell count (1000 Q3D wire cells versus 2–5M regular cells). This results in faster convergence, due to the reasonable mesh quality (unlike the high aspect ratios, high stretching factors in traditional CFD meshes, and the hanging nodes present in Omnitree-type meshes).
Figure 1:
Lung airway model. Case (a): high-fidelity lung airway surface mesh obtained from the Zygote body; it is used to extract the center line (wire) and radius of the lung airways. Case (b): Q3D wire mesh for the same region constructed on the extracted information from the lung airways. It is clear that the generated wire mesh is a good approximation to the high-fidelity CFD mesh in most of the lung airways.
The conservation equations are then solved in each of these wires. The Q3D simulations also converge faster, due to the absence of badly skewed cells or highly stretched cells, thereby requiring fewer steady/unsteady solver sweeps during a steady/transient simulation. The niceties on the Q3D geometry creation, the grid format, the geometric parameters, the numerical assumptions of the Q3D model in the CFD context, and solving the conservation equations for the fluid and the species modules are provided in the earliest Q3D paper (Kannan et al., 2017a). Details on the Q3D creation, its accuracy, its speed, solution accuracy (including in the context of the flow in the human lung), problem setup, and robustness are present in Kannan et al. (2017a). Similarly, details on the flow solver, the assembly of the matrices, the spatial and temporal schemes, and the modeling of the turbulent stresses are present in Kannan et al. (2016,2017a, b). Complicated secondary flows (Briley & McDonald, 1984), the local vorticity creation at the ridges, and other detailed features cannot be captured by the Q3D model. Similarly, other complicated phenomena like the aerothermal effects (Belhocine & Omar, 2018), analyses of thermal/fluid boundary layers (Belhocine & Oday, 2015; Belhocine, 2016), effects of wall heating (Belhocine, 2017), effects of convective heat transfer (Belhocine & Omar, 2017), thermal-turbulent interactions (Belhocine & Oday, 2019), and effect of friction (Belhocine & Oday, 2020) can be modeled only using detailed CFD models, as demonstrated by Belhocine and his colleagues. However, the Q3D method can accurately predict fluid pressures and provide accurate transport effects.
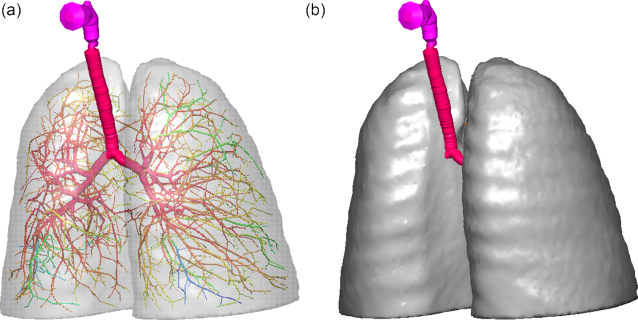
Figure 2 shows the truncated Q3D lung enclosed in the lung lobes. It can be observed that there exists plenty of space in the lobes that need to be filled with extended Q3D airways. This is discussed in the next section.
Figure 2:
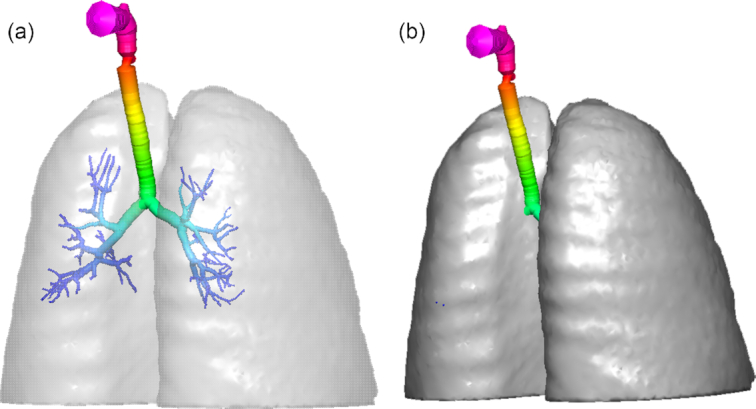
The original truncated Zygote Q3D lung, enclosed in the lung lobes. Case (a): the lobes are made transparent. Case (b): the lobes are made opaque.
3. Theory and Calculations
3.1. CCO algorithm and its adaption for the extension of the truncated Q3D lung
In this section, we describe the extension of the Q3D-Zygote airway, until the TB limit (i.e. around 15 generations) using an adapted CCO algorithm. The original CCO algorithm proposed by Karch et al. (1999) is discussed first, followed by its variant adapted for lung airway generation.
3.1.1. The original CCO algorithm
The main aspects of the Karch et al. (1999) CCO algorithm version (in the context of the airway generation) are as follows:
The portion of tissue wherein the original Q3D segment is to be expanded and modeled as a 3D closed volume. In this case, the two lung lobes represent the tissue portion.
An airway tree is created and is represented as a binary branching network of rigid cylindrical tubes, with perfusion happening at laminar and steady conditions. Starting at the original truncated Q3D lung (i.e. the root segment’s outlets), the tree successively bifurcates down to the pre-alveolar level, where the model tree is truncated in the form of terminal segments.
The actual extension of the Q3D tree is as follows:
A Cartesian coordinate point xnew is randomly chosen. xnew is accepted as a candidate for a new terminal location only if (a) xnew lies in the lobe domain and (b) the distance of xnew to all segments generated so far exceeds an adaptive threshold value dmin (distance criterion).
If xnew has been accepted as a new terminal site, it is tentatively connected to the midpoints of a fixed number (Ncon) of segments in the spatial vicinity of xnew. However, adding a new terminal segment inew, i.e. generating a new bifurcating segment ibif, disturbs the distribution of segmental flows, thus violating the boundary condition regarding the terminal flows Qterm.
In order to re-establish the correct terminal flow distribution, the hydrodynamic resistance of the tree must be continuously readjusted. Since the lengths of the segments, as well as the terminal and perfusion pressures, are fixed, this can only be accomplished by appropriately changing the segments’ radii for each temporary connection.
Each new bifurcation at the temporary connection sites (j = 1 to Ncon) is geometrically optimized. The case that comes numerically closest to satisfying the objective function (i.e. equalization of the outlet pressures) is selected as the permanent connection. The details of the optimization approach and its actual implementation can be obtained from Karch et al. (1999).
The original CCO approach has been successfully used to generate realistic, arterial trees for various situations, including (i) using a modified flow distribution, to alter the overall tree morphology and (ii) achieving a radius and diameter, seen in experimental casts (Karch et al., 1999). However, this version of the CCO approach does not yield physiologically and visually consistent (i.e. based on comparison with CT scans) airway extensions. We will demonstrate the weakness of this original CCO approach, using a simple example.
Figure 3 shows a simplistic subset of the truncated Q3D lung (from Fig. 2). The mouth, the upper sections of the trachea, and the regions below generation 1 are removed, where generation 1 represents the main bronchi. The lung lobes are still retained as the outer boundary of the airway extension process. Figure 4 shows the extended airways, created using the original CCO process after 500 iterations. The main observations from this test case example are as follows:
Figure 3:
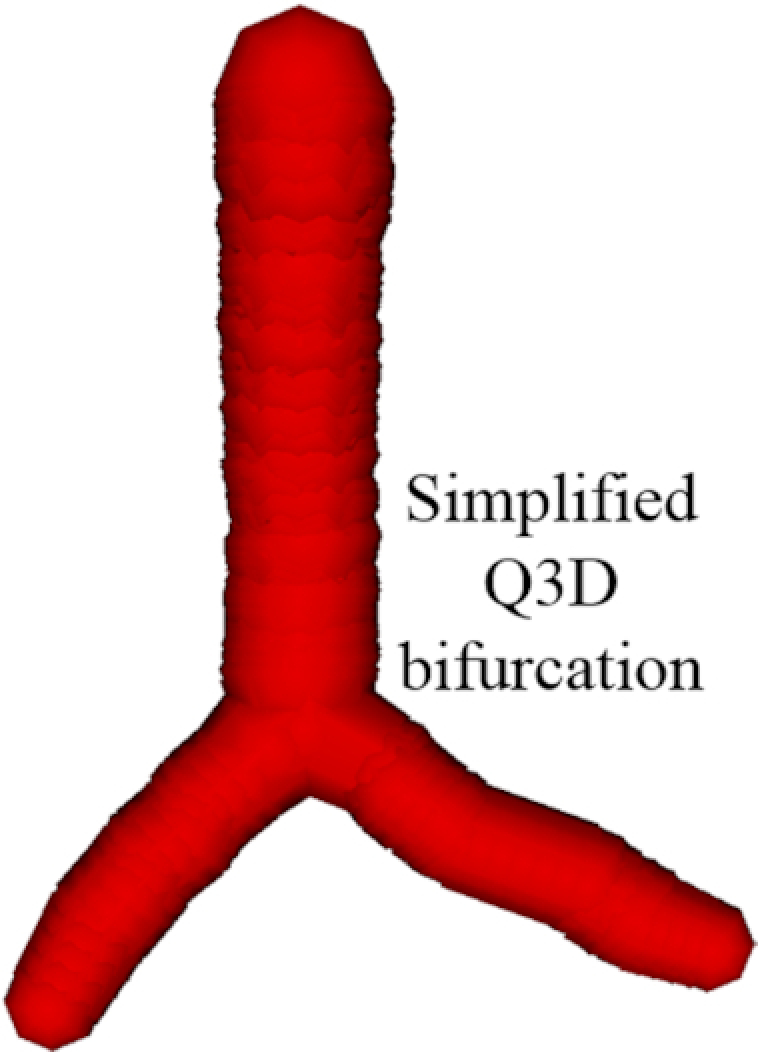
The simplified Q3D lung model, used for demonstration.
Figure 4:
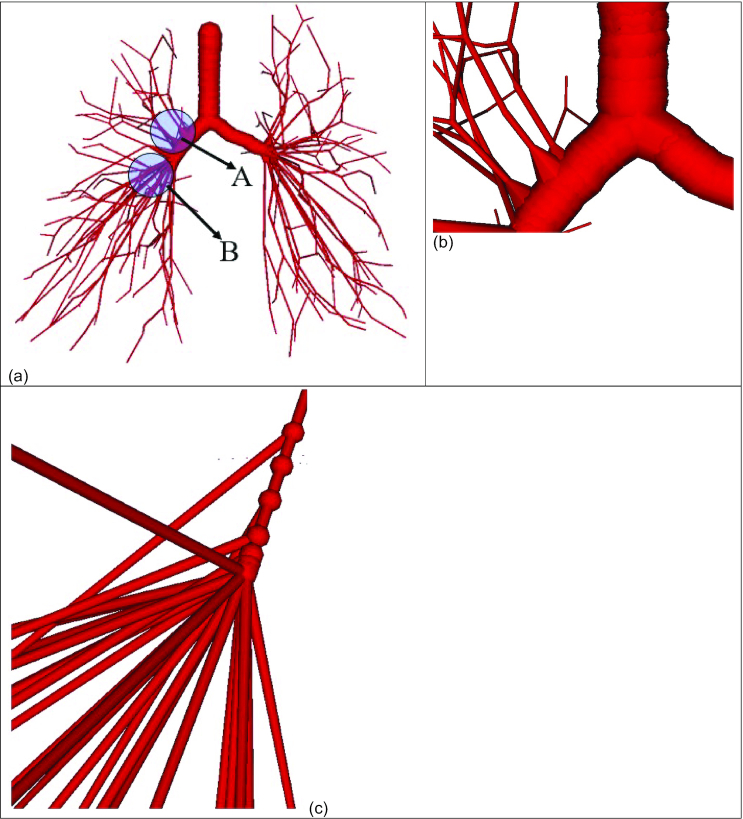
The extended airways, created using the original CCO algorithm. The root section can be seen in Fig. 3. Case (a): the computational domain, comprising of the extended airways; case (b): a zoom-in view of the extension process, happening at the interior of the root segments and case (c): a zoom-in view of the several extensions, originating from a common region.
The highlighted section “A” in Fig. 4a indicates that the tree extension process happens even at the interior of the root node (i.e. in this case, the root if the simplistic subset of the original truncated Q3D lung). This is not likely to be physiologically possible, as there are no known CT scan data that have captured branches emanating out of the larger root branches. Sauret et al. (2002) estimated (from CT scans) that the radius change from one generation to the next is around 20.33, i.e. 1.26. A zoom-view of this event is shown in Fig. 4b. In other words, the original CCO algorithm does not provide preferential protection to the root segments.
The highlighted section “B” in Fig. 4a shows several extensions, emanating out of a common region. A zoom-in view of this event is shown in Fig. 4c. The branches emanate out of the nodes that are in proximity to each other. This implies that the bifurcation procedure described earlier happens at the nodes that are in proximity to each other. This further worsens the aspect ratio (defined as the average radius of the segment divided by the length of the segment). This, in turn, worsens the convergence of the numerical simulations.
Thus, we obtain elongated airway extensions, rather than uniform perfusion of the extended airways into the lung lobes.
Hence, it can be concluded that the original CCO algorithm is not suited for extending the truncated Q3D lung as is and must be adapted or modified for this purpose.
3.1.2. The modified CCO algorithm
The following modifications are incorporated into the CCO algorithm:
A Boolean variable “isRootBody” is created for all segments of the tree. isRootBody is set to true at all the root segments, excluding the terminal root segments. In the case of Fig. 3, there are only two segments, for which the isRootBody is set to false. These are segments connected to the two outlets. All the new segments, created during the extension process, have isRootBody set to false.
If any of the Ncon list of segments in the spatial vicinity of xnew has isRootBody = true, it is removed from the above list of segments. This will ensure that the interior of the original Q3D root is not contaminated by the new airway extensions.
If any of the Ncon list of segments in the spatial vicinity of xnew has an aspect ratio larger than a critical value (say 5.0), it is removed from the above list of segments. This process will prevent the emanation of new airway extensions from nodes that are in proximity to each other. NOTE: In this paper, we have not determined an optimal value for this critical aspect ratio. An optimal value can probably be obtained, by using the TB airway dimensions.
Figure 5 shows the extended airways created using the modified CCO process after 500 iterations. The observations are as follows:
Figure 5:
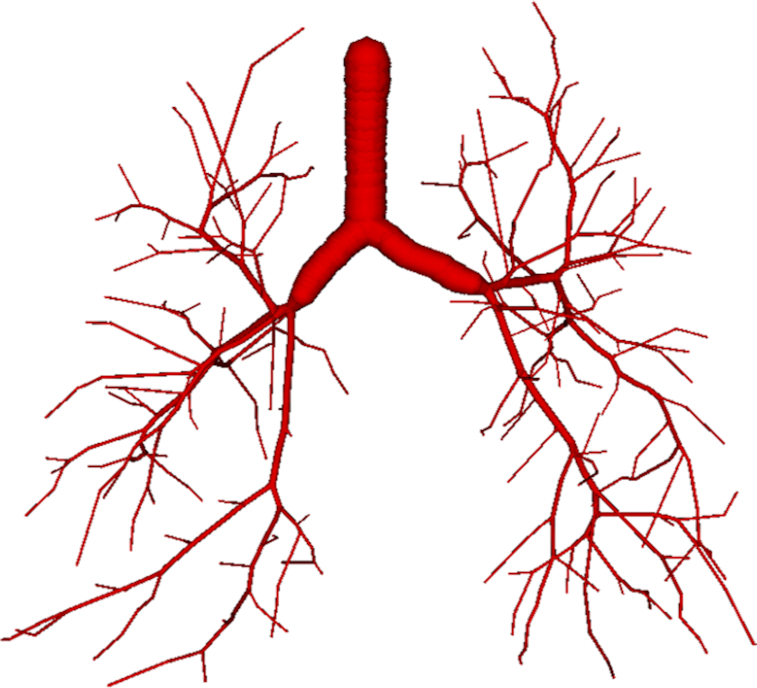
The extended airways, created using the modified CCO algorithm. The root section can be seen in Fig. 3.
There are no extensions that emanate from the interior of the original Q3D root.
There are no branches emanating out of the nodes that are in proximity to each other. Consequently, we expect a better convergence from this extended Q3D mesh than the one created using the original CCO algorithm.
Consequently, we observe more uniform perfusion of the extended airways into the lung lobes. This contrasts with the elongated airway extensions obtained using the original CCO approach.
We expect the radius of the generated airways to become larger, as more iterations are performed (i.e. more extensions are added to the root). Fewer iterations imply that that the low pressure at the final outlets can be attained only by having a smaller radius.
3.2. Alveoli modeling with “sac–trumpet” control volumes
To model the alveoli, sac–trumpet like control volumes were constructed at the end of the trachea-bronchial outlets. In the past, Yu (1978) proposed the use of the trumpet model in the 1D sense. That study treated the airways as a 1D system wherein the flow cross-sectional area varies along the airway depth. This resulted in the lung airway resembling a trumpet. Nonetheless, this approach cannot account for deposition due to impaction and sedimentation (i.e. from the gravitational force) that occurs in the TB regions. Besides, additional deposition due to the several small bifurcations and the 3D flow/geometrical heterogeneities are ignored. However, it is a good model to obtain diffusional deposition predictions.
In a more recent study, Kolanjiyil and Kleinstreuer (2016) had implemented the whole-lung-airway model (WLAM) wherein the airways from the generation-1 onwards were lumped together, i.e. reduced to an exponentially expanding 1D conduit. In this case, the diameters for each generation of the 1D extension were obtained on a subject-specific basis from the calculated total volume that represents each generation of the individual. The alveolar volume was added based on the approximate number of alveoli per generation. However, it suffers from the same shortcomings, described in the earlier paragraph.
CFD Research Corporation (CFDRC) previously developed an alveolar “macro air sac system (MASS)” model (Ding et al., 2005), where the spherical alveolar sacs were attached at the end of the existing airway outlets. Since the entire alveoli were modeled as sacs, there were no generation-specific attributes, provided to the MASS model. Hence, generation-specific deposition fraction values could not be obtained using this MASS model. Moreover, the overall surface area and the volume in the MASS model were primarily due to the 24th generation (the most massive of all the alveolar generations). In reality, the inhaled species do not traverse (but can reach there by diffusive transport) beyond the 22nd generation, since the tidal volume is around 500 ml. This cannot be controlled by the MASS model, thereby resulting in unphysically large depositions due to the large sac surface areas.
Considering the salient features of Yu’s model (trumpet-like lung structure) and the MASS model (alveoli modeled as sacs), we added a sac–trumpet model at each outlet, presented in Fig. 6. This involves the addition of control volumes at the end of each of the TB Q3D lung’s outlets while trying to match the volume in each alveolar generation (16–24) with that of the real lung (listed in Table 1). Figure 6b shows an alveolus collection, modeled by a single sac–trumpet model. Mesh created for the sac–trumpet is also shown in Fig. 6a. The control volumes appear visually like a trumpet since the individual volumes of the generations increase monotonically from alveolar generations 16–24. There are eight control volumes, in each of the volume segments, representing the generations 16–23. The 24th generation comprises only one control volume (for each TB exit), as shown in Fig. 6a. This is because the particles seldom reach the 24th generation, as per the model of Asgharian et al. (2001). This can be changed, if necessary, in future work. For the sake of completeness, we provide a graphical flowchart (Fig. 7) that shows the different modules, used to create the Q3D whole lung model.
Figure 6:
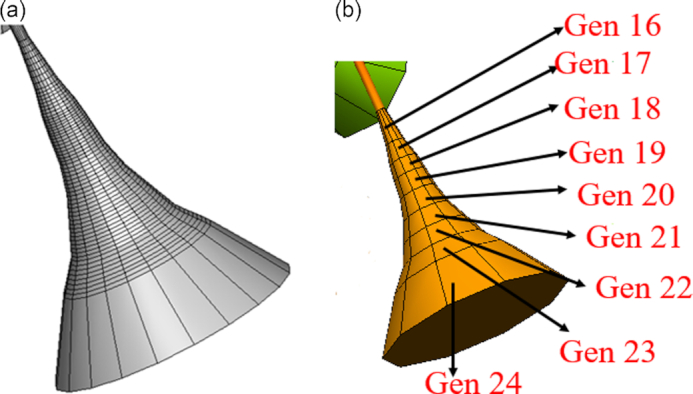
The Q3D model of bronchio-alveolar termination. Case (a): the mesh for an individual Q3D sac–trumpet and case (b): the Q3D sac–trumpet generation-specific representation of the respiratory tree.
Table 1:
Alveolar volumes and lateral surface areas, for the real lung and for the Zygote Q3D lung (FRC ∼ 2600 cc).
| Generation | Volume (cc) | Real lung lateral surface area (cm2) | Q3D lung lateral surface area (cm2) | Lateral area scaling factor |
|---|---|---|---|---|
| 16 | 9.225 | 885.9 | 212.6 | 4.16 |
| 17 | 14.161 | 1469.1 | 225.1 | 6.52 |
| 18 | 19.180 | 2117.5 | 270.2 | 7.83 |
| 19 | 30.585 | 3526 | 292 | 12.06 |
| 20 | 51.1711 | 6033 | 404.86 | 14.9 |
| 21 | 92.1176 | 10860 | 560.5 | 19.37 |
| 22 | 159.252 | 19205 | 734.4 | 26.14 |
| 23 | 296.077 | 35714 | 1154 | 30.9 |
| 24 | 1775.59 | 420323 | 4238 | 99.1 |
Figure 7:
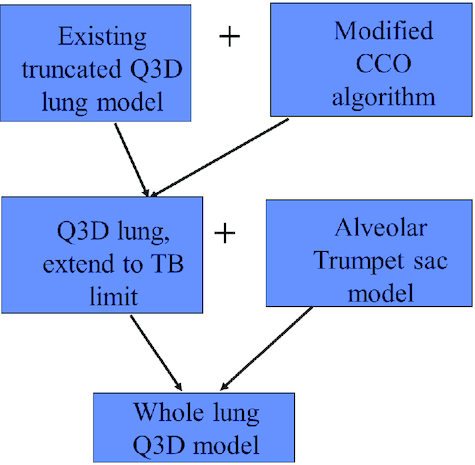
The graphical flowchart showing the combination of the modules used to create the final whole lung Q3D model.
In general, we expect the Q3D whole lung to exhibit similar advantages and disadvantages of the previous Q3D models. As mentioned in the earlier paragraphs, the three types of deposition (due to impaction, sedimentation, and diffusion) can be modeled in both the TB and alveolar regions. Besides, we can get the generation-specific depositions, unlike the MASS models. Unlike the WLAM model, the Q3D whole lung computes the deposition in the different alveoli, i.e. is spatially resolved, similar to the real lung. This lung can also be adapted locally (in the desired regions), to create the diseased lung, using CT and MRI scans. Hence, this Q3D whole lung sets the stage for person-specific modeling of the diseased subjects. This Q3D whole lung can also be used for spirometry applications: This can be viewed as an extension of the spirometry models performed on truncated Q3D models (Kannan et al., 2018). However, strong vortices, recirculation cannot be modeled using either the generic Q3D models or this whole lung Q3D model.
4. Results and Discussions
4.1. TB extension and alveolar sac–trumpet creation for the Zygote lung model
The modified CCO approach is used to extend the Q3D truncated lung to the TB limit (i.e. around 15 generations). Figure 8 shows the populated (to the TB limit) Q3D lung enclosed in the lung lobes. The total FRC in the TB section (excluding the mouth, nasal, oral, laryngeal, and pharyngeal sections) is around 165 cc. This volume is similar to values presented in the literature: (i) Pichelin et al. (2012) provide a value of around 130 cc for a 1.81 m tall male human and (ii) around 155 cc for the Weibel model (Weibel, 1991). The overall TB lateral surface area of this generated lung is around 1996 cm2. It is very difficult to recreate a lung model whose areas and volumes both match that of the real lung because the surface of the airways (and especially the alveoli) of the actual lung is nonsmooth and folded to enhance the lateral surface area. The TB lateral surface area for the real lung is 2471 +/− 320 cm2 as per the experimental measurements of Mercer et al. (1994). Hence, an area correction factor of 1.08–1.40 needs to be used (in the computational solver) to correct the lateral areas (for particle absorption simulations, say in the E–E mode). Thus, the use of our modified CCO algorithm results in the TB lateral surface areas, which are remarkably close to the experimentally observed values, while simultaneously preserving the TB volumes.
Figure 8:
The Zygote TB Q3D lung, enclosed in the lung lobes. Case (a): the lobes are made transparent; case (b): the lobes are made opaque.
Figure 9 shows the whole Q3D lung (TB + alveolar trumpet sacs), colored by pressure (computed from a simple test simulation), for an inlet flow rate of 5 L/min (outlets are unrealistically opened, for the sake of numerical simplicity).
Figure 9:
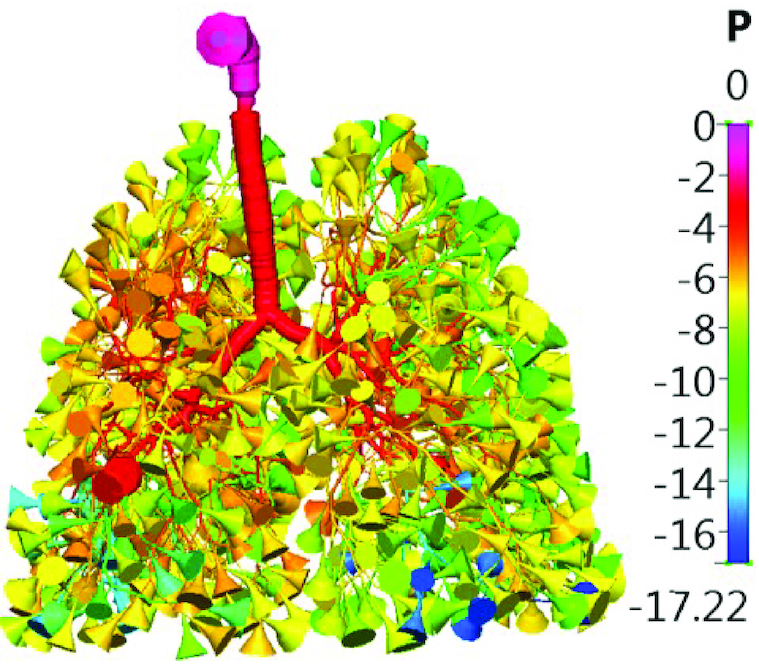
The Zygote whole lung (mouth + TB + sac–trumpet Q3D lung) model. The entire whole lung, colored by pressure, for an inhalation flow rate of 5 L/min.
The FRC of the whole lung is about 2611 cc. The individual alveolar volumes and the lateral surface areas are provided in Table 1. The sac–trumpets are constructed to match the physiological generation-specific alveolar volumes. The actual alveolar lateral areas are also provided in the same table. In general, we need a scaling factor for the lateral surface areas during the deposition simulations.
4.2. TB extension and alveolar sac–trumpet creation for the PNNL lung model
For the sake of completeness and demonstration of the generality of TB extension and alveolar sac–trumpet creation processes, here we also present an extended lung model initially obtained from the PNNL (referred to as the PNNL lung henceforth). Figure 10 below shows the original PNNL surface mesh and the newly created Q3D mesh. To test the accuracy of this procedure, we have simulated the laminar flow within this lung model. The flow rate was 5 L/min, the mouth outlet boundary condition was set to atmospheric pressure and the velocity was prescribed at the TB outlets. Figure 11 shows the comparison of the surface pressures between the full CFD mesh created using this PNNL surface (around 1.2 M cells) and this Q3D mesh. It can be observed that the pressure magnitudes are very similar. The Q3D solution convergence is faster than that of the CFD solution by a factor of nearly 15 000.
Figure 10:
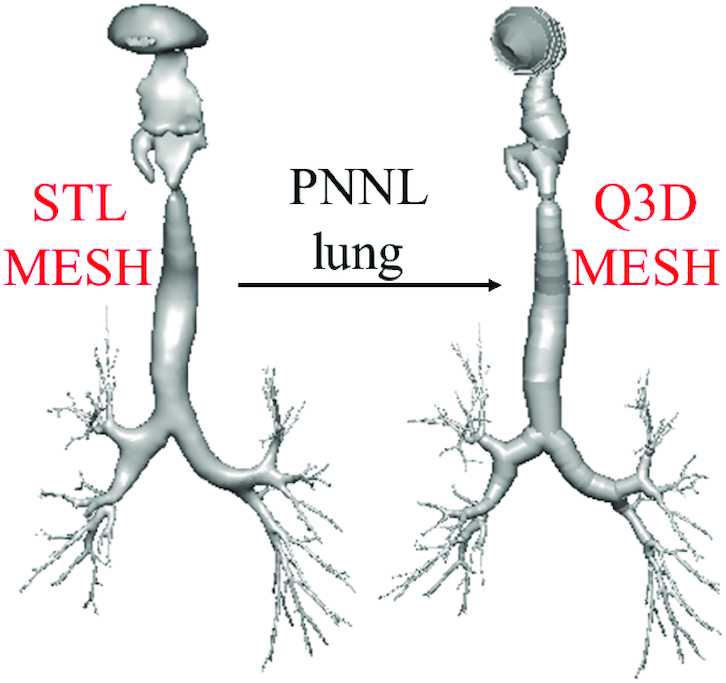
Surface mesh to Q3D mesh conversion procedure shown for PNNL lung model.
Figure 11:
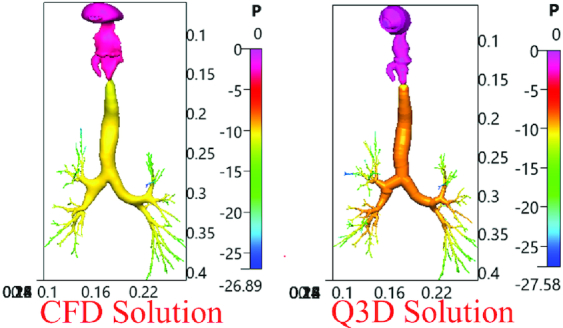
Surface pressures, obtained for a laminar flow (Q = 5L/min) for the CFD and Q3D models (PNNL Lung geometry).
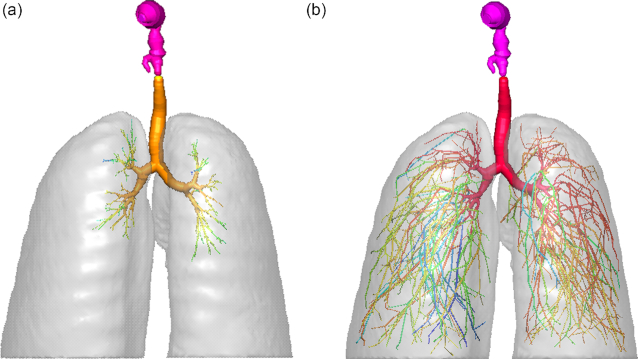
We have used the modified CCO algorithm to extend the PNNL curtailed lung to the TB limit (i.e. generation 15). Figure 12 shows the populated (to the TB limit) Q3D lung enclosed in the lung lobes. The total FRC, in the TB section for this extended lung (excluding the mouth, nasal, oral, laryngeal, and pharyngeal sections), is around 138 cc. The lateral side area for the TB section in this extended Q3D lung is around 1762 cm2. As mentioned earlier, it is almost impossible to recreate a lung model whose areas and volumes both match that of the real lung. This is because the surface of the airways (and especially the alveoli) of the actual lung is nonsmooth and folded to enhance the lateral surface area. An area correction factor [based on the experimental measurements of Mercer et al. (1994)] of 1.22–1.58 needs to be used for this PNNL extended Q3D lung (in the computational solver), to correct the lateral areas (for particle absorption simulations, in the E–E mode). The area correction factor needs to be used for the different deposition methods (impaction, sedimentation, and diffusion). This is, however, not the crux of the paper, and hence will not be explained further in this paper.
Figure 12:
The PNNL Q3D lung, enclosed in the lung lobes. Case (a): the original truncated Q3D lung, enclosed in the lobes; case (b): the extended Q3D lung, enclosed in the lobes.
Figure 13 shows the complete whole lung constructed out of the PNNL geometry, with TB extension and alveolar trumpet–sacs. It is colored by pressure, for an inlet flow rate of 5 L/min (outlets are once again, unrealistically opened, for the sake of numerical simplicity). The FRC of the whole PNNL Q3D lung comes to around 2600 cc. The individual alveolar volumes and the lateral surface areas are provided in Table 2. The sac–trumpets are constructed to match the physiological generation-specific alveolar volumes. The actual alveolar lateral areas are also provided in the same table. As with the Zygote model, a scaling factor is needed for the lateral surface areas during the deposition simulations. Similarly, a significantly large area scaling factor is needed (to be used in the computational solver), as shown in Table 2, especially in the last alveolar generation.
Figure 13:
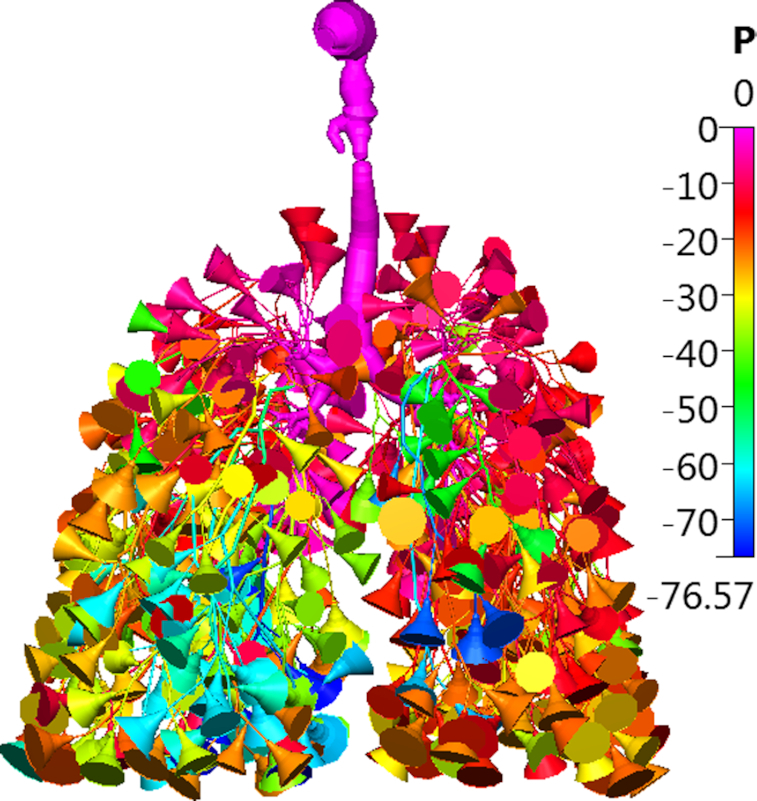
The PNNL whole lung (mouth + TB + sac–trumpet Q3D lung) model. The entire whole lung, colored by pressure, for an inhalation flow rate of 5 L/min.
Table 2:
Alveolar volumes and lateral surface areas, for the real lung and for the PNNL Q3D lung (FRC ∼ 2600 cc).
| Generation | Volume (cc) | Real lung lateral surface area (cm2) | Q3D lung lateral surface area (cm2) | Lateral area scaling factor |
|---|---|---|---|---|
| 16 | 9.209 | 885.9 | 140.6 | 6.30 |
| 17 | 14.154 | 1469.1 | 162.1 | 9.06 |
| 18 | 19.161 | 2117.5 | 166.6 | 12.71 |
| 19 | 30.554 | 3526 | 223.6 | 15.77 |
| 20 | 51.198 | 6033 | 300.7 | 14.9 |
| 21 | 92.178 | 10860 | 421.6 | 20.06 |
| 22 | 159.187 | 19205 | 623.3 | 30.81 |
| 23 | 295.936 | 35714 | 1004 | 35.57 |
| 24 | 1775.01 | 420323 | 3649 | 115 |
The overall dimension-based metrics for the Zygote TB lung and the PNNL TB lung are as follows:
Total FRC in the TB section (excluding the mouth, nasal, oral, laryngeal, and pharyngeal sections) is around 165 cc for the Zygote TB Q3D lung.
The FRC in the TB section (excluding the mouth, nasal, oral, laryngeal, and pharyngeal sections) is around 138 cc for the PNNL TB Q3D model.
The FRC in the TB section (excluding the mouth, nasal, oral, laryngeal, and pharyngeal sections) is around 155 cc for the Weibel model (Weibel, 1991).
The minimum and maximum diameters for the extended part in this Zygote Q3D TB lung are 0.0712 and 0.366 cm, respectively.
The volume of the original Zygote lung corresponds to that of the Weibel lung model, ending at around generation 8–9. The Weibel lung’s minimum and maximum diameters from around 8–9th gen to the TB limit (15th gen) are 0.049 and 0.26–0.21 cm, respectively. This is in the same range as the minimum and maximum diameters for the extended part in this Zygote Q3D TB lung.
The minimum and maximum diameters for the extended part in the PNNL TB Q3D lung are 0.0688 and 0.296 cm, respectively.
The volume of the original PNNL lung corresponds to that of the Weibel lung model, ending at around generation 7. The Weibel lung’s minimum and maximum diameters from around the 7th generation to the TB limit (15th gen) are 0.049 and 0.306 cm, respectively. This is in good accordance with the minimum and maximum diameters for the extended part on this PNNL Q3D TB lung.
For the sake of visual comparison, we present the extended Zygote Q3D lung, colored by the generation number in Fig. 14, and the extended PNNL Q3D lung, colored by the original airways and the newly created airways in Fig. 15.
Figure 14:
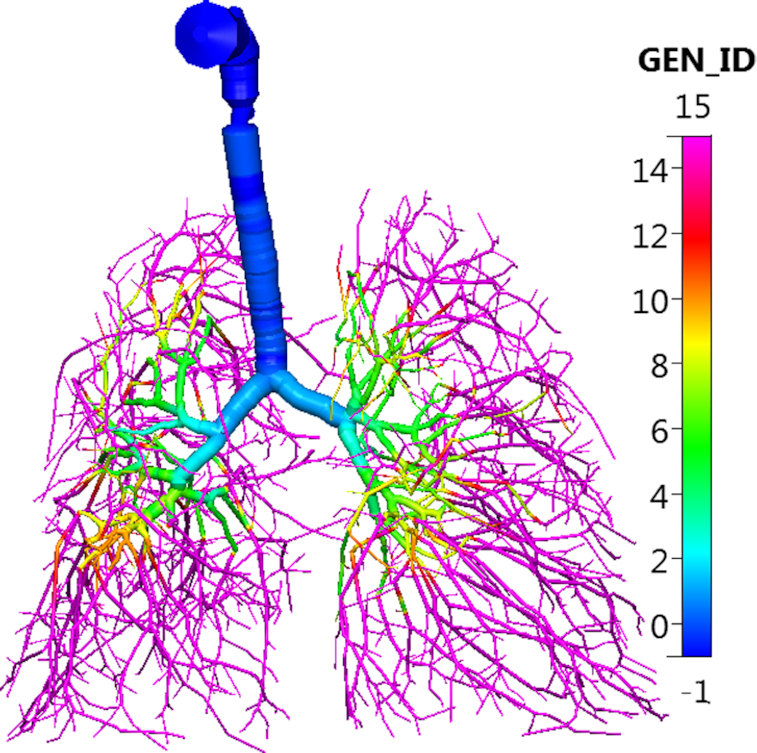
The extended Zygote Q3D lung, colored by the generation index. NOPL is set at a value of –1, the trachea is set at a value of 0, the first generation is set at a value of 1, and so on. The extended airways are set at a value of 15.
Figure 15:
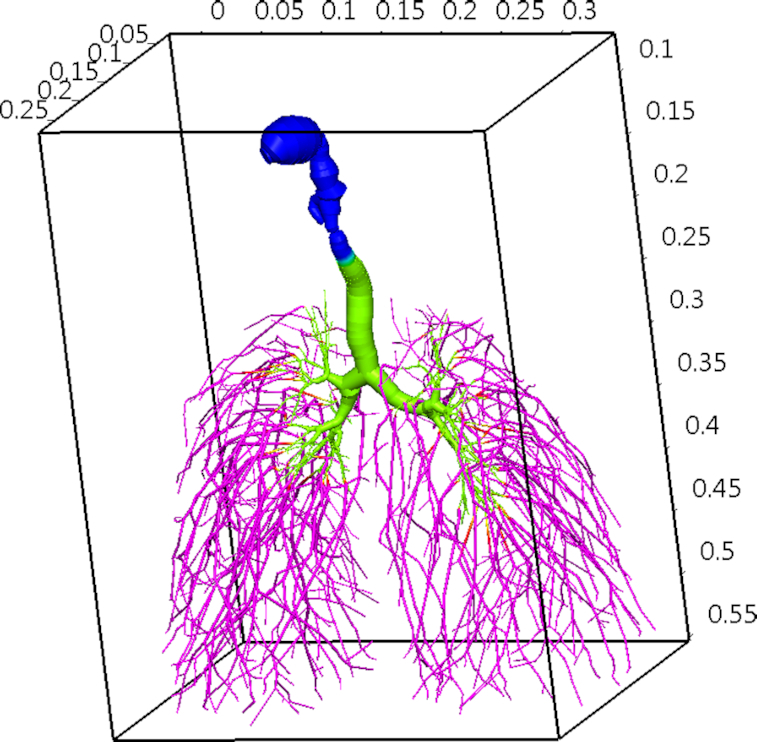
The extended PNNL Q3D lung, colored by the airway index. NOPL is set at a value of 1, the original airways (i.e. the ones from the truncated surface geometry) are set at a value of 2, and the newly extended airways are set at a value of 3.
5. Conclusions
In this research study, the authors have developed and implemented a two-step approach to create a full lung airway–alveolar model: (i) the modified CCO approach to extend the existing lung airways filling the lung lobe spaces and (ii) the sac–trumpet model at the end of each TB outlet to model the alveoli. The modified CCO approach was able to ensure that: (i) the new branches do not emanate from the original Q3D lung segments; (ii) no branches are emanating out of the nodes that are in close proximity with each other; and (iii) uniform perfusion of the extended airways into the given lung lobes. While this approach can extend the airways to the required volume, it cannot match the lateral surface areas of the real lung. This is because the surface of the airways (and especially the alveoli) of the actual lung is nonsmooth and folded to enhance the lateral surface area. In the test case, we needed an area correction factor of ∼2.0 inside the computational solver, to correct the lateral areas (for particle absorption simulations).
We have constructed sac–trumpet-like control volumes at the end of the TB exits. This involved the addition of control volumes at the end of each of the TB Q3D lung’s outlets while trying to match the volume in each alveolar generation (16–24) with that of the real lung. We reiterate that area correction factors were needed for each alveolar generation. As expected, these correction factors are significantly larger than the TB correction factor, since the surface of the alveoli in the actual lung is less smooth and more folded than the TB airways. The extension process and the alveolar trumpet–sac creation were demonstrated for the Zygote and PNNL lung models.
This modeling approach is one of the first efforts to create a 3D, spatially heterogeneous, lung-lobe-filling whole lung model. This Q3D whole lung builds on the 1D trumpet model of Yu (1978) (wherein the airways are strictly 1D, thus making the lung resemble a trumpet), the WLAM model (which resembles an expanding 1D conduit), and CFDRC’s previous MASS model (which did not have specific alveolar generation resolution). The 3D variation is physiologically and anatomically consistent, can provide the generation-specific deposition due to the deposition methods (diffusion, impaction in the bifurcations, and the gravitational forces), can account for the inflating/deflating alveoli (during forced inhalation/exhalation), and can be easily adapted for diseased lung sections.
As explained in Section 3.1.1, the original CCO algorithm extends the tree from the interior of the root node. This was observed in the meshes extended by Karch et al. (1999). This contradicts the CT scans, which would have captured the branches emanating from the larger root branches. The modified CCO algorithm is definitely more appropriate for other real-life applications simulated by Karch et al. (1999), including the arterial-to-prearteriolar generation and the tree generation in the myocardium tissue.
The modified CCO approach assumes equalization of the outlet pressures, as the objective function. In some cases, the lung might be subdivided into five sublobes, and there might be deviations in the outlet pressures in these sublobes. The current modified CCO approach would not be valid for the above scenario, and significant adaption needs to be done to create a tree network, which has the user-defined outlet pressures. This is the main drawback of this approach.
Thus, this Q3D whole lung model can serve as the starting step for conducting whole lung multiple breathing cycle particle/drug transport and deposition simulations, and thus eventually help in optimizing the drug delivery to the lower lung and the alveoli. Some of the local sections of this whole lung can be modified (by shrinking the radius or changing the alveolar capacitances), thereby mimicking the effects of the diseased lung. These will be demonstrated in future publications.
6. Disclaimer
Views expressed here do not necessarily reflect the official policies of FDA, nor does any mention of trade names, commercial practices, or organizations imply endorsement by the United States Government.
ACKNOWLEDGEMENTS
The authors gratefully acknowledge the funding support from the FDA (contract number: HHSF223201810182C) toward this research, in addition to the guidance and feedback from the FDA-CDER team.
The authors gratefully acknowledge the funding support from the NIH (grant 1R43GM108380‐01) toward this research.
Contributor Information
Ravishekar (Ravi) Kannan, Email: ravi.kannan@cfdrc.com, CFD Research Corporation, 701 McMillian Way NW, Suite D, Huntsville, AL 35806, USA.
Narender Singh, CFD Research Corporation, 701 McMillian Way NW, Suite D, Huntsville, AL 35806, USA.
Andrzej Przekwas, CFD Research Corporation, 701 McMillian Way NW, Suite D, Huntsville, AL 35806, USA.
Xianlian Alex Zhou, New Jersey Institute of Technology, 323 Martin Luther King Blvd, 323 Martin Luther King Blvd, Newark, NJ 07102, USA.
Ross Walenga, Center for Drug Evaluation Research, United States Food and Drug Administration, Silver Spring, MD 20993, USA.
Andrew Babiskin, Center for Drug Evaluation Research, United States Food and Drug Administration, Silver Spring, MD 20993, USA.
Conflict of interest statement
CFDRC is interested in developing respiratory models based on this research.
References
- Asgharian B., Hofmann W., Bergmann R. (2001). Particle deposition in a multiple-path model of the human lung. Aerosol Science and Technology, 34(4), 332–339. [Google Scholar]
- Au O. K. C., Tai C. L., Chu H. K. (2008). Cohen-Or D and Lee TY. Skeleton extraction by mesh contraction. ACM Transactions on Graphics, 27, 3. [Google Scholar]
- Belhocine A. (2016). Numerical study of heat transfer in fully developed laminar flow inside a circular tube. International Journal of Advanced Manufacturing Technology, 85(9), 2681–2692. [Google Scholar]
- Belhocine A. (2017). An approximate numerical solution to the Graetz problem with constant wall temperature. International Journal of Computing Science and Mathematics, 8(1), 35–51. [Google Scholar]
- Belhocine A., Oday I. A. (2015). Similarity and numerical analysis of the generalized Levèque problem to predict the thermal boundary layer. International Journal on Interactive Design and Manufacturing, 12(3), 235–245. [Google Scholar]
- Belhocine A., Oday I. A. (2019). Numerical simulation of thermally developing turbulent flow through a cylindrical tube. International Journal of Advanced Manufacturing Technology, 102(5–8), 2001–2012. [Google Scholar]
- Belhocine A., Oday I. A. (2020). A thermomechanical model for the analysis of disc brake using the finite element method in frictional contact. Journal of Thermal Stresses, 43(3), 305–320. [Google Scholar]
- Belhocine A., Omar W. C. W. (2017). An analytical method for solving exact solutions of the convective heat transfer in fully developed laminar flow through a circular tube. Heat Transfer Asian Research, 46(8), 1342–1353. [Google Scholar]
- Belhocine A., Omar W. C. W. (2018). Computational fluid dynamics (CFD) analysis and numerical aerodynamic investigations of automotive disc brake rotor. Australian Journal of Mechanical Engineering, 16(3), 188–205. [Google Scholar]
- Briley W., McDonald H. (1984). Three-dimensional viscous flows with large secondary velocity. Journal of Fluid Mechanics, 144, 47–77. [Google Scholar]
- Ding H., Jiang Y., Furmanczyk M., Przekwas A., Reinhardt J. M. (2005). Simulation of human lung respiration process using 3-D CFD with macro air sac system model. In WMC 2005 15th International Conference on Health Sciences Simulation. [Google Scholar]
- Frederix E. M. A. (2016). Eulerian modeling of aerosol dynamics. Ph.D. Thesis, University of Twente. [Google Scholar]
- Frederix E. M. A., Kuczaj A. K., Nordlund M., Veldman A. E. P., Geurts B. J. (2017). Eulerian modeling of inertial and diffusional aerosol deposition in bent pipes. Computers and Fluids, 159, 217–231. [Google Scholar]
- https://www.zygote.com/, (Accessed 14 February). [Google Scholar]
- ICRP Publication 66 , (1994). Human respiratory tract model for radiological protection, Annals of the ICRP. Vol. 24, Pergamon. [Google Scholar]
- Kannan R., Guo P., Przekwas A J. (2016). Particle transport in the human respiratory tract: Formulation of a nodal inverse distance weighted Euler-Lagrangian transport and implementation of the Wind-Kessel algorithm for an oral delivery. International Journal for Numerical Methods in Biomedical Engineering, 32(6), e02746. 10.1002/cnm.2746. [DOI] [PubMed] [Google Scholar]
- Kannan R., Chen Z. J., Singh N., Przekwas A., Delvadia R., Tian G., Walenga R. (2017a). A quasi-3D wire approach to model pulmonary airflow in human airways. International Journal for Numerical Methods in Biomedical Engineering, 33(7), e2838. 10.1002/cnm.2838. [DOI] [PubMed] [Google Scholar]
- Kannan R., Singh N., Przekwas A., Delvadia R., Tian G., Walenga R. (2017b). Pharmaceutical aerosols deposition patterns from a dry powder inhaler: Euler Lagrangian prediction and validation. Medical Engineering and Physics, 42, 35–47.. 10.1016/j.medengphy.2016.11.007. [DOI] [PubMed] [Google Scholar]
- Kannan R., Singh N., Przekwas A. (2018). A compartment-quasi3D multiscale approach for drug absorption, transport, and retention in the human lungs. International Journal for Numerical Methods in Biomedical Engineering, 34(5), e2955. 10.1002/cnm.2955. [DOI] [PMC free article] [PubMed] [Google Scholar]
- Kannan R., Singh N., Przekwas A. (2018). A quasi-3D compartmental multi-scale approach to detect and quantify diseased regional lung constriction using spirometry data. International Journal for Numerical Methods in Biomedical Engineering, 34(5), e2973. 10.1002/cnm.2973. [DOI] [PMC free article] [PubMed] [Google Scholar]
- Kannan R., Andrzej P. (2020). A multiscale absorption and transit model for oral drug delivery: Formulation and applications during fasting conditions. International Journal for Numerical Methods in Biomedical Engineering, 36(3), e3317. [DOI] [PubMed] [Google Scholar]
- Kannan R., Przekwas A. (2020). A multiscale absorption and transit model for oral delivery of hydroxychloroquine: Pharmacokinetic modeling and intestinal concentration prediction to assess toxicity and drug-induced damage in healthy subjects. International Journal for Numerical Methods in Biomedical Engineering, 36(12), e3403. [DOI] [PubMed] [Google Scholar]
- Kannan R., Chen Z. J., Andrzej P., Segars P., Martin F., Kuczaj A. K., Hoeng J. (2020). Anthropometry-based generation of personalized and population-specific human airway models. International Journal for Numerical Methods in Biomedical Engineering, 36(5), e3324. [DOI] [PubMed] [Google Scholar]
- Karch R., Neumann F., Neumann M., Schreiner W. (1999). A three-dimensional model for arterial tree representation, generated by constrained constructive optimization. Computers in Biology and Medicine, 29, 19–38. [DOI] [PubMed] [Google Scholar]
- Kolanjiyil A. V., Kleinstreuer C. (2013). Nanoparticle mass transfer from lung airways to systemic regions—Part I: Whole-lung aerosol dynamics. Journal of Biomechanical Engineering, 35, 121003–1. [DOI] [PubMed] [Google Scholar]
- Kolanjiyil A. V., Kleinstreuer C. (2016). Computationally efficient analysis of particle transport and deposition in a human whole-lung-airway model. Part I: Theory and model validation. Computers in Biology and Medicine, 79, 193–204. [DOI] [PubMed] [Google Scholar]
- Mercer R. R., Russell M. L., Roggli V. L., Crapo J. D. (1994). Cell number and distribution in human and rat airways. American Journal of Respiratory Cell and Molecular Biology, 10(6), 613–624. [DOI] [PubMed] [Google Scholar]
- NCRP Report , (1997). Deposition, retention and dosimetry of inhaled radioactive substances. National Council on Radiation Protection and Measurements. [Google Scholar]
- Pichelin M., Caillibotte G., Katz I., Martonen T. (2012). Categorization of lung morphology based on FRC and height: Computer simulations of aerosol deposition. Aerosol Science and Technology, 46, 70–81. [Google Scholar]
- Roan E., Christopher M. (2011). What do we know about mechanical strain in lung alveoli?. American Journal of Physiology. Lung Cellular and Molecular Physiology, 301(5), L625–L635. [DOI] [PMC free article] [PubMed] [Google Scholar]
- Sauret V., Halson P. M., Brown I. W., Fleming J. S., Bailey A. G. (2002). Study of the three-dimensional geometry of the central conducting airways in man using computed tomographic (CT) images. Journal of Anatomy, 200(2), 123–134. [DOI] [PMC free article] [PubMed] [Google Scholar]
- Schreiner W. (1993). Computer generation of complex arterial tree models. Journal of Biomedical Engineering, 15, 148–149. [DOI] [PubMed] [Google Scholar]
- Schum M., Yeh H. C. (1980). Theoretical evaluation of aerosol deposition in anatomical models of mammalian lung airways. Bulletin of Mathematical Biology, 42, 1–15. [DOI] [PubMed] [Google Scholar]
- Tawhai M. H., Lin C. L. (2010). Image-based modeling of lung structure and function. JMRI, 32(6), 1421–1431. [DOI] [PMC free article] [PubMed] [Google Scholar]
- Tian G., Hindle M., Lee S., Longest P. (2015). Validating CFD predictions of pharmaceutical aerosol deposition with in vivo data. Pharmaceutical Research, 32, 3170–3187.. 10.1007/s11095-015-1695-1. [DOI] [PMC free article] [PubMed] [Google Scholar]
- Tian G., Longest P. W., Su G., Walenga R. L., Hindle M. (2011). Development of a stochastic individual path (SIP) model for predicting the tracheobronchial deposition of pharmaceutical aerosols: Effects of transient inhalation and sampling the airways. Journal of Aerosol Science, 42(11), 781–799. [Google Scholar]
- Van Beek J., Roger S. A., Bassingthwaighte J. B. (1989). Regional myocardial flow heterogeneity explained with fractal networks. American Journal of Physiology, 257, H1670–H1680.(Heart Circ. Physiol. 26). [DOI] [PMC free article] [PubMed] [Google Scholar]
- Weibel E. (1991). Design of airways and blood vessels considered as branching trees. The Lung: Scientific Foundations, 1, 711–720. [Google Scholar]
- Yeh H. C., Schum G. M. (1980). Models of human lung airways and their application to inhaled particle deposition. Bulletin of Mathematical Biology, 42, 461–480. [DOI] [PubMed] [Google Scholar]
- Yin Y., Choi J., Hoffman E., Tawhai M. H., Lin C. L. (2013). A multiscale MDCT image-based breathing lung model with time-varying regional ventilation. Journal of Computational Physics, 244, 168–192. [DOI] [PMC free article] [PubMed] [Google Scholar]
- Yu C. P. (1978). Exact analysis of aerosol deposition during steady breathing. Powder Technology, 21, 55–62. [Google Scholar]


