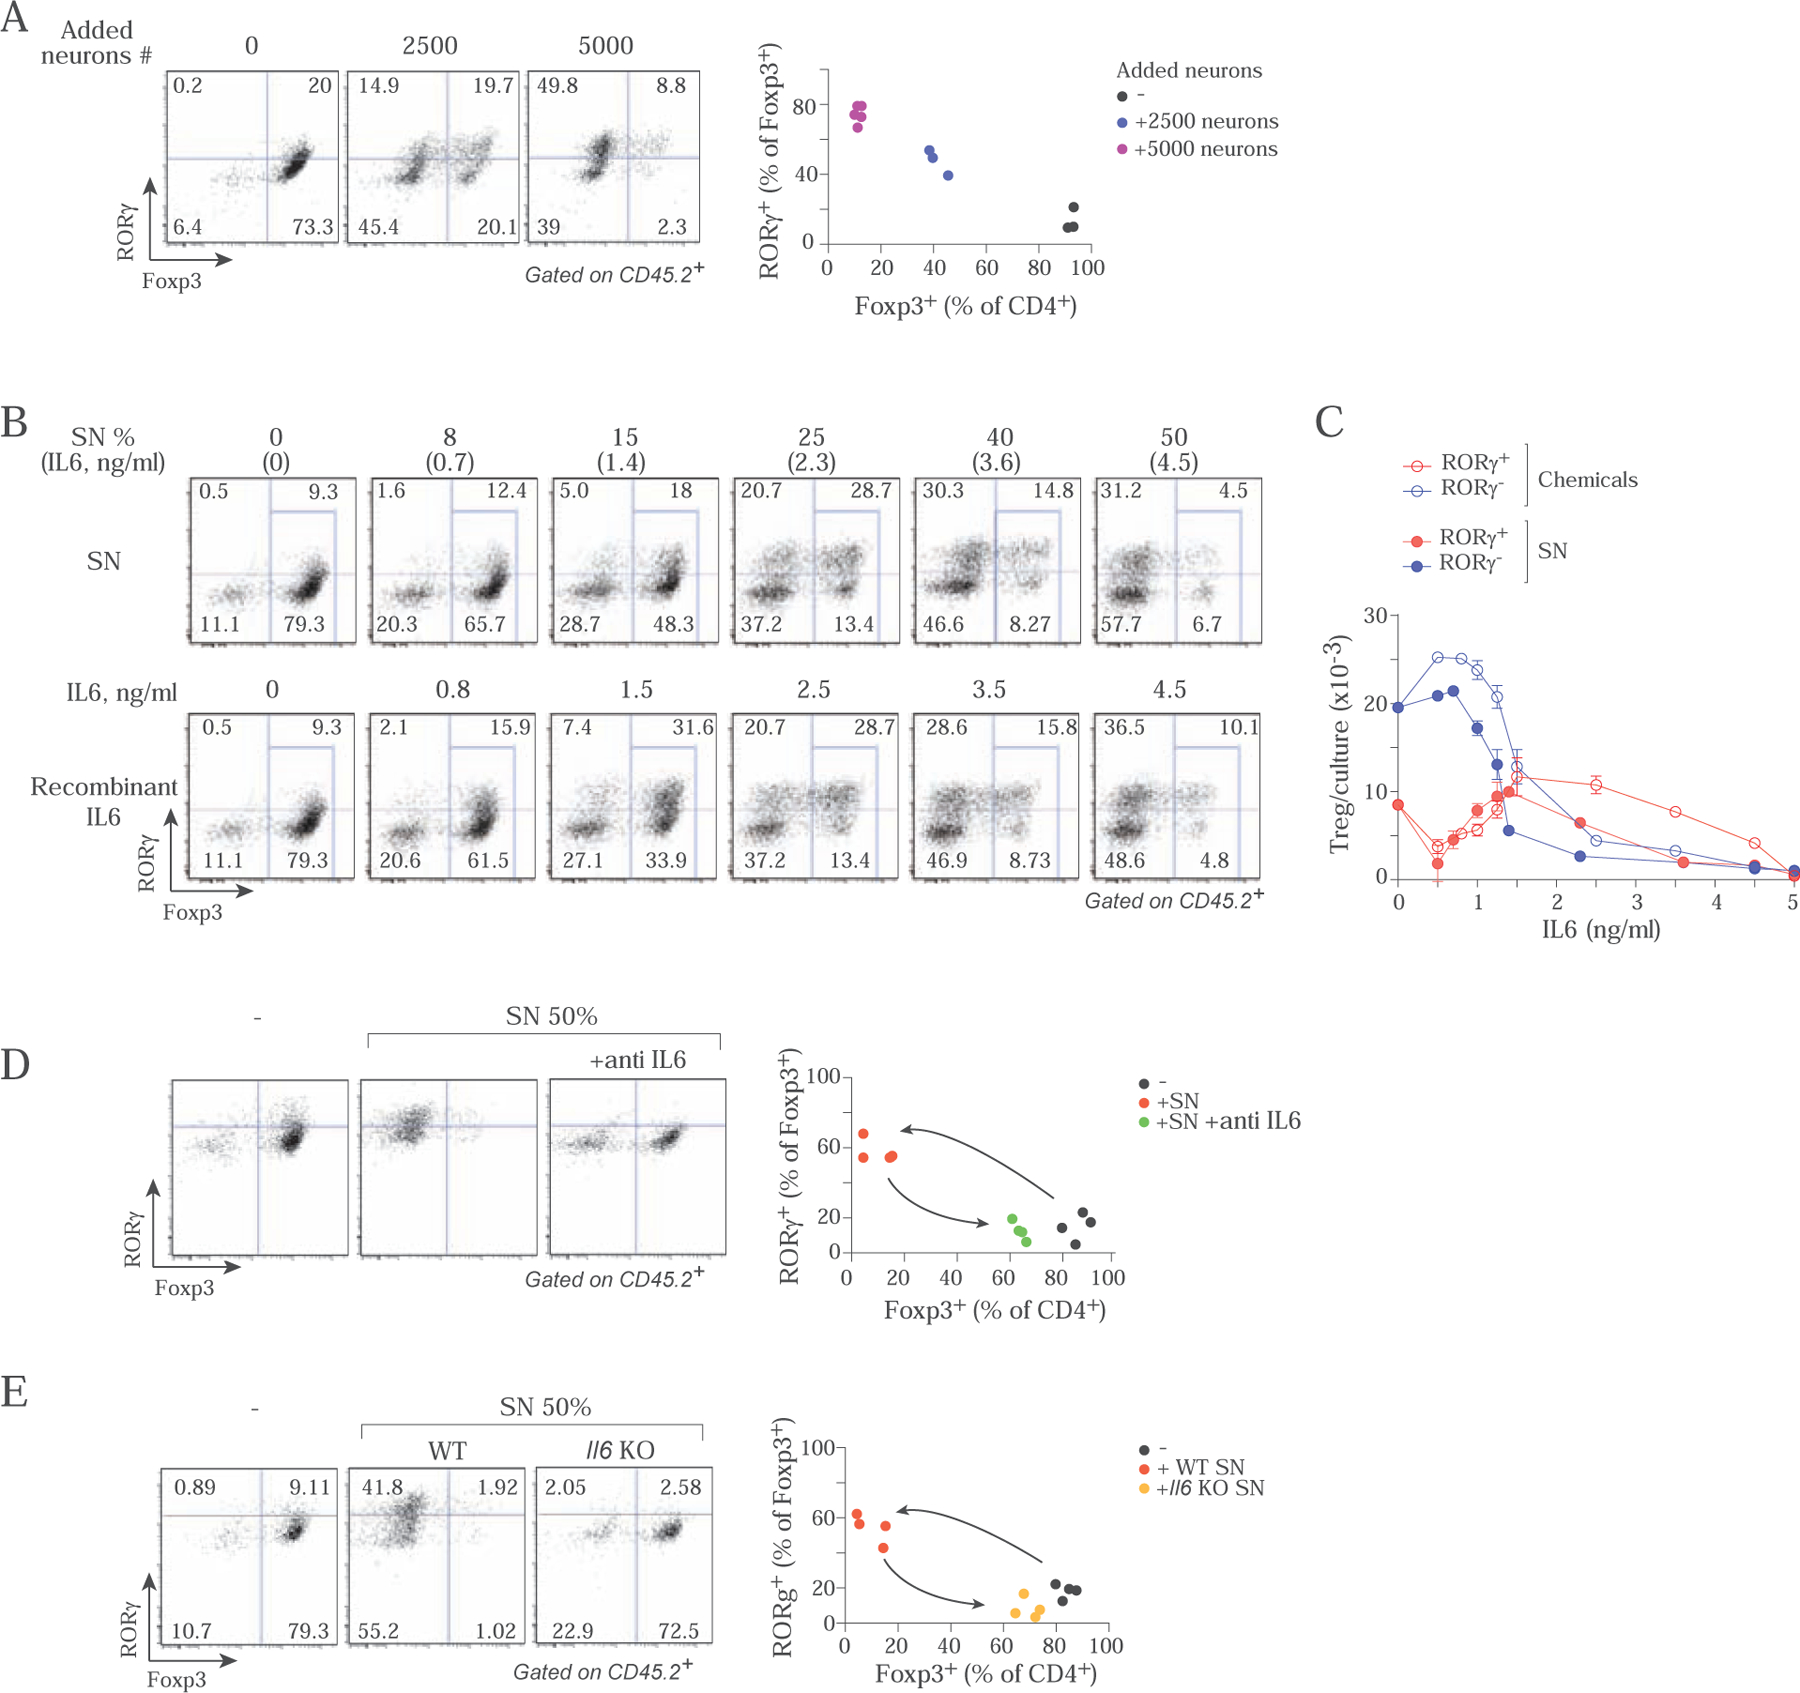
Figure 5. Enteric neurons modulate RORγ+ Treg induction through IL6.

A. Representative flow cytometry profiles after 72 hrs of iTreg cultures (soluble αCD3 + splenic APCs) stained for FoxP3 and RORγ. Each dot is an independent culture. Plot at right compiled from 3 independent experiments.
B. Comparison of MMP neuron SN and recombinant IL6. Top panels: iTreg cultures (soluble αCD3 + splenic APCs) supplemented with titrated neuronal SN in which IL6 concentration had been pre-determined by ELISA. Bottom panels: parallel cultures supplemented with matching concentrations of rIL6 (after ELISA determination). Representative of two independent experiments.
C. Data from B, plotting numbers of RORγ+ and RORγ- Treg cells in iTreg cultures (soluble αCD3 + splenic APCs) supplemented with titrated amounts of neuron supernatant or recombinant IL6. Each dot is the average value of 2 or more independent preparations, plot compiled from 2 independent experiments.
D. Representative flow cytometry profiles of iTreg cultures (soluble αCD3 + splenic APCs) supplemented with MMP neuronal SN and anti-IL6 (Each dot is an independent culture, compiled data from 3 independent experiments plotted at right).
E. As D, where the neuron culture SN was from Il6-deficient mice or control littermates. (Compiled data from 3 independent experiments plotted at right).
