

Abstract
Purpose:
Automated tools can help identify radiation treatment plans of unacceptable quality. To this end, we developed a quality verification technique to automatically verify the clinical acceptability of beam apertures for 4-field box treatments of patients with cervical cancer. By comparing the beam apertures to be used for treatment with a secondary set of beam apertures developed automatically, this quality verification technique can flag beam apertures that may need to be edited to be acceptable for treatment.
Methods and Materials:
The automated methodology for creating verification beam apertures uses a deep learning model trained on beam apertures and digitally reconstructed radiographs from 255 clinically acceptable planned treatments (as rated by physicians). These verification apertures were then compared with the treatment apertures using spatial comparison metrics to detect unacceptable treatment apertures. We tested the quality verification technique on beam apertures from 80 treatment plans. Each plan was rated by physicians, where 57 were rated clinically acceptable and 23 were rated clinically unacceptable.
Results:
Using various comparison metrics (the mean surface distance, Hausdorff distance, and Dice similarity coefficient) for the 2 sets of beam apertures, we found that treatment beam apertures rated acceptable had significantly better agreement with the verification beam apertures than those rated unacceptable (P < .01). Upon receiver operating characteristic analysis, we found the area under the curve for all metrics to be 0.89 to 0.95, which demonstrated the high sensitivity and specificity of our quality verification technique.
Conclusions:
We found that our technique of automatically verifying the beam aperture is an effective tool for flagging potentially unacceptable beam apertures during the treatment plan review process. Accordingly, we will clinically deploy this quality verification technique as part of a fully automated treatment planning tool and automated plan quality assurance program.
Introduction
The treatment planning process is a primary source of radiation therapy incidents.1,2 For this reason, treatment planning is the focus of many quality assurance (QA) tasks, including physicist and physician reviews of treatment plans. Reviewing the treatment plan is a time-consuming task, and although it is considered one of the most effective forms of QA, it still does not reliably catch all errors that occur in treatment planning.3–5 Automating the plan review process could improve the effectiveness of error detection by drawing reviewers’ attention to aspects of the treatment plan that are incorrect or suboptimal and sparing them from reviewing every minute plan detail.
Many radiation therapy groups have already automated various components of the plan review process. Some automation techniques verify the technical accuracy of the plans (eg, the consistency of the prescription, correct settings for the dose calculation, and completeness of physician contouring),6–8 whereas other techniques verify the quality of the treatment plans by comparing them to physician-specified plan quality objectives, estimated achievable dose metrics, or other similar plans.9–13 The development of techniques to verify plan quality can be more subjective and difficult than the development of techniques to verify the technical accuracy of plans, and most work to date has focused on the quantitative dose metrics involved in assessing plan quality for advanced treatments, such as intensity modulated radiation therapy.9–13 However, many clinics rely heavily on simpler treatment techniques. For example, radiation therapy treatment for patients with cervical cancer can be delivered through the use of a 4-field box with beam apertures based on the bony pelvic anatomy. This treatment planning technique is common in resource-constrained settings in which soft-tissue contouring is not available owing to limitations of staff time or availability of computed tomography (CT) scans for 3-dimensional treatment planning.14,15 The International Atomic Energy Agency and American Society of Clinical Oncology recommend that resource-constrained clinics use it to deliver radiation therapy to patients with cervical cancer.14,15
In this work, we propose a novel technique for the automatic verification of the plan quality of radiation treatments for cervical cancer. This proposed technique detects clinically unacceptable beam apertures for 4-field box treatments by comparing the planned treatment beam apertures to a set of verification beam apertures automatically created for the same patient using a novel technique. This concept is similar to the approach of verifying dose calculation using a secondary, independent algorithm to calculate dose for a given patient’s treatment plan. The rationale for using this approach was that if 1 technique of creating beam apertures was susceptible to a certain kind of error, an independent technique using different methods may not be susceptible to that same kind of error.
In this paper, we present our new technique for automatically verifying the quality of beam apertures. This quality verification technique could be applied to beam apertures created manually, such as for clinical trial quality assurance, or those created using automated approaches. In this work, we describe its application in plans created automatically by the Radiation Planning Assistant, a recently developed, fully automated treatment planning tool intended for use in resource-constrained settings.16,17 Because staff is one of the most limited resources in such clinics,18 any improvement in the efficiency and effectiveness of QA tasks may have a substantial clinical effect.
Methods and Materials
To detect clinically unacceptable treatment beam apertures, this technique uses an independent, fully automated technique to generate verification beam apertures for the patient’s treatment planning CT scan. This secondary set of beam apertures is used to verify the treatment apertures via comparing the spatial differences in the 2 sets of beam apertures (treatment and verification). Poor agreement between the treatment and verification beam apertures indicates that the treatment beam apertures are potentially clinically unacceptable and can be used to alert the physician that the beam apertures may be in need of editing. The next 3 sections describe (1) the ground truth data set used in this study (treatment beam apertures), (2) the automated technique for creating the verification beam apertures using deep learning, and (3) the comparison technique used to detect when the treatment and verification beam apertures were not in agreement. All patient data used in this study were handled in accordance with an approved institutional review board protocol.
Treatment beam apertures: Ground truth
The ground truth treatment plans used in this study were created previously as part of the development and testing of an automated treatment planning tool, the Radiation Planning Assistant, which designs 4-field box treatments for locally advanced cervical cancer with beam apertures based on a patient’s bony anatomy. The automation technique for planning the treatments uses a different algorithm than used in this work for the quality verification (described in the next section). The planning automation algorithm and its validation have been previously described elsewhere.16,17 In brief, the input to the automated planning tool is a treatment planning CT scan. To create the beam apertures, the patient’s bony anatomy is automatically segmented using a technique that employs deformable registration of multiple atlases.19 Then, the bony anatomy is projected into the beam’s-eye-view for each of the 4 fields, and the beam apertures are determined based on these projections. Next, the beam apertures are converted into jaw and multileaf collimator positions specific to the type of linear accelerator and multileaf collimator to be used for treatment. In testing the final version of this automated planning tool, 89% of the beam apertures were found to be clinically acceptable.16 During this prior work, over 400 treatment plans were created and reviewed for clinical acceptability by expert radiation oncologists.16 A subset of these plans serve as the ground truth treatment beam apertures that were subjected to the automated quality verification technique presented in this current study. A different subset of these clinically acceptable plans was also used in training of the deep learning model described in the next section.
Verification beam apertures: A novel deep learning application
For the verification technique developed in this work, we used the DeepLabv3 + deep learning architecture20 to automatically predict the shape of the beam apertures from the digitally reconstructed radiographs (DRRs) for each beam angle. The inputs to the model training were DRRs with corresponding beam apertures. The resulting trained model takes DRRs as input and outputs a prediction of the beam aperture shape. Essentially, this was a 2-dimensional segmentation task in which the deep learning model was trained to learn which parts of the DRRs should be included in the beam apertures on the basis of the visible anatomy.21 The deep learning model was trained and tested on the beam apertures and DRRs from 310 clinically acceptable 4-field box treatment plans (255 used for training, 55 held-out for final testing). The plans used for training and testing of the deep learning model were from those created in our previous work and rated as clinically acceptable.16
During training, 3-fold cross-validation (170 train and 85 cross-validation out of 255) was used to fine-tune the model parameters (learning rate, decay, etc). Based on our previous work,22 we have found that using 3-fold cross validation on the training set allows for more robust selection of hyperparameters when dealing with limited imaging data. This is consistent with other works in the field of statistical learning where nested cross-validation approaches have been shown to produce unbiased estimators of the true classifier error.23
After the optimal parameters were identified during cross-validation, the model was trained on the complete training set (255 CT scans, split into 230 for training and 25 to evaluate the model during training) for 35 epochs. The number of epochs was chosen conservatively to allow for the network to learn features on the input images. Early stopping was used during parameter optimization and final training of the model. All models stopped training below the 35-epoch mark.
A single model was trained to segment all 4 beams (anteroposterior [AP], posteroanterior [PA], right lateral [RT], and left lateral [LT]) independently. The model was trained with an equal distribution of each beam’s DRRs, and the architecture was designed such that each DRR view (either AP, PA, RT, or LT) was fed individually (single-view input) into the model to obtain its respective beam apertures. To augment the input data, we applied random vertical and horizontal shifts of ± 5 mm to the input images. Rotational augmentations were investigated but were found to be inappropriate owing to the nature of the beam aperture shape, where the edges defined by the jaws were straight vertical and horizontal lines, rather than diagonal, because the collimator was not rotated from zero degrees.
After training, the performance of the deep learning model was assessed by comparing the predicted beam apertures with the ground truth beam apertures for the 55 test patient CT scans. For this assessment, the predicted beam apertures were postprocessed before comparison to impose more typical beam aperture qualities, such as straight edges at the field borders to replicate the jaw edges. Averaged across all 4 postprocessed beams for all patients, the mean surface distance (MSD) was 1.6 mm (standard deviation [SD] = 1.0 mm), and the Hausdorff distance (HD) was 6.6 mm (SD = 4.8 mm) (unpublished data).
Comparison technique: Detecting unacceptable apertures
To detect whether the treatment beam apertures were clinically acceptable, we compared them quantitatively to the verification beam apertures. In this comparison we used the raw verification beam apertures (the predictions from the deep learning model before postprocessing). We quantitatively assessed the agreement between the beam apertures using the following spatial agreement and overlap metrics24:
MSD: the average minimum Euclidean distance between the points that define the edges of the 2 beam apertures. A larger MSD indicates worse agreement.
HD: the maximum of all minimum Euclidean distances between the points that define the edges of the 2 beam apertures. A larger HD indicates worse agreement.
Dice similarity coefficient (DSC): the overlap of the beam apertures as measured by the ratio of their intersection to their mean area. A DSC value of 1 indicates perfect agreement, whereas 0 indicates no agreement.
We tested this technique on 80 treatment plans (320 total treatment beam apertures), including those rated both clinically acceptable (n = 228 beam apertures) and clinically unacceptable (n = 92 beam apertures). These plans were from the ground truth data set but were separate from those used to train and test the deep learning model.
To determine whether the beam apertures for the clinically acceptable plans had better agreement with the verification beam apertures than those for the clinically unacceptable plans, we compared the values of the agreement metrics using a 1-sided t test. A P value of .05 was used to determine statistical significance. We then used a receiver operating characteristic (ROC) analysis to quantify the sensitivity and specificity with which we could detect unacceptable beam apertures. In this analysis, a true positive result corresponded to beam apertures that were correctly flagged as unacceptable for treatment.
Results
Figure 1, in which each panel corresponds to a different patient, shows examples of the treatment beam apertures and verification beam apertures (without postprocessing). Panel A shows a true negative case in which the 2 sets of beam apertures agreed, and the treatment beam apertures were clinically acceptable. Panels B and C show true positive cases in which the 2 sets of beam apertures disagreed, and the treatment beam apertures were clinically unacceptable. In panel C, neither set of beam apertures was clinically acceptable. Each set of beam apertures was created using independent methodologies that failed in different ways, and the disparate failures successfully flagged the unacceptable beam apertures.
Figure 1.
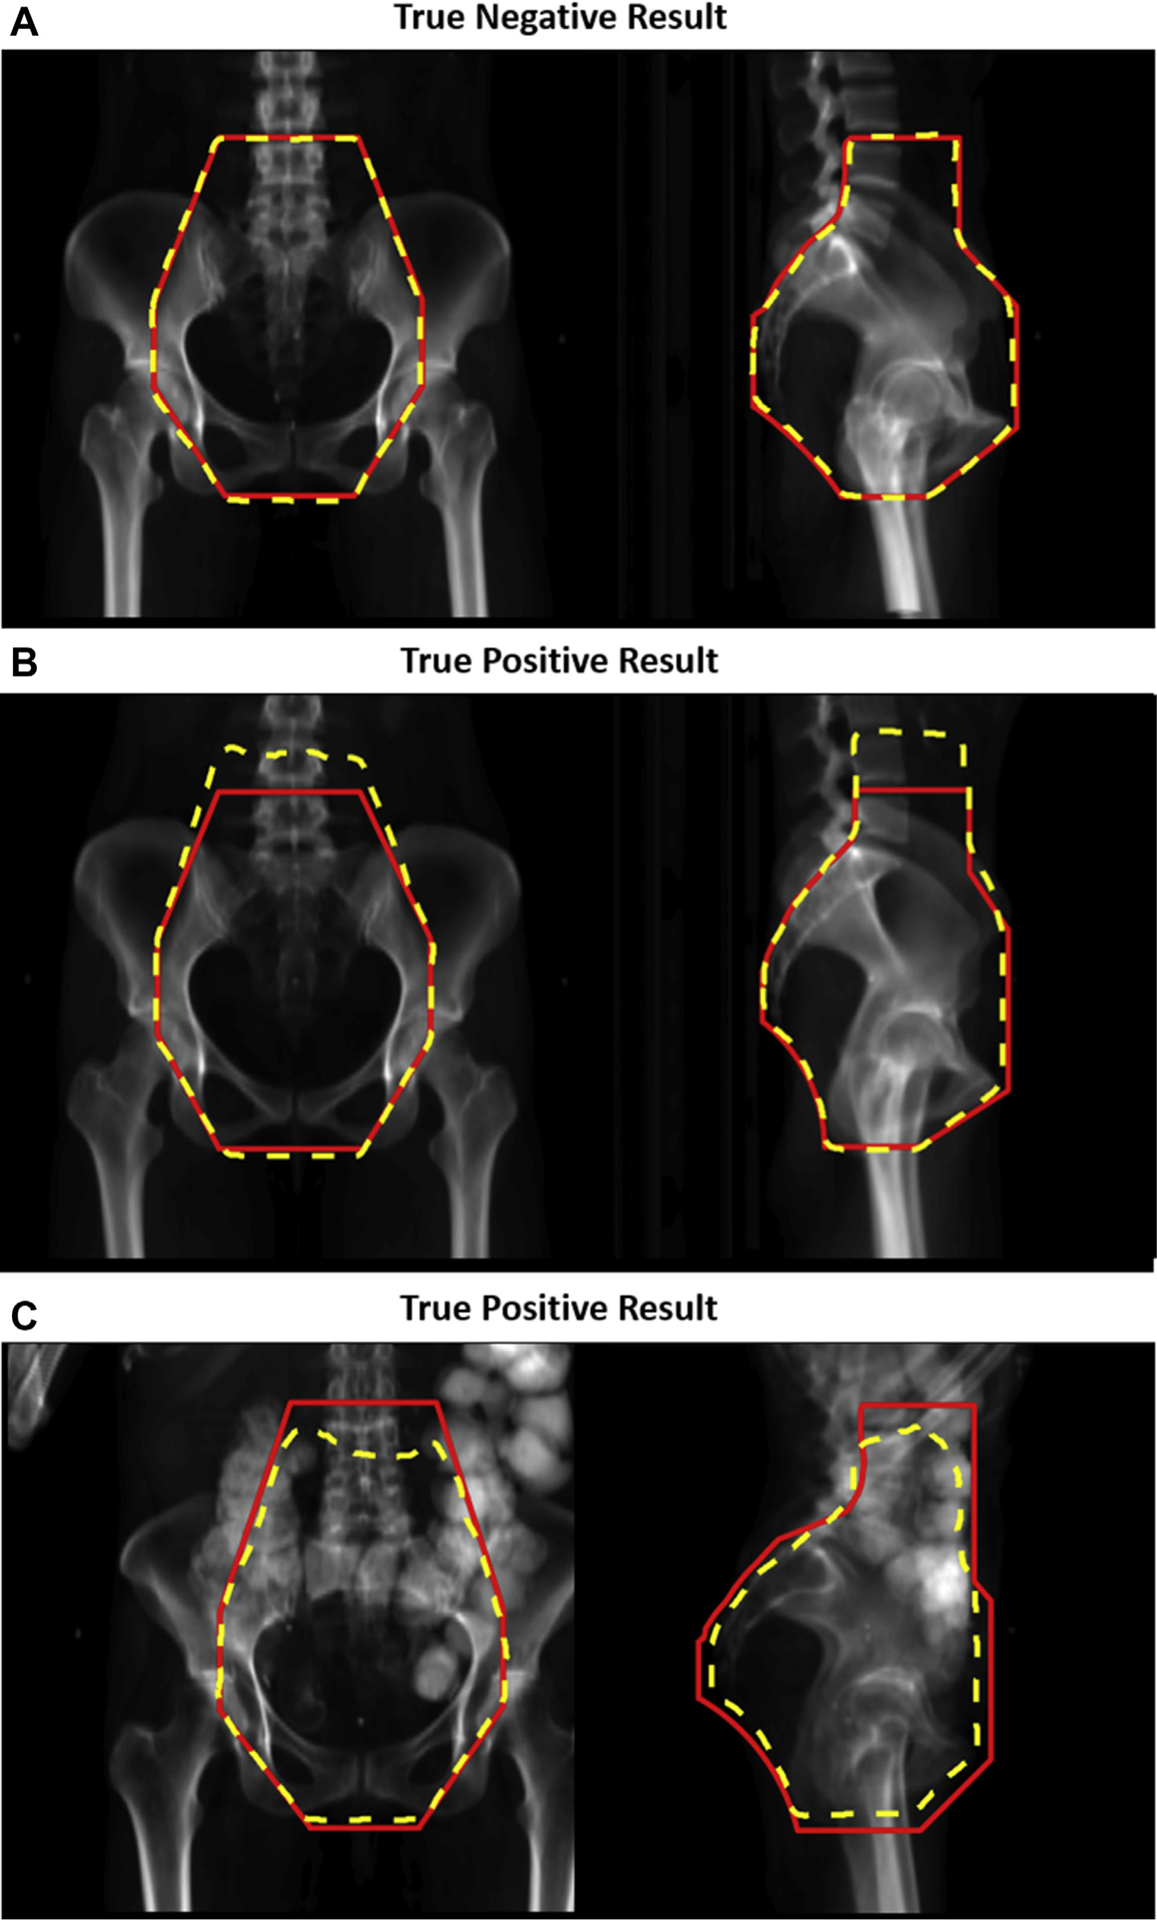
Comparison of treatment and verification beam apertures. The beam apertures (treatment apertures in red solid line and verification apertures [without postprocessing] in yellow dotted line) are shown for the anteroposterior and right lateral beams (left and right images, respectively). Panel A shows examples of beam apertures that were correctly classified as clinically acceptable by the quality assurance (QA) technique (a true negative result). Panels B and C show examples of beam apertures that were correctly classified as clinically unacceptable by the QA technique (true positive results).
Comparison metrics
The histogram distributions of the MSD, HD, and DSC values for both clinically acceptable and unacceptable beam apertures are shown in Figures 2 to 4, respectively. The means and SDs of the comparison metrics tested are embedded in the corresponding figures. For all comparison metrics, the average agreement was significantly better (lower for MSD and HD, higher for DSC) for clinically acceptable plans than for clinically unacceptable plans (all P < .001). The histograms show only a small overlap between the 2 sets of beam apertures.
Figure 2.
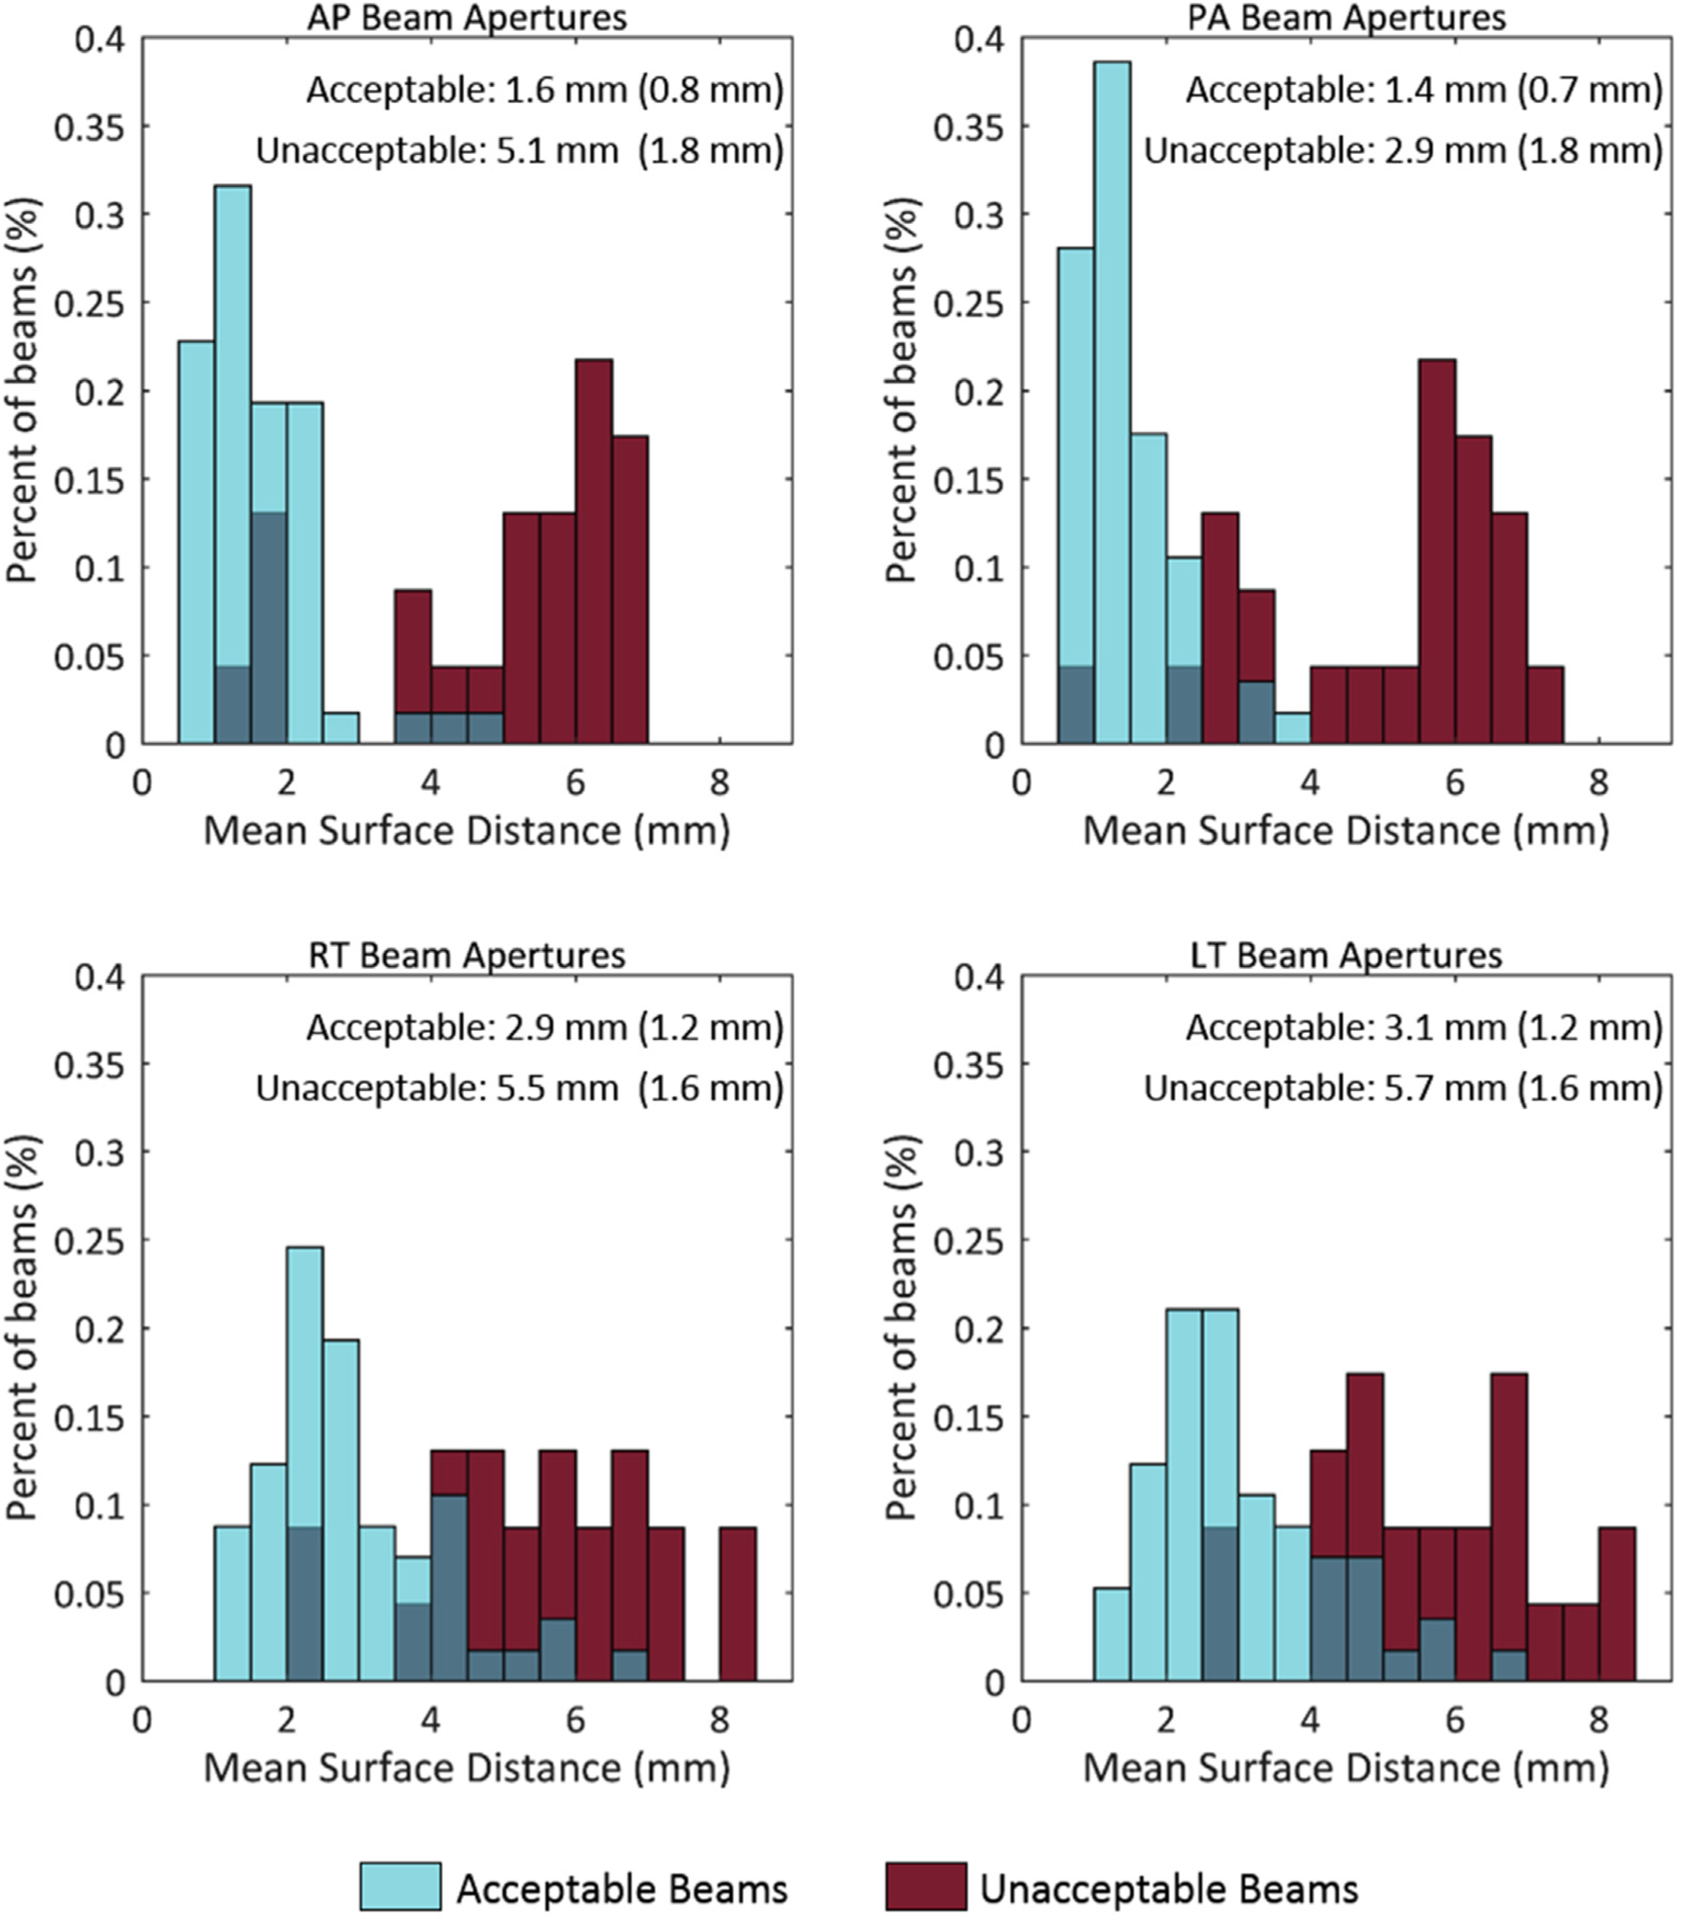
Histogram of the mean surface distance (MSD) values. Comparison of the treatment and verification beam apertures, shown for apertures rated clinically acceptable (blue) or unacceptable (red) by physicians. In each subfigure, the mean is reported, and the standard deviation is in parentheses for both the acceptable and unacceptable beams. Lower MSD values indicate better agreement. Abbreviations: AP = anteroposterior; LT = left lateral; PA = posteroanterior; RT = right lateral.
ROC analysis
Using ROC analysis, we quantified how well each of the comparison metrics could determine whether a beam aperture was unacceptable. The resulting ROC curves for all 3 metrics are shown in Figure 5. The areas under the curve (AUCs) for the AP, PA, RT, and LT beams are also shown (minimum AUC = 0.89). The high AUC values indicate that these comparison metrics could detect unacceptable beam apertures with good sensitivity and specificity. Overall, the HD metric resulted in the highest AUC for 3 of the 4 beam apertures.
Figure 5.

Receiver operating characteristic (ROC) curves for each comparison metric. The areas under the curve (AUCs) for each metric and beam angle are shown in the corresponding subfigure. Abbreviations: AP = anteroposterior; LT = left lateral; PA = posteroanterior; RT = right lateral.
To determine a threshold at which to flag plans that may be deemed unacceptable, we considered 2 scenarios: 1 with high sensitivity, giving a true-positive fraction (TPF) of 0.90, and another with high specificity, giving a low false-positive fraction (FPF) of 0.10. Using the HD metric, we determined the threshold values and the corresponding FPFs and TPFs for the beams in the high-specificity and high-sensitivity scenarios, respectively (Table 1). For the high-sensitivity scenario, the corresponding FPF was relatively low, ranging from 0.16 to 0.21. For the high-specificity scenario, the corresponding TPF was relatively high, ranging from 0.74 to 0.87. With these values and assuming that 11% of planned beams are unacceptable, in the high-sensitivity scenario, 1% of all planned beams would represent an unacceptable beam that goes undetected and approximately 16% of all beams would be unnecessarily flagged. In the high-specificity scenario, about 2% of all planned beams would represent an unacceptable beam that goes undetected and 10% of all beams would be unnecessarily flagged.
Table 1.
HD thresholds for 2 verification scenarios
| AP beam | PA beam | RT beam | LT beam | ||
|---|---|---|---|---|---|
| High sensitivity (TPF = 0.90) | Threshold | 7.0 mm | 8.3 mm | 14.1 mm | 14.1 mm |
| Corresponding FPF | 0.19 | 0.21 | 0.16 | 0.16 | |
| High specificity (FPF = 0.10) | Threshold | 11.0 mm | 10.4 mm | 19.3 mm | 19.9 mm |
| Corresponding TPF | 0.87 | 0.78 | 0.74 | 0.74 |
Abbreviations: AP = anteroposterior; FPF = false-positive fraction; HD = Hausdorff distance; LT = left lateral; PA = posteroanterior; RT = right lateral; TPF = true-positive fraction.
Discussion
In this work, we have presented a novel technique for automatically detecting unacceptable beam apertures for 4-field box treatments of cervical cancer. We were able to successfully detect unacceptable beam apertures by comparing the planned beam apertures to a set of verification apertures created using an independent, automated technique. We found that the treatment beam apertures that were rated acceptable had significantly better agreement with the verification beam apertures than those rated unacceptable (P < .01). Upon ROC analysis, we found the AUC for all comparison metrics tested to be 0.89 to 0.95, which demonstrated the high sensitivity and specificity of our quality verification technique. This technique could be an effective tool for flagging potentially unacceptable beam apertures during the treatment plan review process.
In a previous risk assessment of automated treatment planning using failure modes and effects analysis, it was found that beam aperture creation was 1 of the high-risk areas subject to failure.25 Currently, standard practice relies solely on 1 physician to determine the clinical acceptability of the beam apertures; there is no secondary check by an independent expert. To our knowledge, the QA technique presented in this work is the first technique to automatically verify the clinical acceptability of beam apertures. Because this technique was effective at detecting the clinically unacceptable beam apertures in need of editing before patient treatment with high sensitivity and specificity, it could make plan reviews more effective without requiring additional effort from staff. The increases in efficiency and safety wrought by automatic verification could be especially effective in resource-constrained settings, where there are immense staff shortages.18
We have implemented this novel automatic beam aperture verification technique as part of an automatic QA program that accompanies the Radiation Planning Assistant, an automated planning tool for cervical cancer radiation therapy that will be offered as a web-based service.16,17 The goal of the technique is to alert the physician (or other reviewer of plan quality) to potentially unacceptable beam apertures that, compared with a secondary verification set of beam apertures, exceed a threshold for a comparison metric. Based on the results of this study, we will initially use the HD as our comparison metric in our clinically deployed beam aperture verification and will select a threshold that results in high sensitivity to unacceptable beam apertures. However, this may result in an excessive number of false positives (ie, it may create alerts for plans that a physician would deem acceptable for treatment); in turn, this could cause the alerts to eventually be disregarded. Accordingly, in the initial clinical deployment of the automated planning tool and QA program, we will quantify the effectiveness of the automatic verification of beam apertures and solicit feedback from the physician users regarding the practicality of the thresholds employed for the automatic verification.
By inspecting the plans that were misclassified by the QA technique, we found that most could be attributed to DRRs that were difficult to interpret. Causes of poor quality DRRs included obscured anatomy, poor image quality, or high contrast material in the CT scan. An example of a DRR that was difficult to interpret is shown in panel C of Figure 1. Poor DRR quality presents a challenge for both the deep learning automation technique, which predicts the beam aperture using the DRR, and for physician review of the beam apertures via the DRR.
An area of potential exploration for this quality verification technique would be to test whether a combination of comparison metrics could improve the sensitivity and specificity of this quality verification technique. Alternatively, another approach would be to train a model to simply classify the beam apertures as acceptable or not, bypassing the need for using comparison metrics.
In addition to having utility within the automated planning tool for cervical cancer,16 the technique we have presented in this work could be translated to other treatment sites for which beam apertures are designed using the beam’s eye view. Our group has created such a tool for use in whole-brain treatments with lateral beams,26 which will be integrated within the Radiation Planning Assistant. The methodology presented in this work can be implemented in other clinics wanting to verify the quality of their beam apertures. To use this technique, they could train a deep learning model on their existing, clinically approved treatment plans. They would then use the resulting predictions from the model as the verification beam apertures to compare with their treatment beam apertures. Sets of beam apertures that have poor agreement could be flagged for further review.
With the development and clinical deployment of automated treatment planning, it is natural to include automated processes that aid the physicist and physician in the review of treatment plans before treatment. However, although automated plan quality verification is a useful means of enhancing the QA process and aiding staff in planning safe and effective radiation treatments, it should only be used for those purposes and never as a substitute for final manual reviews by staff. Physicians always have the responsibility of ensuring that only high-quality plans are approved for treatment. In this study, even with a threshold set for high sensitivity, 10% of beam apertures rated as clinically unacceptable would not have been flagged by the QA technique.
Conclusions
In this work, we tested the ability of a novel beam aperture quality verification technique to detect clinically unacceptable beam apertures. We found this technique to be very effective, with AUC values of 0.89–0.95. By comparing the treatment beam apertures with a verification set that was created using an independent, automated technique, we were able to detect clinically unacceptable beam apertures with high sensitivity and specificity. This technique will be deployed as part of a fully automated treatment planning tool for cervical cancer, the Radiation Planning Assistant, and could be translated to other treatment sites.
Figure 3.
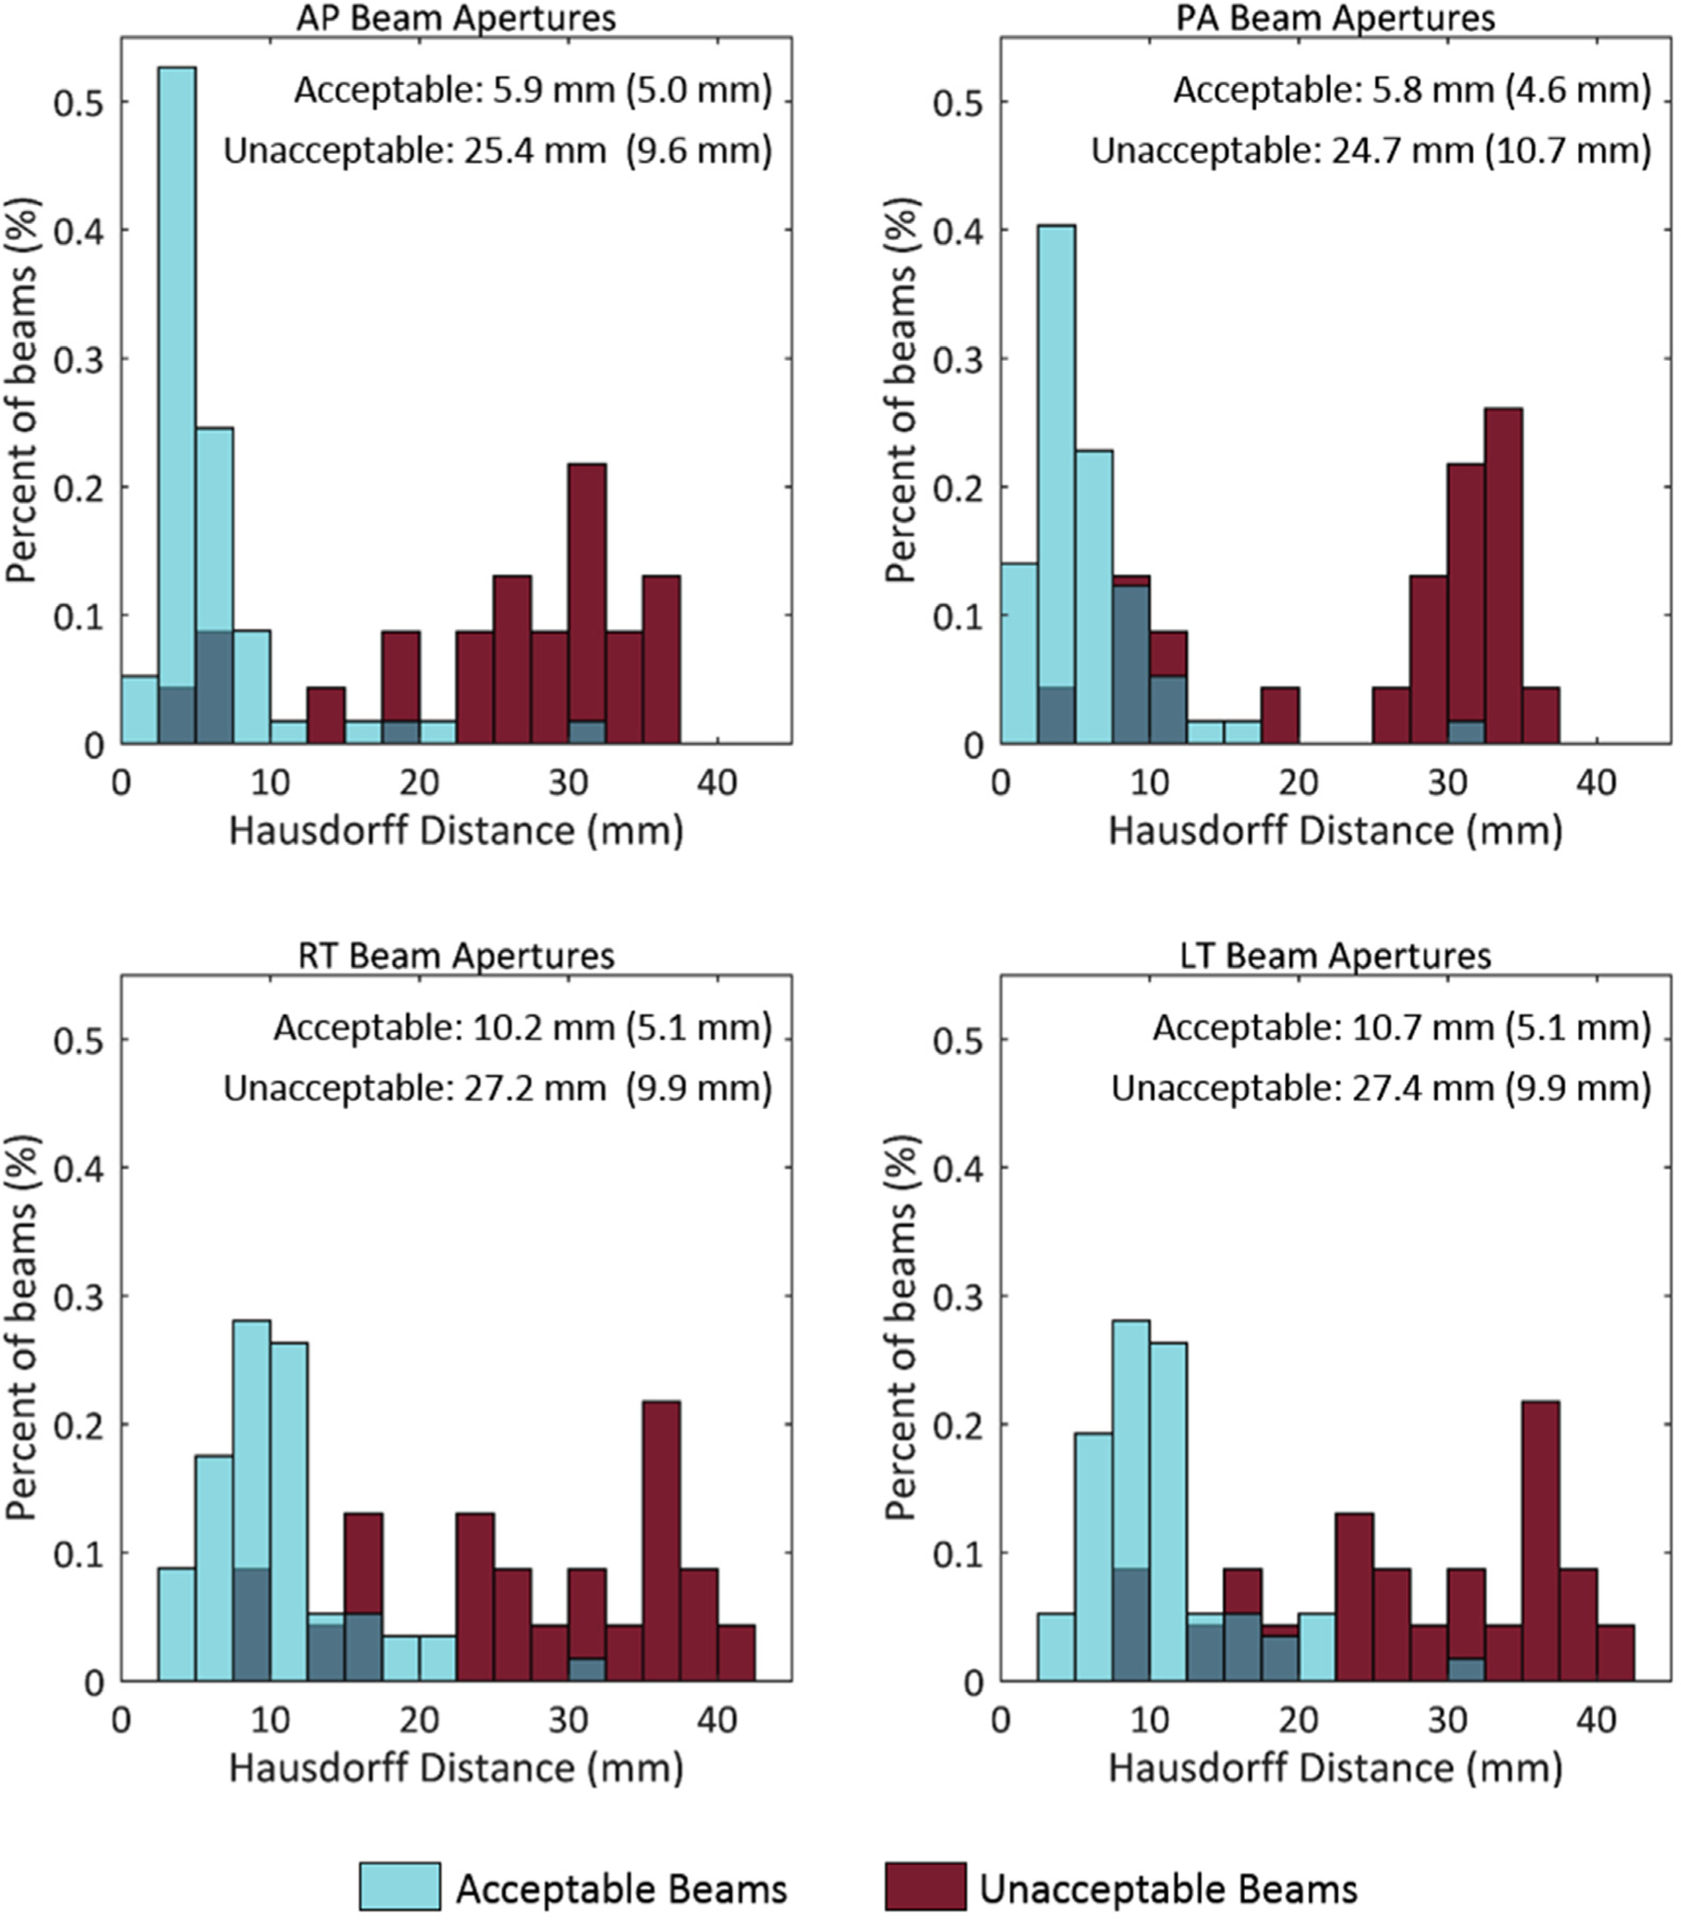
Histogram of the Hausdorff distance (HD) values. Comparison of the treatment and verification beam apertures, shown for apertures rated clinically acceptable (blue) or unacceptable (red) by physicians. In each subfigure, the mean is reported, and the standard deviation is in parentheses for both the acceptable and unacceptable beams. Lower HD values indicate better agreement. Abbreviations: AP = anteroposterior; LT = left lateral; PA = posteroanterior; RT = right lateral.
Figure 4.

Histogram of the Dice similarity coefficient (DSC) values. Comparison of the treatment and verification beam apertures, shown for apertures rated clinically acceptable (blue) or unacceptable (red) by physicians. In each subfigure, the mean is reported, and the standard deviation is in parentheses for both the acceptable and unacceptable beams. Higher DSC values indicate better agreement. Abbreviations: AP = anteroposterior; LT = left lateral; PA = posteroanterior; RT = right lateral.
Acknowledgments
The authors thank Laura Russell from the department of scientific publications at The University of Texas MD Anderson Cancer Center for editing this work. They would also like to thank the NIH for funding this work and Varian Medical Systems and the African Cancer Institute for their support. We gratefully acknowledge the support of the Nvidia Corporation with the donation of the Tesla K40 GPU used for the present research.
References
- 1.Clark BG, Brown RJ, Ploquin J, Dunscombe P. Patient safety improvements in radiation treatment through 5 years of incident learning. Pract Radiat Oncol. 2013;3:157–163. [DOI] [PubMed] [Google Scholar]
- 2.Novak A, Nyflot MJ, Ermoian RP, et al. Targeting safety improvements through identification of incident origination and detection in a near-miss incident learning system. Med Phys. 2016; 43:2053–2062. [DOI] [PubMed] [Google Scholar]
- 3.Gopan O, Smith WP, Chvetsov A, et al. Utilizing simulated errors in radiotherapy plans to quantify the effectiveness of the physics plan review. Med Phys. 2018;45:5359–5365. [DOI] [PubMed] [Google Scholar]
- 4.Ford EC, Terezakis S, Souranis A, Harris K, Gay H, Mutic S. Quality control quantification (QCQ): A tool to measure the value of quality control checks in radiation oncology. Int J Radiat Oncol. 2012;84:e263–e269. [DOI] [PubMed] [Google Scholar]
- 5.Gopan O, Zeng J, Novak A, Nyflot M, Ford E. The effectiveness of pretreatment physics plan review for detecting errors in radiation therapy. Med Phys. 2016;43:5181–5187. [DOI] [PubMed] [Google Scholar]
- 6.Yang D, Moore KL. Automated radiotherapy treatment plan integrity verification. Med Phys. 2012;39:1542–1551. [DOI] [PubMed] [Google Scholar]
- 7.Furhang EE, Dolan J, Sillanpaa JK, Harrison LB. Automating the initial physics chart-checking process. J Appl Clin Med Phys. 2009; 10:129–135. [DOI] [PMC free article] [PubMed] [Google Scholar]
- 8.Siochi RA, Pennington EC, Waldron TJ, Bayouth JE. Radiation therapy plan checks in a paperless clinic. J Appl Clin Med Phys. 2009;10:43–62. [DOI] [PMC free article] [PubMed] [Google Scholar]
- 9.Olsen LA, Robinson CG, He GR, et al. Automated radiation therapy treatment plan workflow using a commercial application programming interface. Pract Radiat Oncol. 2014;4:358–367. [DOI] [PubMed] [Google Scholar]
- 10.Moore KL, Brame RS, Low DA, Mutic S. Experience-based quality control of clinical intensity-modulated radiotherapy planning. Int J Radiat Oncol. 2011;81:545–551. [DOI] [PubMed] [Google Scholar]
- 11.Wu B, Ricchetti F, Sanguineti G, et al. Patient geometry-driven information retrieval for IMRT treatment plan quality control. Med Phys. 2009;36:5497–5505. [DOI] [PubMed] [Google Scholar]
- 12.Wang Y, Heijmen BJM, Petit SF. Prospective clinical validation of independent DVH prediction for plan QA in automatic treatment planning for prostate cancer patients. Radiother Oncol. 2017;125: 500–506. [DOI] [PubMed] [Google Scholar]
- 13.Appenzoller LM, Michalski JM, Thorstad WL, Mutic S, Moore KL. Predicting dose-volume histograms for organs-at-risk in IMRT planning. Med Phys. 2012;39:7446–7461. [DOI] [PubMed] [Google Scholar]
- 14.International Atomic Energy Agency. IAEA Human Health Reports No. 6 Management of Cervical Cancer: Strategies for limited-resource centres — a guide for radiation oncologists. Available at: http://www.rho.org/files/IAEA_Radiation_oncology_2013.pdf. Accessed March 9, 2017. [Google Scholar]
- 15.Chuang LT, Temin S, Camacho R, et al. Management and care of women with invasive cervical cancer : American Society of Clinical Oncology resource-stratified clinical practice guideline. J Glob Oncol. 2016;2:1–30. [DOI] [PMC free article] [PubMed] [Google Scholar]
- 16.Kisling K, Zhang L, Simonds H, et al. Fully automatic treatment planning for external beam radiation therapy of locally advanced cervical cancer – a tool for low-resource clinics. J Glob Oncol. 2019;5:1–9. [DOI] [PMC free article] [PubMed] [Google Scholar]
- 17.Court LE, Kisling K, McCarroll R, et al. Radiation planning assistant - a streamlined, fully automated radiotherapy treatment planning system. J Vis Exp. 2018;2018:e57411. [DOI] [PMC free article] [PubMed] [Google Scholar]
- 18.Datta NR, Samiei M, Bodis S. Radiation therapy infrastructure and human resources in low-and middle-income countries: Present status and projections for 2020. Int J Radiat Oncol Biol Phys. 2014; 89:448–457. [DOI] [PubMed] [Google Scholar]
- 19.Yang J, Zhang Y, Zhang L, Dong L. Automatic segmentation of parotids from CT scans using multiple atlases. In: Medical Image Analysis for the Clinic: A Grand Challenge. Beijing, China; 2010: 323–330. [Google Scholar]
- 20.Chen L-C, Zhu Y, Papandreou G, Schroff F, Adam H. Encoder-decoder with atrous separable convolution for semantic image segmentation. In: Proceedings of the European Conference on Computer Vision (ECCV). Munich, Germany; 2018:801–818. [Google Scholar]
- 21.Cardenas C, Anderson B, Zhang L, et al. A comparison of two deep learning architectures to automatically define patient-specific beam apertures. Med Phys. 2018;45:e132. [Google Scholar]
- 22.Cardenas CE, Anderson BM, Aristophanous M, et al. Auto-delineation of oropharyngeal clinical target volumes using 3D convolutional neural networks. Phys Med Biol. 2018;63:215026. [DOI] [PubMed] [Google Scholar]
- 23.Varma S, Simon R. Bias in error estimation when using cross-validation for model selection. BMC Bioinformatics. 2006;7:1–8. [DOI] [PMC free article] [PubMed] [Google Scholar]
- 24.Yang J, Amini A, Williamson R, et al. Automatic contouring of brachial plexus using a multiatlas approach for lung cancer radiation therapy. Pract Radiat Oncol. 2013;3:e139–e147. [DOI] [PubMed] [Google Scholar]
- 25.Kisling K, Johnson JL, Simonds H, et al. A risk assessment of automated treatment planning and recommendations for clinical deployment. Med Phys. 2019;46:2567–2574. [DOI] [PMC free article] [PubMed] [Google Scholar]
- 26.Han E, Cardenas C, Nguyen C, et al. Automated treatment planning for whole brain irradiation with a deep learning approach. Med Phys. 2019;46:E236. [Google Scholar]