

Abstract
BACKGROUND AND PURPOSE: Perihippocampal fissures (PHFs) and hippocampal sulcus residual cavities (HSCs) are common findings in the MR imaging examination of the hippocampus in aging and Alzheimer disease (AD); however, little is known about how to distinguish them or their relative clinical relevance. We hypothesized that prominence of the HSC, unlike PHF, is not significantly influenced by the hippocampal atrophy related to aging or AD.
METHODS: We studied and evaluated these hippocampal CSF spaces on MR imaging scans from 130 normal control (NC) subjects (20–90 years of age) and 27 AD patients.
RESULTS: HSC is poorly correlated with age and is not related to the magnitude of hippocampal atrophy. There is no significant difference of HSCs between AD and age-matched NCs, but in the extremely high HSCs group (top 20%), 91% of cases are NC. PHFs, on the other hand, are strongly correlated with age and are valuable in the diagnosis of AD. Location and communication with ambient cistern is the key to distinguish HSC from PHF.
CONCLUSION: Identifying hippocampal atrophy (enlarged PHF) may be particularly challenging in the presence of HSC. Distinguishing among the CSF spaces in hippocampus may help in the radiologic evaluation of hippocampal atrophy. Patients with extremely high HSCs (>8.4) can be excluded from AD risk with 93% specificity.
Enlarged CSF spaces in the hippocampus have been noted in MR imaging studies of the medial temporal lobe in aging and Alzheimer disease (AD).1,2 These spaces include the perihippocampal fissures (PHF), uncal sulcus, and the hippocampal sulcus residual cavity (HSC); however, little is known about distinguishing the HSC from these other spaces or their relative clinical relevance. This article describes the anatomy of the HSC and examines its relationships to age, AD, and PHF. We hypothesized that the prominence of the HSC, unlike PHF, is a developmental variant and not significantly influenced by hippocampal atrophy or AD.
Materials and Methods
Subjects
One hundred thirty normal control (NC) subjects and 27 AD patients with mild to severe dementia were examined at the New York University School of Medicine—Alzheimer Disease Core Center and Center for Brain Health. As part of a comprehensive diagnostic screening and evaluation procedure, subjects were administered medical, neurologic, psychiatric, neuropsychological, and neuroradiologic examinations. All screening and clinical examinations were completed within 3 months of the MR imaging scan date. These procedures were repeated every 2 years.
Individuals with evidence of structural brain alterations including mass, stroke, or lacunar infarcts or evidence for hydrocephalus were excluded. Staging for the general level of functional ability was obtained by using the 7-point Global Deterioration Scale (GDS).3 This clinician-administered evaluation defines normal subjects as those with a GDS score of 1 or 2, where a subjective memory complaint in the absence of any functional or objective neuropsychological deficits is characteristic of GDS 2 and no change in memory performance since early adulthood is characteristic of GDS 1. Normal subjects were separated into 10-year age cohorts, from the 20s through 80s. The AD subjects ranged from GDS 4 to 6 (mild to severe severity) and met NINCDS ADRDA criteria4 for AD (Table 1). Men and women were similarly represented across all age cohorts.
Table 1:
Subject characteristics
| Age Group (y) | N | Female (%) | Education (y; mean ± SD) | Age (y; mean ± SD) |
|---|---|---|---|---|
| 20–30 | 18 | 56 | 15 ± 1.6 | 24 ± 3.6 |
| 31–40 | 17 | 53 | 17 ± 1.9 | 35 ± 3.4 |
| 41–50 | 19 | 58 | 17 ± 1.5 | 46 ± 2.6 |
| 51–60 | 19 | 58 | 17 ± 1.4 | 55 ± 2.6 |
| 61–70 | 18 | 50 | 16 ± 2.3 | 66 ± 2.6 |
| 71–80 | 19 | 53 | 16 ± 2.5 | 75 ± 2.6 |
| 81–90 | 20 | 65 | 15 ± 2.2 | 84 ± 2.6 |
| 50–88* | 27 | 67 | 16 ± 2.7 | 72 ± 10.8 |
Note:—Normal controls in age groups 20–90 = 130.
Alzheimer disease group.
MR Imaging Studies
MR images were performed on a 1.5T scanner. Data were obtained by using T2 short-τ inversion recovery (STIR) coronal (retention time [TR], 8000; echo time [TE], 17; field of view, 24 × 24; acquisition matrix, 512 × 256; section thickness, 3 mm and no gap) and T1 spoiled gradient recalled-echo coronal sequences (TR, 35; TE, 9; acquisition matrix, 256 × 128; section thickness, 1.5 mm and no gap). The coronal T2 images were reformatted to the axial plane parallel to the long axial of the hippocampus with 1-mm thickness and no gaps. The PHF rating was based on the axial T2 image, and HSC measurement was based on T2 STIR coronal image. T1 images were used to verify the signal intensity of the CSF.
Hippocampal Sulcus Residual Cavity Evaluations
Hippocampal sulcus residual cavities (HSC) were identified on T2-weighted STIR coronal images by both location and CSF consistent signal intensity characteristics. HSC were typically located in the lateral portion of the hippocampus and within 5 mm of the margin of the temporal horn of the lateral ventricle (Fig 1A–D). HSC are isointense to CSF on both T1- and T2-weighted images. We measured the area of each cavity manually in every section by MIDAS software (New York University) (Fig 1D) and summed them across hemispheres to get each individual’s HSC score.
Fig 1.
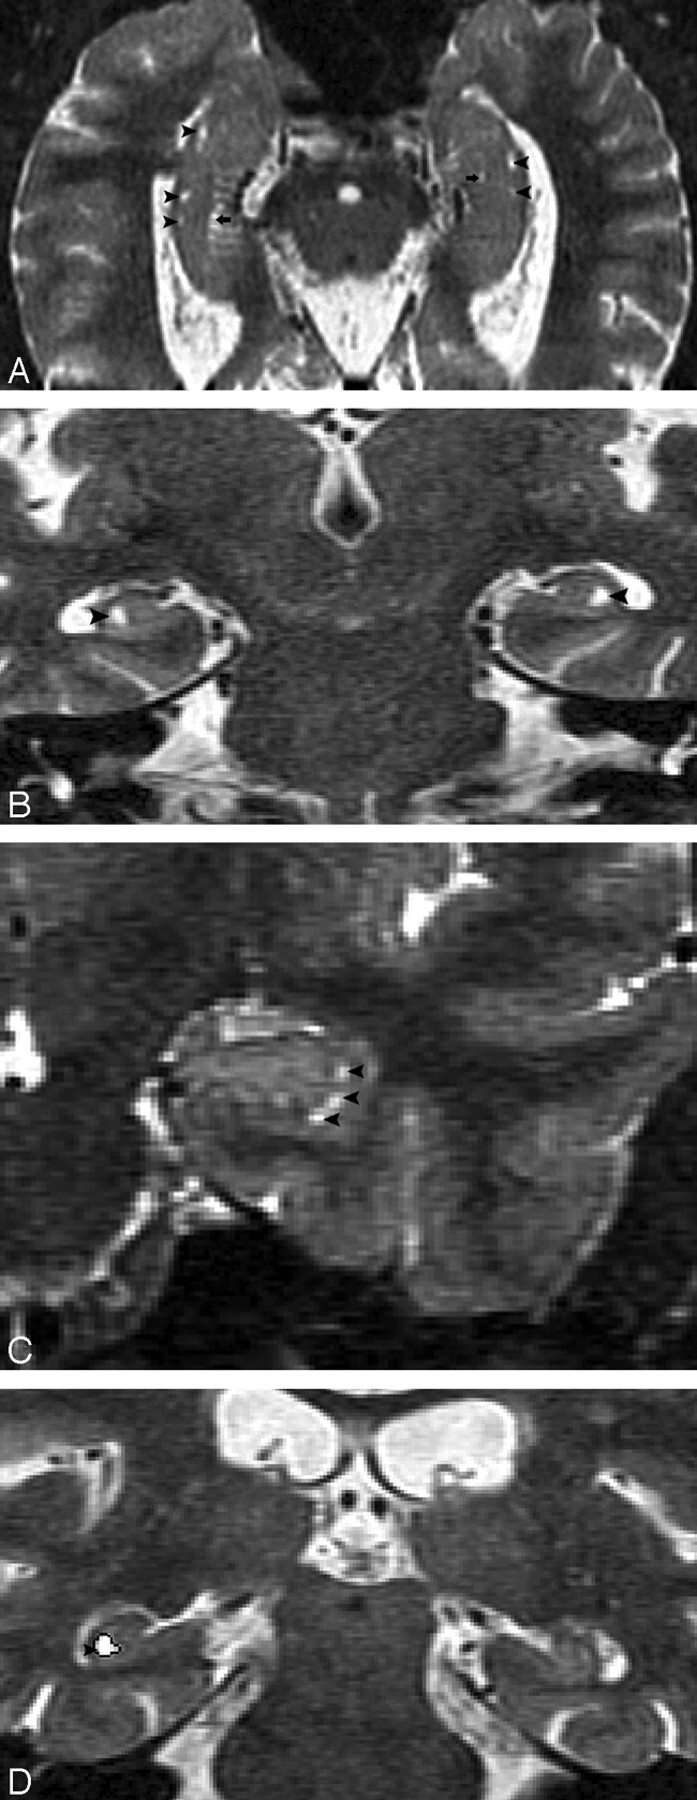
MR imaging appearance of hippocampal sulcus residual cavity (HSC).
A, The image was reformatted to a 1-mm-thick axial plane from the coronal T2 short-τ inversion recovery (STIR) scan, paralleling to the long axial of hippocampus (HSC, arrowheads; perihippocampal fissures [PHF], arrows).
B–D, Images were obtained by using the T2 STIR sequence (section thickness, 3 mm; HSC, arrowheads).
D, Region of interest of HSC (arrowhead).
Perihippocampal Fissures Evaluations
The perihippocampal fissures (PHFs) include the lateral part of the transverse fissure, the choroidal fissure, and the hippocampal fissure.2(Fig 2A, -B) The transverse fissure is the lateral extension of the ambient cistern, which separates the thalamus superiorly from the perihippocampal gyrus inferiorly. The superior lateral extension of the transverse fissure is the choroidal fissure, which extends superior to the hippocampus. The inferior lateral extension of the transverse fissure is the hippocampal fissure, which extends between the cornu ammonis and the subiculum (Fig 2). The uncal sulcus may be noticed in the head of hippocampus (Fig 3G, H). We used a 4-point subjective scale to rate the size of the perihippocampal fissures on the axial T2 images.2 The PHF in all cases were rated independently by 2 radiologists (Y.L. and J.Z.) blinded to patient clinical status. The intraclass correlation coefficient for inter-reader reliability was 0.95. For all cases with disagreements in the ratings, a final consensus diagnosis was achieved. For each hemisphere, PHF was rated on the axial T2 imaging by using the following atrophy scoring: 0, none; 1, questionable; 2, mild/moderate; and 3, severe2 (Fig 3). An individual subject’s total PHF score was determined by summing the scores across hemispheres.
Fig 2.
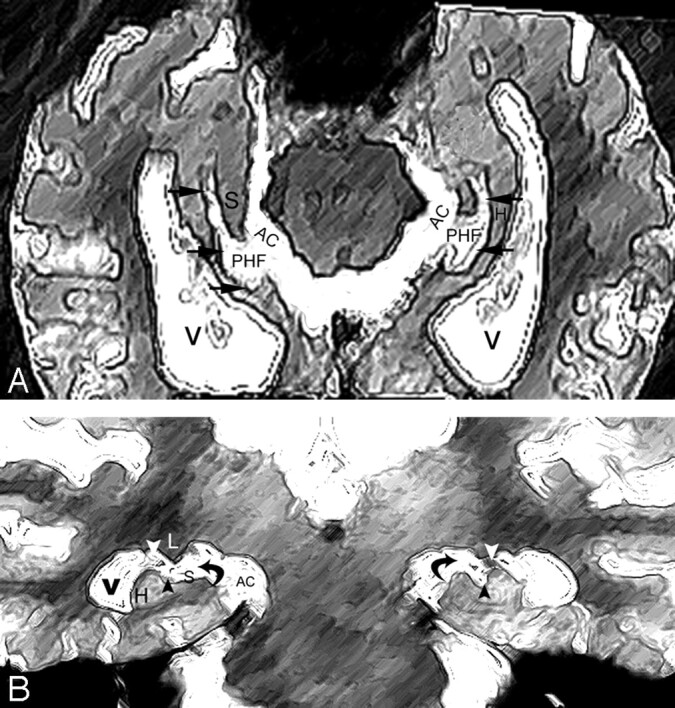
A and B, Normal anatomy of perihippocampal fissure.
A, Axial diagram showing the structure of perihippocampal fissures (PHF).
B, Coronal diagram showing the structure of PHF.
Black arrows, PHF; black arrowhead, hippocampal fissure; white arrowhead, choroidal fissure; curved arrow, transverse fissure of Bichat); H, hippocampus; S, subiculum; AC, ambient cistern.
Fig 3.
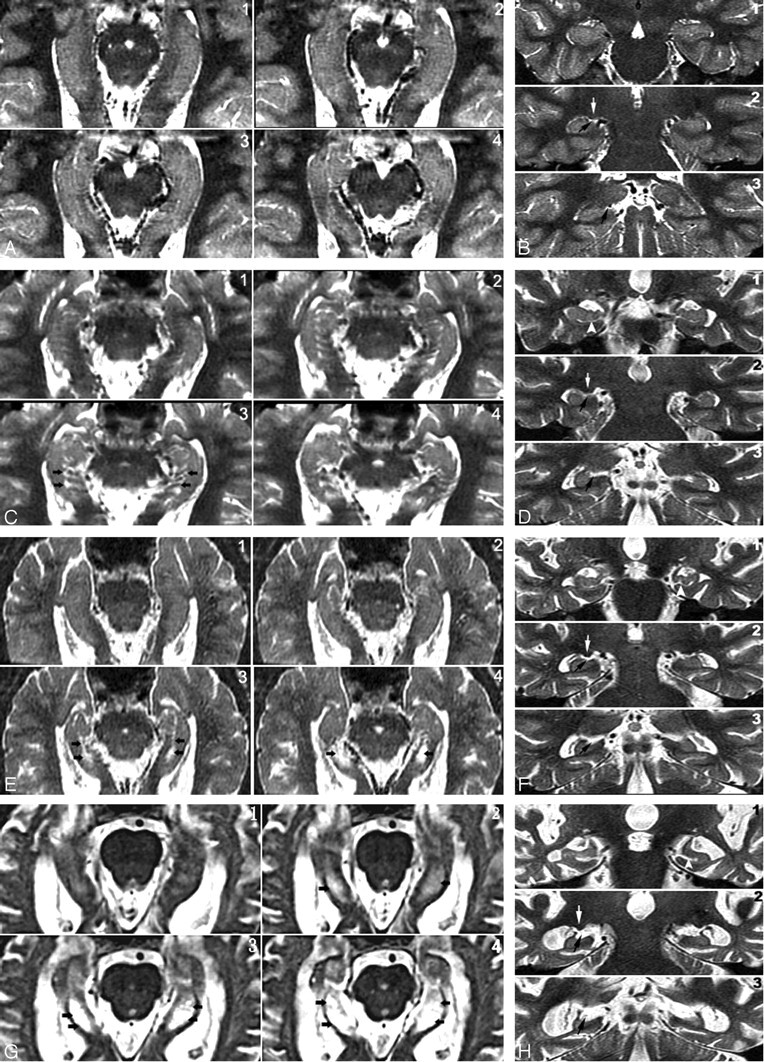
Four-point subjective rating scale of the perihippocampal fissures (PHF).
A and B, Axial and coronal view of same case. Left = 0; right = 0
C and D, Axial and coronal view of same case. Left = 1; right = 1
E and F, Axial and coronal view of same case. Left = 2; right = 2
G and H, Axial and coronal view of same case. Left = 3; right = 3
Axial images were reformatted in 1-mm thickness from inferior to superior, paralleling to the long axial of hippocampus. Black arrows highlight the PHF. There are 3 coronal views for each case showing the head, bodyi and tail of hippocampus. Black arrows highlight the PHF. White arrows on coronal plane show lateral geniculate body. Arrowheads on coronal plane show uncal sulcus.
Statistics
Analysis of variance models were used to compare HSC and PHF scores between the AD and an age-matched NC group. Linear regression models were used to examine the relationships between age and HSC or PHF and the relationship between HSC and PHF. Results were considered significant at P < .05. All analyses were performed by using SPSS 12.0 (SPSS Inc., Chicago, Ill).
Results
MR Imaging Structure and Differential Diagnosis
Normal MR Imaging Appearance.
On MR imaging, HSC appeared round, oval, or crescent, and the diameter ranges from 1 to 5 mm (Fig 1D). HSC were found with a prevalence of 64% in entire NC group and there was no significant difference between men and women (χ2(1) = 1.6; P > .05). The prevalence of HSC was 74% in AD compared with 75% in the age-matched NC group. In some cases, multiple cavities were present and appeared like a string of beads in both axial and coronal planes (Fig 1A, -C). In the NC subjects, 31% of the HSC were found in the hippocampal head, 50% were found in the hippocampal body, and 19% were found in the hippocampal tail. The observed prevalence of the HSC is found in Table 2.
Table 2:
Age and hemisphere prevalence of HSC in 130 normal control cases
| Age Group (y) | N | Cavity-Positive Finding |
||
|---|---|---|---|---|
| Patients with HSC (%) | Patients with Bilateral HSC (%) | Patients with Multiple HSC (%) | ||
| 20–30 | 18 | 22 | 17 | 17 |
| 31–40 | 17 | 59 | 47 | 47 |
| 41–50 | 19 | 63 | 32 | 37 |
| 51–60 | 19 | 68 | 37 | 42 |
| 61–70 | 18 | 78 | 56 | 56 |
| 71–80 | 19 | 63 | 21 | 58 |
| 81–90 | 20 | 90 | 55 | 55 |
| Total | 130 | 64 | 38 | 42 |
Note:—HSC indicates hippocampal salcus residual cavity.
Differentiations in the HSC on MR Imaging.
In the coronal plane, the differentiation of a HSC in the presence of a dilated uncal sulcus is challenging. As seen in Figs 4A and 5A, these CSF structures look very similar. They can be differentiated by identifying the medial to lateral course of the uncal sulcus through its continuation with the ambient cistern. This relationship is clearly seen in a 3-year follow-up, when the uncal sulcus, but not the HSC, changed over time (Figs 4B and 5B). In the axial plane, the differentiation of a HSC from the PHF and from uncal sulcus can be difficult (Figs 6A and 7A). Comparing them, the HSC is again the more lateral and distributed along the vestigial primary hippocampal sulcus. We conclude that the coronal plane (Figs 6B and 7B) is most helpful for distinguishing between them.
Fig 4.

T2 short-τ inversion recovery (STIR) MR coronal image obtained from a 74-year-old male normal control (NC) patient. A, Arrowhead shows a small hippocampal sulcus residual cavity (HSC); arrow shows perihippocampal fissures (PHF) (uncal sulcus). B, 3-year follow-up scan. Comparing A and B, there is progressive dilation of the uncal sulcus (arrow), but no obvious change in the size of the HSC (arrowhead).
Fig 5.

T2 short-τ inversion recovery (STIR) MR coronal image was obtained from a 73-year-old male normal control (NC) patient. Arrows show a dilated uncal sulcus and no hippocampal sulcus residual cavity (HSC). B, 3-year follow-up.
Fig 6.

T2 short-τ inversion recovery (STIR) MR image was obtained from a 66-year-old female normal control (NC) patient.
A, Axial plane, arrowheads show the hippocampal sulcus residual cavity (HSC) and arrow shows the uncal sulcus. We can best differentiate them on the coronal plane.
Fig 7.

Image obtained from a 90-year-old female normal control (NC) patient. Axial (A) and coronal (B) T2 short-τ inversion recovery (STIR) MR image show the perihippocampal fissures (PHF) (black arrows). This is also best seen along the coronal plane (B).
PHF and HSC: Relationship with Age and AD
Age was poorly correlated with HSCs (R2 = 0.07; P < .01). There was a lower mean of HSCs in AD than in the age-matched NC group, but, because of great variance, there were no significant differences in HSCs between AD and the age-matched NC group (F[1,100] = 2.9; P > .05; see Fig 8 and Table 3), in older AD (>70 years) or the age-matched NC groups. Among the AD and the age-matched NC groups (>50 years) combined, those with the highest HSCs (top 20%) are predominantly NC. By using a cutoff of 8.4, 91% (21/23) of cases were identified from AD risk (Fig 9 and Table 4). On the other hand, the results showed that age was correlated strongly with the PHF score (R2 = 0.59; P < .01). There was a steep rise of the curve after 55 years (Fig 10). The PHF scores in the AD group were also correlated with age (R2 = 0.25; P < .01). The severity of the PHF in AD was greater than in the normal control (NC) group (F[1,99] = 6.98; P < .01). Finally, by using a multiple linear regression model, we found no relationship between HSCs and PHFs, controlling for age (R2 = 0.05; P > .05).
Fig 8.

Scatter plot and regression lines show the relationship between age and hippocampal sulcus residual cavity (HSC) in both normal control (NC) patients and those with Alzheimer disease (AD).
Table 3:
Distributions of HSCs and PHFs by clinical diagnosis
| N | HSCs (mean ± SD) | PHFs (mean ± SD) | |
|---|---|---|---|
| Normal controls | 130 | 4.37 ± 5.97 | 1.53 ± 1.47 |
| Alzheimer disease | 27 | 3.08 ± 3.92 | 4.89 ± 1.22 |
| Age-matched normal controls | 62 | 5.54 ± 4.39 | 2.25 ± 1.48 |
Note:—HSC indicates hippocampal sulcus residual cavity; PHF, perihippocampal fissure.
Fig 9.

Scatter plot and cutoff (hippocampal sulcus residual cavity [HSC], 8.4) for the top 20% high HSC cases.
Table 4:
Distributions of high HSCs category and AD
| Age-Matched Normal Controls | Alzheimer Disease | Total | |
|---|---|---|---|
| >8.4 mm2 | 21 | 2 | 23 |
| <8.4 mm2 | 55 | 25 | 80 |
| Total | 76 | 27 | 103 |
Note:—HSC indicates hippocampal sulcus residual cavity.
Fig 10.

Scatter plot and regression lines showing the relationship between age and perihippocampal fissures (PHF) in both normal control (NC) patients and Alzheimer disease (AD).
Discussion
Relationship of HSC to Age
Age was poorly associated with HSCs across the life span from 20 to 90 years (R2 = 0.07). When we dichotomized the NC group (that is, young NC [20–50 years] with the old NC groups [51–90 years]), the HSC score in the old NC group was higher (t [128] = 3.1; P < .01). Correlations between HSC scores and age, however, were not found within either group. Between the ages of 30 and 80 years, age was not correlated with HSC score (R2 = 0.02; P > .05), so we conclude that the weak correlation observed is largely driven by between-group differences at the extremes of the life span. We did not observe HSC changes in the longitudinal MR imaging study of hippocampus. Figure 4 is a good example.
Relationship with Hippocampal Atrophy and AD
Prior articles 2,5-9 and our current data demonstrate that PHF is a useful clinical marker of the hippocampal atrophy associated with AD. Our observations are consistent with prior findings of greater PHF in AD and aging. We did not, however, observe an association between HSC scores and PHF scores. There was no significant HSC score difference between the AD group and the age-matched NC group either. We further conclude that HSC is not influenced by hippocampal atrophy related to aging and AD.
Anatomy and Differentiations
According to Duvernoy,5 at the embryonic stage, the cornu ammonis and dentate gyrus are continuous. The growing cornu ammonis increasingly bulges into the ventricular cavity (Fig 11). The primitive cornu ammonis and dentate gyrus are inverted and rolled up, so a deep cleft, the primitive hippocampal sulcus, is formed between them. This is followed by fusion of the cornu ammonis and dentate gyrus, fusion of the subiculum and dentate gyrus, and closure of the largest portion of the sulcus. This results in a residual shallow groove, the hippocampal fissure. The remnant of the primitive hippocampal sulcus is the HSC (Fig. 12).5,6 The enlargement PHF is highly correlated with hippocampal atrophy.7-11 These dilated sulci may look like cavities on some cross-section of MR imaging. These CSF spaces in hippocampus need to be distinguished, because they often form part of the clinical radiologic impression of hippocampal atrophy. Errors are common, because the anatomy can be readily misidentified.12 The key to differentiating HSC from the uncal sulcus and PHF is location. Our data show that HSC are more lateral to both PHF and the uncal sulcus and distributed along the vestigial primary hippocampal sulcus close to the ventricular margins. Another important anatomical factor is the CSF channels.
Fig 11.

Images derived from the human hippocampus (Duvernoy, 1988)5.
A, Six-week-old embryo. Open arrow shows the primitive hippocampal sulcus.
B, Adult. Black arrow shows the hippocampal fissure; arrowhead shows residual cavity.
C, T2 coronal MR image was obtained from a 67-year-old female normal control (NC) patient. Arrowhead shows the same shape hippocampal sulcus residual cavity (HSC) as in B.
Fig 12.

T2 MR imaging (A) and the corresponding postmortem gross specimen (B) from an 86-year-old woman with Alzheimer disease (AD), showing a crescent-shaped HSC (arrowhead) and an enlarged uncal sulcus (arrow).
PHF and the uncal sulcus communicate with the ambient cistern if tracked across sections. Viewing both coronal and axial planes is helpful in challenging cases.
Our study demonstrates that the HSC is a normal anatomic variant, with 64% prevalence across the normal adult life span. Considerable variability exists among the published HSC prevalence estimates (Table 5). Our data suggest that the frequency of detection of HSC on MR imaging is likely influenced by section thickness. Because the HSC is small, studies that use thinner sections will detect more HSC. In general, women have smaller heads than men, but we did not observe a significant sex difference in the prevalence of HSC. We conclude that the detection of HSC is not affected by sex and therefore is unlikely to be dependent on head size.
Table 5:
Reported frequency of HSC in the MR imaging literature
| Study | Frequency of HSC (%) | Age (y) | Sequence | Orientation | Thickness (mm) | Gap (mm) | Matrix |
|---|---|---|---|---|---|---|---|
| Sasaki et al6 | 39 | 8–85 | T2 SE | Axial | 5–7 | * | 256 × 192 |
| Yoneoka et al13 | 26 | 18–80 | T2 FSE | Coronal | 5 | 2.5 | 512 × 512 |
| Bartres-Faz et al12 | 93 | 50–85 | T2 FSE | Axial | 3 | * | 256 × 256 |
| Current study | 64 | 20–90 | T2 STIR | Coronal | 3 | 1 | 512 × 256 |
Note:—HSC indicates hippocampal sulcus residual cavity.
No mention.
This study shows that there is no significant difference of HSC between AD and NC groups and there is an equal prevalence in each group. But why are those with high HSC scores predominantly in the NC group? The reason is not clear and requires further study. In the present study, we did not measure head size and normalize the HSC. This may be another potential limitation.
Conclusion
Our study shows that HSC scores, unlike PHF scores, are not significantly influenced by hippocampal atrophy related to aging and AD. In early AD, the medial temporal lobe shows specific volumetric reduction, and the accurate identification of atrophic changes requires detailed anatomic knowledge. Hippocampal atrophy on MR imaging may be particularly challenging to characterize in the presence of HSC, which may resemble enlarged PHF CSF spaces or a dilated uncal sulcus. The accurate distinction among the hippocampal CSF spaces will be helpful in the assessment of hippocampal atrophy. We also can identify patients with extremely high HSC scores (>8.4) from AD risk with 93% specificity.
Acknowledgments
We thank Wai-Hon Tsui for imaging analysis software support for this study. We also thank Lisa Mosconi and Kenneth E. Rich for reviewing the article and Ms. Terry Heyman for her superb care of the patients during the MR imaging procedures. Finally, we thank Dr. L.A. Saint Louis for the MR imaging review.
Footnotes
This study was supported by National Institute on Aging grants AG12101, AG08051, and AG022374.
This paper was presented as a scientific poster at the 43rd annual meeting of the American Society for Neuroradiology, May 21–27, 2005.
References
- 1.Barboriak DP, Doraiswamy PM, Krishnan KR, et al. Hippocampal sulcal cavities on MRI: relationship to age and apolipoprotein E genotype. Neurology 2000;54:2150–53 [DOI] [PubMed] [Google Scholar]
- 2.De Leon MJ, Golomb J, George AE, et al. The radiologic prediction of Alzheimer’s disease: the atrophic hippocampal formation. AJNR Am J Neuroradiol 1993;14:897–906 [PMC free article] [PubMed] [Google Scholar]
- 3.Reisberg B, Ferris SH, De Leon MJ, et al. The global deterioration scale for assessment of primary degenerative dementia. Am J Psychiatry 1982;139:1136–39 [DOI] [PubMed] [Google Scholar]
- 4.McKhann G, Drachman D, Folstein M, et al. Clinical diagnosis of Alzheimer’s disease: report of the NINCDS-ADRDA Work Group under the auspices of Department of Health and Human Services Task Force on Alzheimer’s disease. Neurology 1984;34:939–44 [DOI] [PubMed] [Google Scholar]
- 5.Duvernoy HM. The human hippocampus—an atlas of applied anatomy. 1st ed. Munich: Bergman-Verlag;1988
- 6.Sasaki M, Sone M, Ehara S, et al. Hippocampal sulcus remnant: potential cause of change in signal intensity in the hippocampus. Radiology 1993;188:743–46 [DOI] [PubMed] [Google Scholar]
- 7.De Leon MJ, George AE, Golomb J, et al. Frequency of hippocampal formation atrophy in normal aging and Alzheimer’s disease. Neurobiol Aging 1997;18:1–11 [DOI] [PubMed] [Google Scholar]
- 8.Convit A, De Leon MJ, Golomb J, et al. Hippocampal atrophy in early Alzheimer’s disease: anatomic specificity and validation. Psychiatr Q 1993;64:371–87 [DOI] [PubMed] [Google Scholar]
- 9.De Leon MJ, George AE, Stylopoulos LA, et al. Early marker for Alzheimer’s disease: the atrophic hippocampus. Lancet 1989;16:672–73 [DOI] [PubMed] [Google Scholar]
- 10.George AE, De Leon MJ, Stylopoulos LA, et al. CT diagnostic features of Alzheimer disease: importance of the choroidal/hippocampal fissure complex. AJNR Am J Neuroradiol 1990;11:101–07 [PMC free article] [PubMed] [Google Scholar]
- 11.Golomb J, De Leon MJ, Kluger A, et al. Hippocampal atrophy in normal aging: an association with recent memory impairment. Arch Neurol 1993;50:967–76 [DOI] [PubMed] [Google Scholar]
- 12.Bartres-Faz D, Junque C, Clemente IC, et al. MRI and genetic correlates of cognitive function in elders with memory impairment. Neurobiol Aging 2001;22:449–59 [DOI] [PubMed] [Google Scholar]
- 13.Yoneoka Y, Kwee I, Fujii Y, et al. Criteria for normalcy of cavities observed within the adult hippocampus: high-resolution magnetic resonance imaging study on a 3.0-T system. J Neuroimaging 2002;12:231–35 [PubMed] [Google Scholar]