Abstract
SUMMARY: Two pediatric patients with diffuse pontine tumors underwent MR spectroscopic imaging pre- and postradiation. Choline/creatine (Cho/Cr) and Cho/N-acetylaspartate (NAA) ratios were elevated before treatment, with no MR imaging contrast enhancement. These ratios were further elevated at 2 posttreatment follow-up studies, despite signs of excellent clinical improvement at initial follow-up. This study suggests that MR spectroscopic imaging is more specific in assessing the aggressiveness of diffuse pontine tumors than conventional MR imaging and can serve as a valuable tool in early prognostication.
Diffuse infiltrative pontine tumors1 are the most dreaded cancers in pediatric neuro-oncology because of their historically poor prognosis.2 A number of previous 1H-MR spectroscopy studies have reported elevated ratios of choline compounds (Cho) over total creatine (Cr), Cho/Cr, and N-acetylaspartate (NAA), Cho/NAA, in tumor regions, compared with normal brain tissue,3,4 and a relationship between a high Cho/NAA ratio and a short duration of survival was demonstrated in heterogeneous groups of pediatric patients with brain tumors.4–7 To the best of our knowledge, there are no longitudinal MR spectroscopy studies in the literature evaluating diffuse pontine tumors in the pediatric age population.
Case Reports
Two pediatric patients (a boy, aged 7, patient 1; a girl, aged 10, patient 2) with diffuse pontine tumors underwent MR imaging and 1H-MR spectroscopic imaging of the brain and brain stem before treatment (baseline), approximately 5.5 weeks (follow-up 1) and 10 weeks (follow-up 2) after completion of radiation treatment.
Patient 1 had an atypical presentation initially. He presented only with headaches and had no neurologic deficits, which clinically suggested a less aggressive tumor. Patient 2 presented with multiple cranial neuropathies, typical symptoms of a diffuse pontine tumor. Patient 1 became more ill with time and developed multiple symptoms before the start of radiation therapy. Both patients received involved field external beam radiation therapy, and a total of 5400 cGy was delivered over 30 fractions. Clinically, both patients improved dramatically during and after the completion of radiation therapy despite worsening spectroscopy findings. As in most cases of diffuse pontine tumors, during a short period of time, these 2 patients both deteriorated and died of their disease. Patient 1 developed disseminated disease throughout the CSF with communicating hydrocephalus for which he received spinal radiation and a ventricular shunt. Leptomeningeal disease or CSF dissemination is uncommon in pediatric patients with diffuse pontine tumors but has been reported.8
MR Imaging/MR Spectroscopic Imaging Techniques
The MR imaging/MR spectroscopy studies were performed by using a whole-body 1.5T GE Excite scanner (GE Healthcare, Milwaukee, Wis) with the quadrature head coil as the transceiver. The MR imaging protocol includes precontrast sagittal and axial T1-weighted, axial T2-weighted, axial fluid-attenuated inversion recovery (FLAIR), axial diffusion-weighted, and postcontrast T1-weighted images in axial, sagittal, and coronal planes. The precontrast FLAIR images (TI/TE/TR, 2200/160/10 000 ms; 3-mm section thickness with no spacing between sections; 256 × 192 matrix size) served as scouts for placement of the rectangular volume of interest (VOI) of the 3D MR spectroscopic imaging data acquisition, which was performed after the precontrast MR imaging acquisition, but before gadolinium contrast medium administration. The 3D MR spectroscopic imaging VOI encompassed the lesion (hyperintense area on FLAIR images), as well as surrounding normal-appearing brain tissue. Outer volume saturation bands were applied around the VOI to avoid signal intensity contaminations caused by subcutaneous lipid, bone, and varying magnetic susceptibility effects that might compromise the quality of the spectra. A point-resolved spectroscopy sequence (PRESS) image with water suppression was used to collect the 3D 1H-MR spectroscopic imaging datasets with TR/TE, 1000/144 ms; 8-cm field of view; 10-mm section thickness, 3D phase-encoding (8 × 8 × 8, resulting in 1-mL nominal voxel size), 1000-Hz spectral width, and 2048 data points. The MR spectroscopic imaging VOI location, size, and acquisition parameters were kept the same for each patient during follow-up studies by using anatomic landmarks. The axial postcontrast T1-weighted MR images were collected with the same section number, location, and thickness as the axial FLAIR images.
FuncTool software (GE Healthcare) was used for MR spectroscopic imaging data processing. The raw MR spectroscopic imaging data were processed by using 10% shifted gaussian function with 1.25-Hz line broadening, Fourier transformation, phase corrections, and baseline corrections. The processed data were further interpolated in the superior-inferior direction to generate 1 MR spectroscopic image for overlay onto each 3-mm-thick FLAIR image. Major resonance peaks of NAA (2.0 ppm), Cr (3.0 ppm), and Cho (3.2 ppm) for each MR spectroscopic imaging voxel were assigned and numerically integrated to estimate peak areas. Peak area ratios were calculated for Cho/NAA and Cho/Cr.
An image processing software developed at our institution was used to trace and measure contrast enhancement volume (CEV) in the axial postcontrast T1-weighted images.
MR Imaging Findings
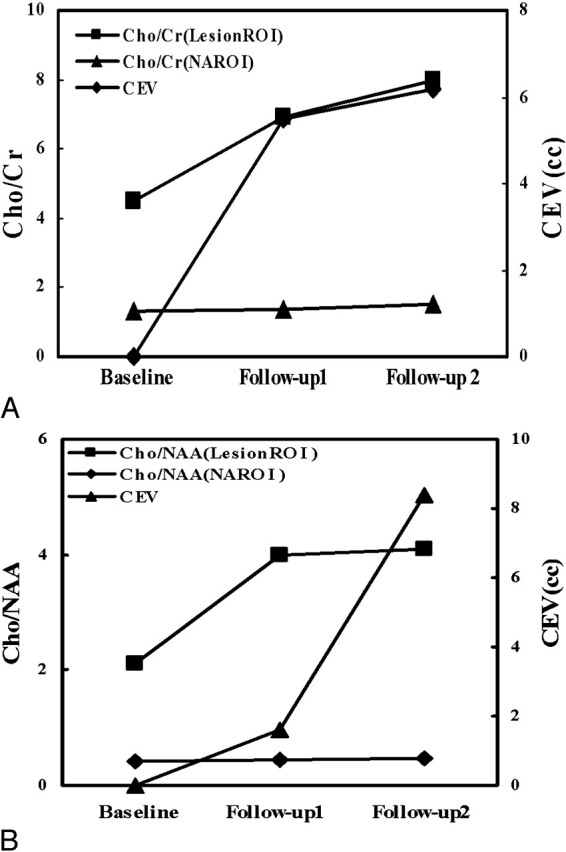
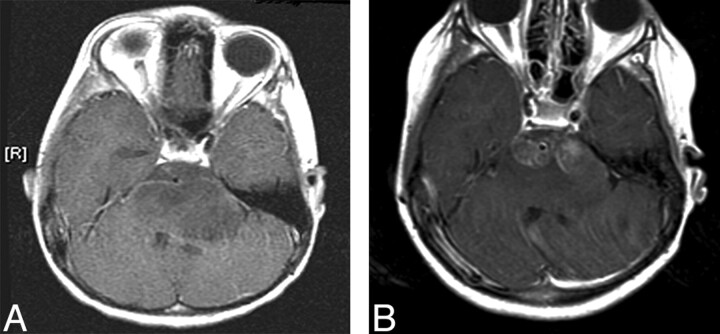
There was no contrast enhancement (CEV = 0) in the tumor regions of both patients at baseline. Figure 1A shows an axial postcontrast T1-weighted image of patient 1 at baseline, revealing no contrast enhancement. Contrast enhancement appeared at follow-up 1 for both patients (5.5 mL for patient 1 and 1.6 mL for patient 2). Figure 1B shows a postcontrast image of patient 1 at follow-up 1, demonstrating contrast enhancement in the pons. The CEVs further increased at follow-up 2 (6.6 mL for patient 1 and 8.5 mL for patient 2). The time courses of the CEV changes for both patients are depicted in Fig 4. By visual examination, the volume or the degree of expansion of the brain stem did not change for either patient from baseline to follow-up 2.
Fig 1.
Postcontrast axial T1-weighted MR image of patient 1 at baseline (A), showing no enhancement, and at follow-up 1 (B), revealing contrast enhancement in the tumor region.
Fig 4.

Scatterplots of Cho/Cr and Cho/NAA (left vertical axis) in the lesion region of interest and NAROI, and CEV (right vertical axis) at baseline, follow-up 1, and follow-up 2 for patients 1 (A) and 2 (B).
MR Spectroscopic Imaging Findings
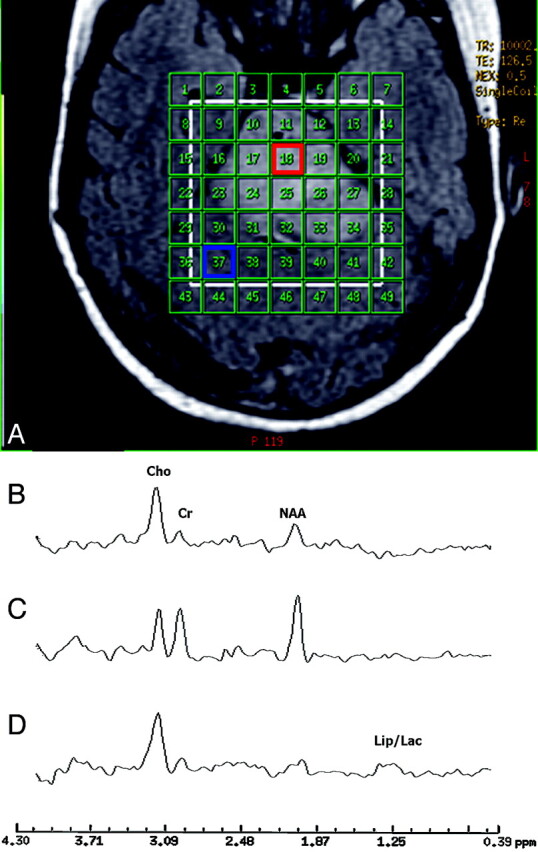
At the baseline, despite the fact that there was no MR imaging contrast enhancement in the tumor of either patient, the MR spectroscopic imaging data showed significantly elevated ratios of Cho/NAA and Cho/Cr in the tumor region compared with those of the normal-appearing brain tissue. Figure 2A shows the MR spectroscopic imaging grid (in green) overlaid on a FLAIR image of patient 1. The white box within the MR spectroscopic imaging grid is the region of excitation or the PRESS box for data acquisition. Figures 2B and 2C demonstrate the proton spectra obtained at baseline from a voxel located in the tumor and a voxel located in the normal-appearing region of interest (NAROI) in the parenchyma, respectively. The elevated Cho peak and reduced NAA peak seen in Fig 2B suggest the high-grade and aggressive nature of the tumor, which was not implicated by clinical examinations of patient 1 at this stage.
Fig 2.

(A) The region of excitation or PRESS box (white) and the phase-encoding matrix (green) for the MR spectroscopic imaging data acquisition are superimposed on an axial FLAIR MR image of patient 1 at baseline. The region of excitation encompasses the lesion (region of hyperintensity on the FLAIR image) and surrounding normal-appearing tissue. (B) Proton spectrum from a voxel in the tumor area (red box) of patient 1 at baseline. (C) Proton spectrum from a voxel in the normal-appearing tissue area (blue box) of patient 1 at baseline. (D) Proton spectrum obtained at follow-up 1 from the same voxel of origin for the spectrum shown in B.
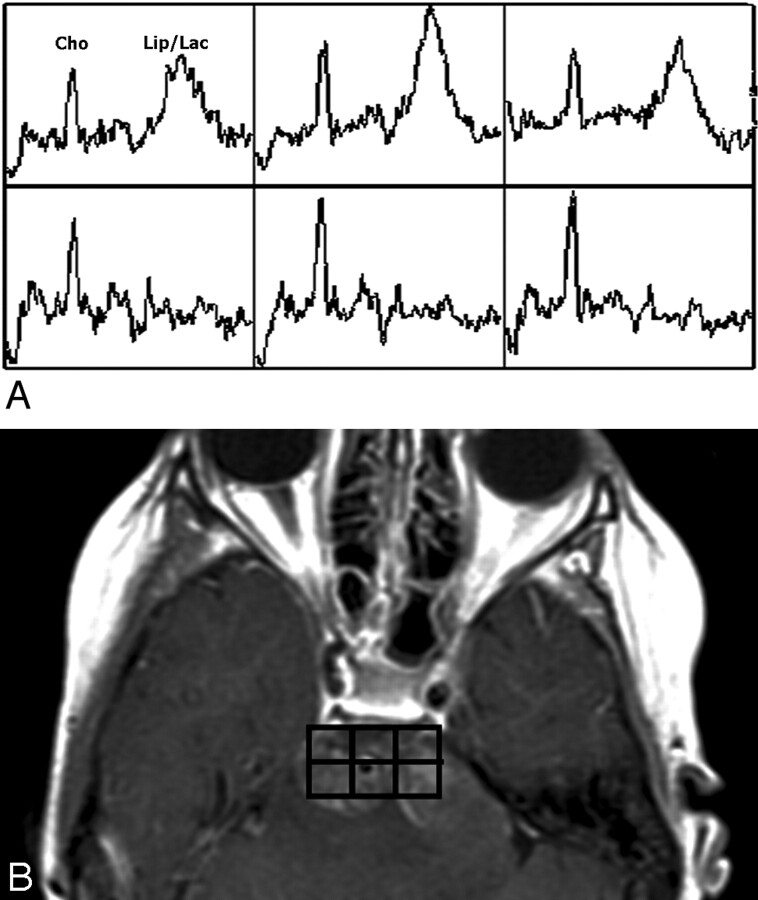
For both patients, Cho/Cr and Cho/NAA were further elevated to various degrees in different regions at follow-ups 1 and 2, indicating cancer progression despite radiation treatment and signs of excellent clinical improvement for both patients at follow-up 1. As an example, Fig 2D shows the proton MR spectrum of patient 1 acquired at follow-up 1 from the same voxel location of the spectrum shown in Fig 2B, exhibiting further elevation of the Cho peak and reduction of the NAA peak, as well as the detection of lipid (Lip) and lactate (Lac) peaks (1.3–1.4 ppm). Figure 3A demonstrates a zoomed (2 × 3) array of proton spectra collected at follow-up 1 from the tumor region of patient 1, where contrast enhancement was observed on the T1-weighted images as shown in Fig 3B. The spectra from a few voxels demonstrate increased Cho peaks and dominant Lip/Lac peaks. The detection of the latter may be due to necrosis caused by high tumor turnover rate and/or radiation treatment. The Lip/Lac peaks were not detected in the nearly identical voxel locations at baseline. This finding suggests that it is highly unlikely that the observation of these peaks was caused by susceptibility artifacts. The fact that Cho peak elevation was observed in addition to Lip/Lac peaks suggests poor prognosis despite clinical improvement. These spectra helped in identifying extensive viable tumor and disease progression, not radiation necrosis, as the dominant ongoing process.
Fig 3.
Zoomed 2 × 3 array of proton spectra (A) collected at follow-up 1 from the tumor region of patient 1, where MR imaging contrast enhancement was observed (B).
Figures 4A and 4B depict, during the time course of this longitudinal study, the changes of Cho/Cr and Cho/NAA in the same lesion voxel locations and the same NAROI voxel locations for patients 1 (Fig 2) and 2, respectively. The Cho/NAA and Cho/Cr ratios in the lesions demonstrated continuous rise from baseline to follow-up 2, whereas those in the NAROIs remained relatively unchanged during the time course of follow-up for both patients. Both patients showed clinical deterioration at follow-up 2 and died of the disease after follow-up 2.
Discussion
Diffusive pontine gliomas are a rare entity. Although most patients (75% or more) improved clinically during treatment, the median time to disease progression was only 6–9 months and median survival, less than 1 year.1 With only approximately 7% of patients achieving 2-year survival rates, the prognosis was worse than that for any other brain tumor in the pediatric age group.2 The diagnosis of these types of tumors relies on clinical abnormalities and MR imaging findings. MR spectroscopy studies may provide further help in diagnosis of a neoplastic lesion by revealing increased metabolic ratios of Cho/Cr and/or Cho/NAA,4,9 representing a high-grade and aggressive tumor.
This longitudinal 1H-MR spectroscopic imaging study shows that MR spectroscopy is a useful diagnostic tool for assessment of pediatric diffuse pontine tumor aggressiveness/grade at an early stage, well before any MR imaging contrast enhancement was observed. After the radiation treatment, both patients showed excellent clinical improvement at follow-up 1. However, the MR spectroscopic imaging studies performed at that time revealed contradictory findings: further elevations of Cho/Cr and Cho/NAA in the tumors, indicating progression of the tumor. This was confirmed by the deteriorations of the patients’ clinical conditions at follow-up 2. The MR spectroscopic imaging findings were clear and consistent with the natural history of these tumors. The transient improvement in clinical symptoms may have been due to partial response and decrease in edema.
The tumors showed regional MR imaging contrast enhancement during the follow-up studies. It is often difficult to assess conventional imaging findings in these patients after radiation therapy. Typically images of the patients develop contrast enhancement, which can be attributed to radiation effect/necrosis and/or disease progression with breakdown of the blood-brain barrier. Because radiation necrosis cannot be readily differentiated from tumor progression on the basis of MR imaging contrast enhancement, the MR spectroscopic imaging measurement was valuable in demonstrating increased Cho/NAA and Cho/Cr ratios in enhancing and nonenhancing regions, consistent with tumor progression and predicting clinical deterioration. Furthermore, by showing stable metabolite levels in adjacent NAROIs during the time course of follow-up, the MR spectroscopic imaging measurement provided evidence against radiation-induced metabolic alterations.
Although the number of patients is limited, this longitudinal study suggests that compared with other routine and conventional MR imaging techniques, 1H-MR spectroscopic imaging can provide an early estimate of tumor grade/aggressiveness in pediatric patients with diffuse pontine tumors and can also serve as a better indicator or a surrogate marker in early prediction of treatment failure and cancer progression. Inclusion of proton MR spectroscopic imaging in radiologic examinations may be of critical importance in clinical management of this type of patient, who usually has a very poor prognosis and short survival duration. Early detection of cancer progression may lead to alteration of therapy regimen or may allow the patient to be a candidate for investigational treatment protocols at an earlier stage, thus possibly prolonging the duration of survival.
Footnotes
Part of this work was presented at the annual meetings of the International Society for Magnetic Resonance in Medicine, Miami, Fla, May 9–14, 2005, and the American Society of Neuroradiology, Toronto, May 22–27, 2005.
References
- 1.Freeman CR, Farmer JP. Pediatric brain stem gliomas: a review. Int J Radiat Oncol Biol Phys 1998;40:265–71 [DOI] [PubMed] [Google Scholar]
- 2.Mandell LR, Kadota R, Freeman C, et al. There is no role for hyperfractionated radiotherapy in the management of children with newly diagnosed diffuse intrinsic brainstem tumors: results of a pediatric oncology hyperfractionated radiotherapy. Int J Radiat Oncol Biol Phys 1999;43:959–64 [DOI] [PubMed] [Google Scholar]
- 3.Krieger MD, Bluml S, McComb JG. Magnetic resonance spectroscopy of atypical diffuse pontine masses. Neurosurg Focus 2003;15:1–4 [DOI] [PubMed] [Google Scholar]
- 4.Moore GJ. Proton magnetic resonance spectroscopy in pediatric neuroradiology. Pediatr Radiol 1998;28:805–14 [DOI] [PubMed] [Google Scholar]
- 5.Norfray JF, Tomita T, Byrd SE, et al. Clinical impact of MR spectroscopy when MR imaging is indeterminate for pediatric brain tumors. AJR Am J Roentgenol 1999;173:119–25 [DOI] [PubMed] [Google Scholar]
- 6.Taylor JS, Ogg RJ, Langston JW. Proton MR spectroscopy of pediatric brain tumors. Pediatr Radiol 1998;8:753–79 [PubMed] [Google Scholar]
- 7.Cecil KM, Jones BV. Magnetic resonance spectroscopy of the pediatric brain. Top Magn Reson Imaging 2001;12:435–52 [DOI] [PubMed] [Google Scholar]
- 8.Motoyama Y, Ogi S, Nabeshima S. Pontine glioblastoma multiforme initially presenting with leptomeningeal gliomatosis. Neurol Med Chir (Tokyo) 2002;42:309–13 [DOI] [PubMed] [Google Scholar]
- 9.Wang ZJ, Zimmerman RA. Proton MR spectroscopy of pediatric brain metabolic disorders. Neuroimaging Clin N Am 1998;8:781–807 [PubMed] [Google Scholar]


