

Abstract
BACKGROUND AND PURPOSE: The purpose of this study was to examine the reproducibility of functional MR imaging (fMRI) activation (volume and laterality) within both inferior frontal and temporoparietal regions of interest for both receptive and expressive language tasks.
METHODS: Ten healthy volunteers participated in fMRI experiments for 6 language tasks: verb generation, confrontation naming, semantic decision making, visual sentence comprehension, auditory sentence comprehension, and story listening. Each subject was scanned during 2 separate sessions separated by a minimum of 4 weeks. Laterality of activation was defined by laterality indices (LIs), which were calculated by 2 methods: one method based on the measured volume of activation and the other method based on the F statistic of the activation. Reproducibility was calculated by using concurrence ratios for the volume of activation (Roverlap, Rvolume) and test-retest correlation for LIs.
RESULTS: All tasks generated reproducible LIs within at least one of the regions of interest, but verb generation produced the highest test-retest correlations (r = 0.99) within both regions of interest. Verb generation was associated with the highest average concurrence ratios within the inferior frontal region of interest (Roverlap = 45.2; Rvolume = 70.9). In general, the concurrence ratios were lower within the temporoparietal region of interest compared with the inferior frontal region of interest. LIs calculated with F statistics were more reproducible than the LIs calculated by activation volume.
CONCLUSION: fMRI is able to provide reproducible LIs in both inferior frontal and temporoparietal regions for assessing hemispheric dominance in language processing. The volume of activation, especially within the temporoparietal regions, is less reproducible than the laterality of activation, so the former should be used with caution.
The most common clinical application for functional MR imaging (fMRI) of language processing is the determination of language dominance during the presurgical evaluation of temporal lobe epilepsy (TLE) patients. Most studies evaluating language tasks for this purpose use large regions of interest covering both inferior frontal and posterior regions combined.1–8 Activation of temporal regions, however, may be more appropriate for mapping patients with a posterior temporoparietal seizure focus and for predicting language changes after anterior temporal lobectomy.9–11 In addition, expressive and receptive language functions may be differentially lateralized in patients with epilepsy.12 Fernandez et al13 reported the test-retest correlation of laterality indices (LIs) within a temporoparietal region to be lower than within an inferior frontal region. Unfortunately, that study was limited to the evaluation of only one semantic decision task. Tasks that focus on receptive language processing could result in higher test-retest reproducibility of fMRI activation in temporoparietal regions.13
Volume of activation is another fMRI parameter, in addition to lateralization indices, that has begun to be used in some clinical applications. For example, a number of investigators have begun to use fMRI to examine change in activation volume during the course of natural recovery or direct intervention following a neurologic insult (eg, stroke).14–21 The ability to detect small changes in activation volume related to the cortical representation of language processing is dependent on a high degree of intrasubject test-retest reproducibility of activation volume.
The purpose of this study was to examine the intrasubject test-retest reproducibility of fMRI activation (volume and laterality) within both inferior frontal and temporoparietal regions of interest for 6 language tasks with differing degrees of receptive and expressive language requirements. We also examined the intrasubject test-retest reproducibility of combined datasets. In general, combined datasets are presumed to be able to yield higher test-retest reproducibility because of the increase in statistical degrees of freedom.5,22
A second goal of this study was to evaluate the influence of the method for calculating the LIs on its reproducibility. LIs are commonly calculated by using a formula based on the number of voxels above a specified threshold (volume of activation) within a given region of interest.1, 2, 7, 9, 10, 23–26 The volume of fMRI activation and the calculated LIs based on volume of activation have been found to vary widely depending on the chosen threshold.27–29 LIs that are calculated so that they are less dependent on thresholding may be more reproducible than those that are based on a single threshold. We compared 2 different methods for calculating LIs: one method is dependent on a single threshold, and the other is less dependent on thresholds.
Methods
The study was approved by the University of California—Davis Human Subjects Protection Committee, and written informed consent was obtained from all participants. Ten healthy right-handed subjects (average age, 34.7 years; 6 women) performed the 6 language tasks on 2 separate days (average interval between sessions, 25.3 weeks; range, 4-53 weeks). Tasks were incorporated into block design paradigms with experimental conditions lasting 12–30 seconds (depending on the specific task) alternating with baseline conditions of similar durations. Visual stimuli were projected onto a screen located at the end of the scanner patient table by using the Presentation software package (www.neurobs.com), and the subject viewed the screen via a mirror on top of the head coil. Auditory stimuli were delivered to the subject by using the same software package through MR imaging–compatible headphones (Resonance Technologies, Northridge, Calif). Movement of the subject’s head was restrained by using a moldable air bag (Vac-Fix; Bionix, Toledo, Ohio).
The following 6 language tasks were used in the study because they are believed to test a full range of language functions thought to involve both frontal and temporoparietal language areas: confrontation naming, verb generation, visually presented sentence comprehension, orally presented sentence comprehension, semantic decision making, and story listening.
In the experimental condition for the confrontation-naming task, subjects viewed line drawings from the Boston Naming Test30 every 3 seconds and were instructed to name the drawing covertly. The baseline condition for this task consisted of the presentation of sets of vertical, horizontal, diagonal, and crossing lines, during which subjects were instructed to attend to these images closely.
In the experimental condition for the semantic decision task, subjects were visually presented a different word every 3 seconds and were instructed to decide covertly whether the meaning of each word represented an abstract or concrete concept. For the baseline condition, strings of either upper- or lowercase letters were presented and subjects were instructed to decide whether the letters were upper- or lowercase.
The experimental condition of the visual sentence-comprehension task consisted of simple 3–4-word sentences presented every 3 seconds. The experimental condition consisted of sentences that were syntactically and semantically correct, as well as sentences that had either a semantic or syntactic error. The subjects were instructed to read each sentence covertly and decide covertly whether it was both syntactically and semantically correct. The baseline condition consisted of a visual display of forward and backward slashes of similar length as the sentences, and subjects were instructed to attend to these strings of lines.
For the auditory tasks, the baseline condition consisted of words or sentences played backwards and subjects were instructed to listen closely to these stimuli.9, 31, 32 The experimental condition in the audio sentence-comprehension task was the same as used in the visual reading sentence-comprehension task except the subjects listened to rather than read the sentences. The experimental condition for story listening consisted of auditory passages containing several sentences and subjects were instructed to listen to each passage.
Finally, the auditory nouns for the verb-generation task were presented every 3 seconds, and the subjects were instructed to generate an action verb covertly for each noun presented. To help ensure that participants were adequately attending to the baseline conditions, the duration of baseline conditions were variable to make it difficult for the subject to anticipate the switch from baseline to experimental condition, and no cues were provided to indicate or suggest that the switch was about to occur.
Scanning and Data Analysis
During the fMRI tasks, 21 contiguous 5-mm axial sections were acquired with a gradient-echo, echo-planar imaging (EPI) sequence (TR, 2000 milliseconds; TE, 50 milliseconds; flip angle, 90°; field of view [FOV], 22 cm; matrix, 64 × 64, using a 1.5T GE Signa NV/I MR imaging system, LX version 8.2.5 [GE Medical Systems, Milwaukee, Wis]). In each functional scan, a dataset consisting of 196 image volumes was acquired during 384 seconds (ie, 2 seconds per volume). The first 4 image volumes were removed from the dataset to ensure that image intensity variations due to the magnetization approach to dynamic equilibrium were not included in the functional analysis. High-resolution structural images were obtained for use as anatomic references by using a 3D T1-weighted fast-spoiled gradient recalled-echo sequence (section thickness, 1.2 mm; FOV = 22 cm; 256 × 256 × 124; TE, 1.8 milliseconds; TR, 8.7 milliseconds; flip angle, 15°; bandwidth, 15.63 kHz).
The echo-planar images were reconstructed by using standard Fourier transformation combined with image-phase correction33, 34 to reduce the N/2 ghost artifact. The images were registered to the third image in the fMRI time series with a 3D registration algorithm.35 All statistical analyses were performed with the AFNI analysis and display software package.36 Statistical maps were generated by using a multiple regression algorithm with a boxcar (6-second lag) reference waveform, and linear trends were included as covariates. Activation maps were created by applying a P value and cluster size threshold37, 38 to the statistical maps. The program AlphaSim within AFNI was used to estimate the cluster size necessary to achieve a significance level <.05 with an individual voxel threshold of P < 1.0 × 10⁻⁴. The statistical maps were transformed to Talairach coordinates39 with linear interpolation by using a transformation36 derived from the 3D anatomic images acquired at the same scanning session as the functional images used to generate the statistical maps. “Combination” datasets were constructed by concatenating the single datasets from the different tasks. One combination set consisted of the datasets from all the tasks and 2 other combination datasets contained the data from 3 of the 6 tasks; one set consisting of the 3 language tasks involving single word or picture processing (verb generation, semantic decision, and confrontation naming) and the other set consisting of the 3 tasks involving sentence processing (oral sentence comprehension, visually presented sentence comprehension, and story listening). The combination datasets were analyzed in the same manner as the individual datasets, except that the baseline and linear trends used in the regression analysis were calculated separately for each dataset.
Variables estimating the head motion and the temporal signal intensity–to-noise ratio (SNR) were calculated for each single dataset. These variables were used to estimate the quality of the images for each subject and each fMRI acquisition. The variable “maximum head motion” was defined as the maximum range of head displacement in any one direction, as revealed by the motion registration algorithm. To estimate whether significant head motion was associated with the experimental paradigm, a correlation analysis was performed between the experimental paradigm and the time series of the values of the motion registration parameters. For a single voxel, temporal SNR is defined as the average signal intensity of the time series divided by the standard deviation calculated across that times series. Two temporal SNR estimates, each based on a different collection of voxels, were calculated for each functional scan. To calculate the temporal SNR estimates, a mask identifying “brain-only” voxels was created for the image volume and the SD of the time series for each brain voxel was calculated. Then, a 9-bin histogram of the SDs for the brain voxels was created. The first temporal SNR estimate, denoted tSNRmed, was defined as the average temporal SNR of all the voxels falling into the median bin. The second estimate, tSNRlow, was defined as the average temporal SNR for the 256 voxels with the lowest SD. In addition, regression analysis was used to investigate a possible relationship between head motion and these temporal SNR estimates.
Anatomic Regions of Interest
Anatomic regions of interest for the inferior frontal and temporoparietal language regions were hand drawn according to Talairach coordinates40 by using the Talairach atlas.41 The inferior frontal region of interest covered the inferior frontal gyrus (BA 44–47), and the temporoparietal region of interest covered the supramarginal, inferior parietal, middle temporal, and superior temporal gyri (BA 21, 22, 39). The regions of interest were created from a single Talairach image and applied to all of the subjects.
LIs
LIs can range from 1.0 (strong left hemisphere dominance) to −1.0 (strong right hemisphere dominance). Four LIs were calculated for each acquisition. Two LIs, denoted LIVOL1, and LIVOL2, were derived from the volume of activation within each region of interest by using the formula: LIVOLUME = (VOLleft − VOLright) / (VOLleft + VOLright). The volume of activation for LIVOL1 and LIVOL2 were calculated by using the P value thresholds of P < 1.0 × 10⁻⁴and P < 1.0 × 10⁻³, respectively. For the other 2 laterality estimates, instead of weighting all voxels above the chosen threshold equally, each voxel was weighted in proportion to its F statistic generated from the regression analysis.13 The LI was calculated as the sum of the F statistics from voxels above the chosen threshold in the left region of interest, minus the sum in the right region of interest, and then that difference was divided by the sum of the F statistics across both regions of interest. The first LI based on F statistics (LIF) was calculated by using a P value threshold of P < .01. For the other F-based LI, LIs were calculated for a range of P value thresholds starting at P < .01 and progressing to P < 1.0 × 10⁻⁶. The final index (LIF-Ave) assigned to each region of interest was defined to be the average of the LIs over this range of thresholds. Paired t test comparisons were made for all LIs generated by the 2 methods.
Test-Retest Reproducibility
Test-retest reproducibility of laterality of activation was evaluated by examining the test-retest correlation of LIs between 2 separate imaging sessions. Test-retest reproducibility of the volume of activation was evaluated by calculating 2 concurrence ratios for activation, denoted Rvolume and Roverlap.13, 22, 32, 42–46 Rvolume measures only the volume of activation, whereas Roverlap combines location of activation and volume of activation into a single test-retest reproducibility variable. Roverlap is particularly valuable in evaluating test-retest reproducibility in fMRI, because fMRI activation maps are often interpreted qualitatively by both location and volume of activation. The concurrence ratios for volume and overlap (in percentage) were calculated within the regions of interest by using the formulas from Rombouts et al47:
 |
where VOLUME1 and VOLUME2 are the activation volumes within the given region of interest for the first and second session, respectively, VOLUMEmin is the smallest of the 2 volumes, VOLUME1 and VOLUME2, and VOLUMEoverlap is the overlap of activation between sessions. All volumes were calculated from the spatially normalized datasets. Analysis of variance tests were used to determine the effect of task and region of interest on the Rvolume and Roverlap values.
Results
Test-Retest Reproducibility
Figure 1 shows the LIs and the reproducibility results for the LIs by using the LIF-Ave method. The verb-generation task showed the highest degree of left hemisphere lateralization. The test-retest correlations for LI were high within both regions of interest. The test-retest correlations were especially high (r ≥ 0.90) for the verb-generation and visual sentence-comprehension tasks within both regions of interest. The test-retest correlations were also >0.90 for the story-listening task within the temporoparietal region of interest. The combination of tasks also produced test-retest correlations >0.90 for both regions. The test-retest correlations for the combinations of tasks, however, were not better than for the verb-generation task. In addition, although the story-listening task yielded reproducible LIs within the temporoparietal region of interest, the test-retest correlation within the inferior frontal region of interest was low.
Fig 1.
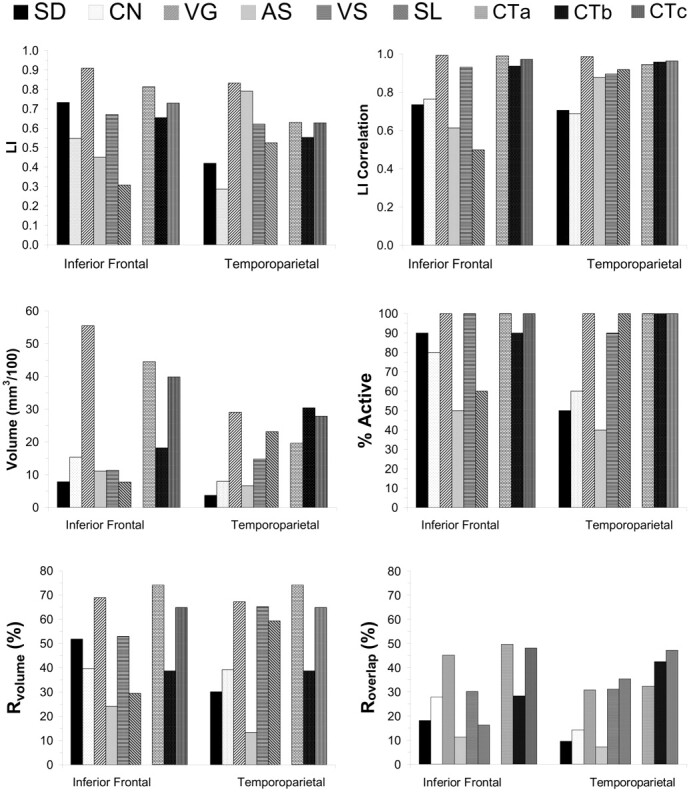
Reproducibility for fMRI activation: LI and volume.
Top row, The LI and test-retest correlation of LI for all tasks and task combinations within both regions of interest. Middle row, The average volume of activation and % subjects with activation during both imaging sessions within the language dominant hemisphere for both regions of interest. Bottom row, Average concurrence ratios (Rvolume and Roverlap) within the language dominant hemisphere for both regions of interest. SD = semantic decision; CN = confrontation naming; VG = verb generation; AS = audio sentence comprehension; VS = visual sentence comprehension; SL = story listening; CTa = combination of SD, CN, and VG; CTb = combination of AS,VS, and SL; Ctc = combination of all tasks.
Figure 1 also shows reproducibility results for the volume of activation. There was not a significant session effect; for all tasks, the average volume of activation during the first session was not significantly different from the average activation during the retest session. However, verb generation and visual sentence comprehension were the only single tasks that showed activation within the inferior frontal and temporoparietal regions of interest for both scanning sessions in at least 90% of the subjects. All of the combination datasets also showed activation at both scanning sessions in at least 90% of the subjects.
There was a significant task effect (P = 2.3 × 10⁻⁵) for Rvolume, but the main effect for region of interest (P = .65) and the interaction between task and region of interest (P = .26) were not significant. The verb-generation task produced the largest volume of activation within the inferior frontal region of interest and the largest Rvolume within both regions of interest. The combination dataset consisting of verb-generation, confrontation-naming, and semantic decision making tasks produced a slightly higher Rvolume within the inferior frontal region of interest, as compared with the best single tasks. Furthermore, all 3 combination datasets produced a slightly higher Rvolume within the temporoparietal region of interest, compared with the best single tasks.
There was a significant task (P = 6.2 × 10⁻⁶) effect for Roverlap but the region of interest effect (P = .40) and the interaction between region of interest and task (P = .06) was not significant. Of the 6 tasks, verb generation produced the highest average overlap of activation within the inferior frontal region of interest and produced Roverlap values within the temporoparietal region of interest that were equivalent to those produced by the story-listening and visually presented sentence-comprehension tasks within the same region of interest. Visual sentence comprehension and story listening were the only tasks to produce greater average overlap of activation within the temporoparietal region of interest compared with the inferior frontal region of interest. For the combination sets, the combination of the sentence-comprehension tasks with the story-listening task also produced a higher Roverlap within the temporoparietal region of interest compared with the inferior frontal region of interest.
Figure 2 shows examples of activation, including overlap, for the verb-generation task from 2 subjects. The Table lists the activation and test-retest measurements for each example in Fig 2. For subject 1, the activation was strongly left lateralized during both sessions and both concurrence ratios were above average. Most of the nonoverlapping activation occurred adjacent to and was contiguous with the overlapping activation. For subject 2, the activation was lateralized to the right hemisphere during both scanning sessions. During the second session, the volume of activation was approximately 3 times greater than for the first imaging session, whereas the LIs calculated with the F statistic average method were almost identical.
Test–retest results for example subjects in Figure 2
| Subject 1 |
Subject 2 |
||||
|---|---|---|---|---|---|
| S 1 | S 2 | S 1 | S 2 | ||
| fMRI acquisition quality | tSNRmed | 107.0 | 100.9 | 102.8 | 93.9 |
| Motion (mm) | 1.08 | 0.58 | 0.38 | 0.34 | |
| Motion correl* | 0.06 | 0.12 | 0.14 | 0.20 | |
| Inferior frontal ROI | LIF-Ave | 0.94 | 0.88 | −0.83 | −0.80 |
| LIVOL | 0.87 | 0.70 | −0.59 | −0.47 | |
| Volume (mm3) | 4102 | 3893 | 2506 | 5881 | |
| Rvolume | 97.4 | 59.8 | |||
| Roverlap | 63.2 | 37.6 | |||
| Temporoparietal ROI | LIF-Ave | 0.98 | 0.90 | −0.89 | −0.92 |
| LIVOL | 1.00 | 1.00 | −0.65 | −0.76 | |
| Volume (mm3) | 1644 | 1506 | 2431 | 5364 | |
| Rvolume | 95.6 | 62.4 | |||
| Roverlap | 58.2 | 35.2 | |||
Note:— fMRI indicates functional MR imaging; ROI, region of interest; tSNRmed, first temporal signal-to-noise ratio estimate; LIF-Ave, LI calculated using F values; LIVOL, LI calculated using activation volume. Rvolume, reproducibility of volume of activation; Roverlap, reproducibility of location of activation and volume of activation combined. Volume and concordance ratios are for the language dominant hemisphere.
Correlation between head motion and experimental paradigm.
Fig 2.
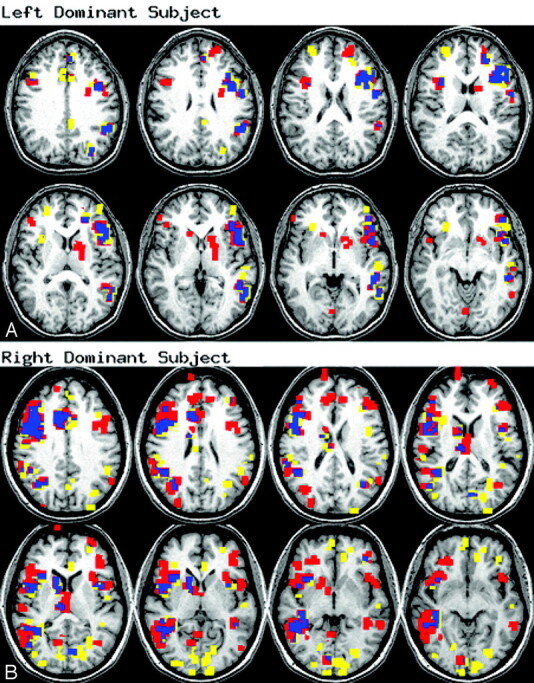
Verb-generation overlap.
Activation for the verb-generation task in 2 example subjects. Images are in radiologic view. Yellow = session 1 only; red = session 2 only; blue = overlap between sessions. Activation information provided in the Table.
Comparison of LI Calculation Methods
LI calculations based on volume of activation were not possible for subjects who did not show any activation above the chosen P value threshold (“% Active” in Fig 1). Paired t tests revealed significantly higher test-retest correlations with LIF-Ave compared with either LIVOL1 (P = .02) or LIVOL2 (P = .03). In addition, LIF resulted in significantly higher test-retest correlations compared with LIVOL1 (P = .04), or LIVOL2 (P = .01). In most healthy, right-handed individuals, language functions are mediated predominantly by inferior frontal and temporoparietal regions of the left hemisphere.48 One subject, however, showed strong right lateralization. The LIs for this subject were not included in the calculations of the average LI for each task. The subject was included in the calculation of all test-retest indices. Overall, LIF-Ave produced higher LIs compared with the other methods, and this difference was significant for LIVOL1 and LIVOL2 (P < .05; Wilcoxon signed ranks test).
Motion and Temporal SNR
Figure 3 shows the line estimate representing the association between the temporal SNR of a dataset and the maximum head motion detected during the acquisition of that dataset. The correlation between the maximum head motions and the temporal SNR estimates was significant for tSNRmed (P = 2.2 × 10⁻⁶) but not for tSNRlow (P = .13). The average maximum head motion (ie, average of the maximum displacements) for all acquisitions was 0.52 ± 0.25 mm, and the average temporal SNR estimates were 99.5 ± 11.2 for tSNRmed and 143.8 ± 14.7 for tSNRlow.
Fig 3.

Temporal SNR versus max head motion. Regression analyses: tSNRmed: r = 0.42; P = 2.2 × 10⁻⁶; tSNRlow: r = 0.14; P = .13. White = tSNRlow; black = tSNRmed.
Discussion
The test-retest correlations for language LIs were very high within both inferior frontal and temporoparietal regions. Some investigators have predicted that for anterior temporal lobectomy candidates the evaluation of posterior temporal language function may be more useful than the evaluation of inferior frontal language function.9–11 Of the tasks evaluated in this study, verb generation would be the best task for the clinical evaluation of language dominance, because this task resulted in highly reproducible lateralized activation within both posterior temporal and inferior frontal regions in healthy individuals. A previous study13 using a single semantic decision task reported that the test-retest correlation of LIs within a temporoparietal region was lower than within an inferior frontal region. The current study, however, found higher test-retest correlations for LIs within temporoparietal regions for 3 of the 6 tasks. As such, it appears that the reproducibility of an LI in a given region of interest depends on the particular language task used. The inclusion of a sentence-comprehension or story-listening task, along with the verb-generation task, may be useful in cases where the evaluation of posterior temporal regions is required.
A significant finding from this study regarding LIs was that the LI test-retest correlation values were significantly better when using the calculation method based on F statistics compared with the method based on volume of activation. By weighting the above-threshold voxels with a measure of the strength of the activation, as with the F statistic–based method, high LIs can be obtained even if a low threshold is implemented. The benefit of LF-Ave is due to the difficulty in determining optimal thresholds5, 13, 22, 27; LF-Ave avoids these problems by averaging results over a range of P value thresholds.
For fMRI activation volume, the ability to detect activation changes in longitudinal studies is reduced when there is significant intrasubject variability. The high intrasubject variability in fMRI activation volume found in this study, as measured by concordance ratios, indicates that small cortical changes in longitudinal studies will be difficult or impossible to detect. This high intrasubject variability in fMRI activation volume is not exclusive to language tasks, as the concordance ratios for verb generation were similar to other studies of primary cortices.44, 47
One important factor affecting fMRI volume measurements is variability in the orientation of the subject’s head in each scanning session. All subjects were scanned in 2 separate sessions, and hence the orientation between axial section locations and the brain tissue are not expected to be the same for each session. In addition, differences in EPI image appearance due to section excitation profiles, and differences in distortion due to magnetic susceptibility, are caused by differences in the position of the head relative to the main magnetic field and cannot be corrected in postprocessing.
Subject motion and temporal noise are factors that could also influence the test-retest reproducibility of the activation. Head motion that is correlated to the experimental paradigm can result in an increase in the number of false-positive detections. For example, the correlation between the head motion and the experimental paradigm for subject 2 (see Fig 2, Table) was much higher in the second session compared with the first session. The increased correlated motion in the second scanning sessions cannot be excluded as an explanation for the overall 3-fold increase in activation detected in the second scanning session. Head motion that is uncorrelated to the experimental paradigm can contribute to the fMRI temporal noise (Fig 3) and generally will lead to a decrease in the number of activated voxels (ie, an increase in false-negatives). High levels of temporal noise may be sufficiently greater than the task-related blood oxygen level–dependent signal intensity change and result in the inability to detect localized regions of true activation.
Two different estimates for temporal SNR were evaluated in this study. The tSNRlow is calculated based on a fixed number of voxels, 256, whose time series have the smallest level of temporal fluctuations of all voxels in the brain. This criterion leads to selection of voxels principally located in deep white matter that have less temporal noise originating from physiologic or motion-related sources. Alternatively, the method for calculating tSNRmed does not seek out voxels with minimum noise and hence is more sensitive to head motion and physiologic noise. The increased sensitivity to head motion is illustrated by the strong correlation between head motion and temporal SNR in Fig 3. For these reasons tSNRmed serves as a more useful estimate of temporal SNR in a clinical setting.
Improvements in the reproducibility of activation volume may be possible with the combination of different carefully selected tasks, or by repeated scans by using a single carefully selected task. The concordance ratios in this study, however, did not improve significantly with the concatenation of multiple datasets. In most cases, the concordance ratios from the combination datasets were only slightly improved relative to those values from the dataset of the best single tasks. It is likely that repeating and combining datasets by using the best single task—for example, verb generation—would yield higher reproducibility results than a some combination of different tasks used this study. Combining different tasks may provide an advantage of increasing sensitivity to activation in brain areas that activate in all of the included tasks, whereas decreasing the sensitivity to activation in brain areas that activate with only one of the tasks.5
Conclusion
For fMRI to be useful as a clinical diagnostic tool of language, test-retest reproducibility of activation must first be demonstrated. This study showed that fMRI can provide reproducible LIs within temporoparietal regions as well as within inferior frontal regions. The degree of reproducibility, especially within temporoparietal regions, was dependent on the fMRI task; however, quantitative measures of the volume of activation were less reproducible than quantitative measures of laterality. The low reproducibility of activation volume limits the utility of fMRI for evaluation of activation volume changes in longitudinal studies.
Footnotes
This work was presented at the 32nd annual meeting of the International Neuropsychological Society, Brisbane, Australia, July 7–10, 2004.
References
- 1.Binder JR, Swanson SJ, Hammeke TA, et al. Determination of language dominance using functional MRI: a comparison with the Wada test. Neurology 1996;46:978–84 [DOI] [PubMed] [Google Scholar]
- 2.van der Kallen BF, Morris GL, Yetkin FZ, et al. Hemispheric language dominance studied with functional MR: preliminary study in healthy volunteers and patients with epilepsy. AJNR Am J Neuroradiol 1998;19:73–77 [PMC free article] [PubMed] [Google Scholar]
- 3.Springer JA, Binder JR, Hammeke TA, et al. Language dominance in neurologically normal and epilepsy subjects: a functional MRI study. Brain 1999;122:2033–46 [DOI] [PubMed] [Google Scholar]
- 4.Benson RR, FitzGerald DB, LeSueur LL, et al. Language dominance determined by whole brain functional MRI in patients with brain lesions. Neurology 1999;52:798–809 [DOI] [PubMed] [Google Scholar]
- 5.Ramsey NF, Sommer IE, Rutten GJ, et al. Combined analysis of language tasks in fMRI improves assessment of hemispheric dominance for language functions in individual subjects. Neuroimage 2001;13:719–33 [DOI] [PubMed] [Google Scholar]
- 6.Carpentier A, Pugh KR, Westerveld M, et al. Functional MRI of language processing: dependence on input modality and temporal lobe epilepsy. Epilepsia 2001;42:1241–54 [DOI] [PubMed] [Google Scholar]
- 7.Sabbah P, Chassoux F, Leveque C, et al. Functional MR imaging in assessment of language dominance in epileptic patients. Neuroimage 2003;18:460–67 [DOI] [PubMed] [Google Scholar]
- 8.Aldenkamp AP, Boon PA, Deblaere K, et al. Usefulness of language and memory testing during intracarotid amobarbital testing: observations from an fMRI study. Acta Neurol Scand 2003;108:147–52 [DOI] [PubMed] [Google Scholar]
- 9.Lehericy S, Cohen L, Bazin B, et al. Functional MR evaluation of temporal and frontal language dominance compared with the Wada test. Neurology 2000;54:1625–33 [DOI] [PubMed] [Google Scholar]
- 10.Sabsevitz DS, Swanson SJ, Hammeke TA, et al. Use of preoperative functional neuroimaging to predict language deficits from epilepsy surgery. Neurology 2003;60:1788–92 [DOI] [PubMed] [Google Scholar]
- 11.Vingerhoets G, Deblaere K, Backes WH, et al. Lessons for neuropsychology from functional MRI in patients with epilepsy. Epilepsy Behav 2004;5(suppl 1):S81–89 [DOI] [PubMed] [Google Scholar]
- 12.Kurthen M, Helmstaedter C, Linke DB, et al. Quantitative and qualitative evaluation of patterns of cerebral language dominance: an amobarbital study. Brain Lang 1994;46:536–64 [DOI] [PubMed] [Google Scholar]
- 13.Fernandez G, Specht K, Weis S, et al. Intrasubject reproducibility of presurgical language lateralization and mapping using fMRI. Neurology 2003;60:969–75 [DOI] [PubMed] [Google Scholar]
- 14.Feydy A, Carlier R, Roby-Brami A, et al. Longitudinal study of motor recovery after stroke: recruitment and focusing of brain activation. Stroke 2002;33:1610–17 [DOI] [PubMed] [Google Scholar]
- 15.Heiss WD, Thiel A, Kessler J, et al. Disturbance and recovery of language function: correlates in PET activation studies. Neuroimage 2003;20(suppl 1):S42–49 [DOI] [PubMed] [Google Scholar]
- 16.Fernandez B, Cardebat D, Demonet JF, et al. Functional MRI follow-up study of language processes in healthy subjects and during recovery in a case of aphasia. Stroke 2004;5:5. [DOI] [PubMed] [Google Scholar]
- 17.Musso M, Weiller C, Kiebel S, et al. Training-induced brain plasticity in aphasia. Brain 1999;122:1781–90 [DOI] [PubMed] [Google Scholar]
- 18.Liepert J, Graef S, Uhde I, et al. Training-induced changes of motor cortex representations in stroke patients. Acta Neurol Scand 2000;101:321–26 [DOI] [PubMed] [Google Scholar]
- 19.Leger A, Demonet JF, Ruff S, et al. Neural substrates of spoken language rehabilitation in an aphasic patient: an fMRI study. Neuroimage 2002;17:174–83 [DOI] [PubMed] [Google Scholar]
- 20.Cornelissen K, Laine M, Tarkiainen A, et al. Adult brain plasticity elicited by anomia treatment. J Cogn Neurosci 2003;15:444–61 [DOI] [PubMed] [Google Scholar]
- 21.Davis C, Baynes K, Harrington G. Intensive semantic intervention in fluent aphasia: A pilot study with FMRI. Aphasiology 2006;20:59–83 [Google Scholar]
- 22.Rutten GJ, Ramsey NF, van Rijen PC, et al. Reproducibility of fMRI-determined language lateralization in individual subjects. Brain Lang 2002;80:421–37 [DOI] [PubMed] [Google Scholar]
- 23.Desmond JE, Sum JM, Wagner AD, et al. Functional MRI measurement of language lateralization in Wada-tested patients. Brain 1995;118:1411–19 [DOI] [PubMed] [Google Scholar]
- 24.Detre JA, Maccotta L, King D, et al. Functional MRI lateralization of memory in temporal lobe epilepsy. Neurology 1998;50:926–32 [DOI] [PubMed] [Google Scholar]
- 25.Golby AJ, Poldrack RA, Brewer JB, et al. Material-specific lateralization in the medial temporal lobe and prefrontal cortex during memory encoding. Brain 2001;124:1841–54 [DOI] [PubMed] [Google Scholar]
- 26.Deblaere K, Backes WH, Hofman P, et al. Developing a comprehensive presurgical functional MRI protocol for patients with intractable temporal lobe epilepsy: a pilot study. Neuroradiology 2002;44:667–73 [DOI] [PubMed] [Google Scholar]
- 27.Adcock JE, Wise RG, Oxbury JM, et al. Quantitative fMRI assessment of the differences in lateralization of language-related brain activation in patients with temporal lobe epilepsy. Neuroimage 2003;18:423–38 [DOI] [PubMed] [Google Scholar]
- 28.Deblaere K, Boon PA, Vandemaele P, et al. MRI language dominance assessment in epilepsy patients at 1.0 T: region of interest analysis and comparison with intracarotid amytal testing. Neuroradiology 2004;46:413–20 [DOI] [PubMed] [Google Scholar]
- 29.Seghier ML, Lazeyras F, Pegna AJ, et al. Variability of fMRI activation during a phonological and semantic language task in healthy subjects. Hum Brain Mapp 2004;23:140–55 [DOI] [PMC free article] [PubMed] [Google Scholar]
- 30.Kaplan E, Goodglass H, Weintraub S. Boston naming test. 2nd ed. Philadelphia: Lea and Febiger;1983
- 31.Phillips MD, Lowe MJ, Lurito JT, et al. Temporal lobe activation demonstrates sex-based differences during passive listening. Radiology 2001;220:202–07 [DOI] [PubMed] [Google Scholar]
- 32.Maldjian JA, Laurienti PJ, Driskill L, et al. Multiple reproducibility indices for evaluation of cognitive functional MR imaging paradigms. AJNR Am J Neuroradiol 2002;23:1030–37 [PMC free article] [PubMed] [Google Scholar]
- 33.Buonocore MH, Gao L. Ghost artifact reduction for echo-planar imaging using image phase correction. Magn Reson Med 1997;38:89–100 [DOI] [PubMed] [Google Scholar]
- 34.Buonocore MH. Unattended image-based ghost correction for EPI. Proceedings of the International Society for Magnetic Resonance in Medicine (ISMRM) Annual Meeting, abstract no. 299,2003
- 35.Cox RW, Jesmanowicz A. Real-time 3D image registration for functional MRI. Magn Reson Med 1999;42:1014–18 [DOI] [PubMed] [Google Scholar]
- 36.Cox R. AFNI: software for analysis and visualization of functional magnetic resonance neuroimages. Comp Biomed Res 1996;29:162–73 [DOI] [PubMed] [Google Scholar]
- 37.Xiong J, Gao J-H, Lancaster JL, et al. Clustered pixels analysis for functional MRI activation studies of the human brain. Hum Brain Mapp 1995;3:287–301 [Google Scholar]
- 38.Forman SD, Cohen JD, Fitzgerald M, et al. Improved assessment of significant activation in functional magnetic resonance imaging (fMRI): use of a cluster-size threshold. Magn Reson Med 1995;33:636–47 [DOI] [PubMed] [Google Scholar]
- 39.Talairach JaT, Pierre. Co-planar stereotaxic atlas of the human brain. New York: Thieme Medical;1988
- 40.Lancaster JL, Woldorff MG, Parsons LM, et al. Automated Talairach atlas labels for functional brain mapping. Hum Brain Mapp 2000;10:120–31 [DOI] [PMC free article] [PubMed] [Google Scholar]
- 41.Lancaster JL, Summerln JL, Rainey L, et al. The Talairach Daemon: a database server for Talairach atlas labels. Neuroimage 1997;5:5634 [Google Scholar]
- 42.Rombouts SA, Barkhof F, Hoogenraad FG, et al. Test-retest analysis with functional MR of the activated area in the human visual cortex. AJNR Am J Neuroradiol 1997;18:1317–22 [PMC free article] [PubMed] [Google Scholar]
- 43.Ramsey NF, Tallent K, van Gelderen P, et al. Reproducibility of human 3D fMRI brain maps acquired during a motor task. Hum Brain Mapp 1996;4:113–21 [DOI] [PubMed] [Google Scholar]
- 44.Miki A, Raz J, van Erp TG, et al. Reproducibility of visual activation in functional MR imaging and effects of postprocessing. AJNR Am J Neuroradiol 2000;21:910–15 [PMC free article] [PubMed] [Google Scholar]
- 45.Machielsen WC, Rombouts SA, Barkhof F, et al. FMRI of visual encoding: reproducibility of activation. Hum Brain Mapp 2000;9:156–64 [DOI] [PMC free article] [PubMed] [Google Scholar]
- 46.Brannen JH, Badie B, Moritz CH, et al. Reliability of functional MR imaging with word-generation tasks for mapping Broca’s area. AJNR Am J Neuroradiol 2001;22:1711–18 [PMC free article] [PubMed] [Google Scholar]
- 47.Rombouts SA, Barkhof F, Hoogenraad FG, et al. Within-subject reproducibility of visual activation patterns with functional magnetic resonance imaging using multislice echo planar imaging. Magn Reson Imaging 1998;16:105–13 [DOI] [PubMed] [Google Scholar]
- 48.Satz P. A test of some models of hemispheric speech organization in the left- and right-handed. Science 1979;203:1131–33 [DOI] [PubMed] [Google Scholar]