Abstract
BACKGROUND AND PURPOSE: There is variability in the literature concerning the appearance and histology of hypothalamic hamartomas. This study correlates the MR imaging and proton MR spectroscopic properties of hypothalamic hamartomas with histopathologic findings.
METHODS: Studies were performed with 3T and 1.5T scanners. Single voxel hamartoma spectra were acquired by using short-echo-time point-resolved spectroscopy sequences (PRESS). 2D PRESS chemical shift imaging (CSI) spectroscopic sequences were also obtained for comparison of tumor-derived spectra with normal gray matter of the amygdala. Sequences were used to compare choline (Cho), N-acetylaspartate (NAA), and myoinositol (mI) resonances by using a creatine (Cr) reference. Spectral ratios and T2 signal intensity ratios of the hamartomas were then compared with histopathologic findings.
RESULTS: Data from single voxel spectroscopic sequences demonstrated a statistically significant decrease in NAA/Cr and an increase in mI/Cr ratios in tumor tissue when compared with values in normal gray matter of the amygdala. In addition, Cho/Cr ratios were also increased when compared with those in normal gray matter controls. Among the 14 hamartomas sampled, a spectrum of increased mI/Cr ratios was seen. Those tumors with markedly elevated mI/Cr demonstrated an increased glial component when compared with the remaining tumors. Increased glial component was also found to have a positive correlation with hyperintensity of lesions on T2-weighted images.
CONCLUSION: We have identified a correlation between the glial/neuronal fraction as determined by histopathology and MR spectral and T2 hyperintensity variations among hypothalamic hamartomas.
Hypothalamic hamartomas are non-neoplastic congenital malformations associated with precocious puberty, behavioral disturbances, and gelastic seizures,1–3 placing patients into different clinical subgroups at presentation. These lesions arise with either a pedunculated or sessile attachment to the hypothalamus.4 The MR imaging appearance of these lesions has been described. On T1-weighted images, the lesions are isointense to gray matter.5,6 These lesions have typically been described as isointense to gray matter on T2-weighted images,7 though more recent sources describe T2 hyperintensity.4–6,8,9 Other criteria for MR imaging diagnosis of hamartoma and exclusion of glioma include lack of enhancement on contrast studies and absence of growth on repeated examinations.4
Historically, the histologic composition of these hamartomas has been described as consisting of neurons similar in appearance to hypothalamic neurons.9,10 Dysplastic neurons and glial cells have also been described in these lesions.11 One area of discordance is the amount of glial tissue seen in hypothalamic hamartomas. Studies vary, from those citing glial content similar to that of hypothalamic gray matter12 to samples with a very large fraction of glial tissue.13
Proton MR spectroscopic imaging has allowed supplementation of tumor image characteristics with information regarding tissue metabolite concentration. This spectral information can help distinguish benign pathology from more aggressive lesions. Information obtained from spectroscopic studies may have potential application in the evaluation of hypothalamic hamartomas as well. This study examines the spectral characteristics and T2 appearance of hypothalamic hamartomas and correlates these findings with their histopathologic composition.
Methods
Fourteen patients (5 males, 9 females; ranging from 2 to 17 years of age) who underwent transcallosal resection of hypothalamic hamartoma for refractory epilepsy at this facility between June 2003 and February 2004 were included in this series. These patients had previously undergone imaging and clinical evaluations at other centers and were referred to this center for surgical therapy. Imaging and clinical data were reviewed at this center to confirm the diagnosis of hypothalamic hamartoma.
Imaging Protocol
MR imaging and 1H-MR spectroscopic imaging sequences were performed on 1.5T (10 patients, SIGNA, GE Healthcare, Milwaukee, Wis) and 3T (5 patients, Eclipse, GE Healthcare) scanners with standard quadrature head coils. Imaging included 3T sagittal T2 fast spin-echo (FSE) (TR/TE, 3050/77), axial T1 fast spoiled gradient-recalled echo (TR/TE, 5.1/2.1), and axial and coronal T2 FSE interleaved sequences (TR/TE, 3000/72). Sequences included 1.5T sagittal T1 spin-echo (TR/TE, 450/14), axial 3D spoiled gradient-recalled echo acquisition in the steady state (TR/TE, 23/4.6), and axial and coronal T2 FSE images (TR/TE, 4000/88). Axial or coronal T1- or T2-weighted images were used for MR spectroscopic imaging sequence voxel positioning depending on the conspicuity of the lesion. No intravenous contrast agents were used during these studies.
MR Spectroscopic Imaging Sequences
Single voxel point-resolved spectroscopy sequences (PRESS) (TR/TE, 2000/35) were obtained for all hamartomas on a 3T scanner when possible. In cases in which a patient required general anesthesia, the 3T scanner was not used because of a lack of compatible anesthesia equipment, and a 1.5T scanner was used. In all cases, the volume of acquisition was specified by using a rectangular region of interest. Voxel sizes were adjusted to best fit the lesion and minimize the inclusion of surrounding brain while including sufficient volume for adequate signal intensity-to-noise ratio, and sizes ranged from 2.6 to 8.4 cm3. In addition, 2D PRESS chemical shift imaging (CSI) sequences (TR/TE, 1200/35) were obtained in 7 patients (3T [n = 4] and 1.5T[n = 3]), and spectra at the level of the amygdala were used to obtain normal gray matter control values.
Pathologic Evaluation
Resected tumor specimens were sectioned, stained (standard hematoxylin-eosin [H&E]), and mounted for microscopic evaluation. All submitted specimens were accepted for pathologic evaluation. The specimens were graded by a neuropathologist (S.W.C.) initially blinded to the results of the imaging evaluation for neuronal/glial fractions, by using a 6-point scale with 1 representing nearly purely neuronal and 6, nearly entirely glial. A relatively uniform distribution of pathologic grades was present in the series.
Data Processing
Dominant myoinositol (mI), choline (Cho), and N-acetylaspartate (NAA) spectral resonances were evaluated by using a creatine (Cr) reference. NAA/Cr, Cho/Cr, and mI/Cr ratios were calculated by using ProbeQuant software (GE Healthcare) provided with both scanners. NAA/Cr, Cho/Cr, and mI/Cr ratios of hamartomas were then compared with corresponding ratios obtained from normal gray matter controls obtained from the amygdala, which was chosen because it is an easily localized gray matter structure of sufficient size to allow valid comparison. In all cases, the amygdala appeared normal on all imaging sequences. Full evaluation of results demonstrated no statistically significant difference between 1.5T and 3T values for corresponding resonances in tumor or normal gray matter controls (P =.24). Therefore, for the purposes of this study, 1.5T and 3T values were pooled.
Relative intensity of lesions on T2-weighted images was also measured against gray matter in the amygdala by using T2 FSE sequences. Three areas of interest were measured within each hamartoma, and an average was calculated. A similar value was calculated for gray matter within the amygdala from the same T2 sequence. T2 tumor/gray matter intensity ratios were then calculated for each patient by dividing average tumor intensity by average gray matter intensity within the amygdala. Again, T2 ratios were pooled because no statistical difference between 1.5T and 3T values was noted (P = .44).
Using this data, we constructed scatterplots comparing spectral ratios and T2 intensity ratios with the 6-point pathologic grading scale. Correlation analysis was used to obtain linear correlation coefficients as a measure of the association of mI/Cr ratio and T2 hyperintensity with pathologic grade.
Results
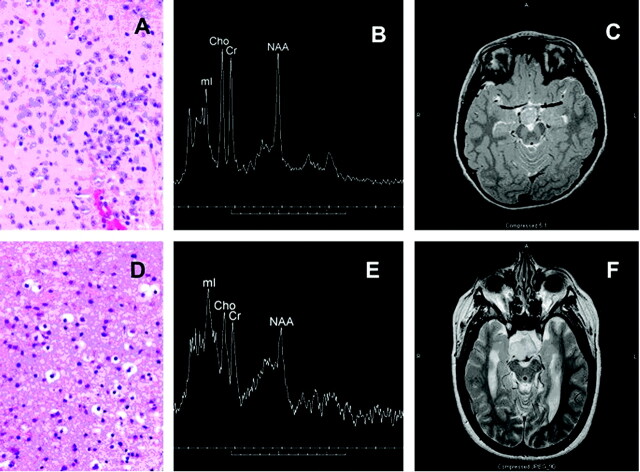
All hamartomas had a sessile attachment to the hypothalamus, and no pedunculated lesions were noted in this series. Histologic evaluation of the hamartomas demonstrated varying levels of neuronal and glial content. Some tumors exhibited a heterogeneous appearance with small nests of neurons or glial cells on a more homogeneous cellular background. Neuronal elements when present were characteristic, typically smaller than the larger ganglion cells that predominate in the normal hypothalamus. Dysplastic neurons were rarely seen. Glial elements were readily distinguished from astrocytoma, demonstrating small bland nuclei, no atypia or hypercellularity, and little or no proliferative activity on MIB-1 testing. Examples of predominately neuronal and predominately glial histology are given in Fig 1, with corresponding MR spectra and T2 images.
Fig 1.
Photomicrograph (H&E stain) from predominantly neuronal hypothalamic hamartoma (A) with corresponding single voxel MR spectrum (3T) and axial T2-weighted image (B, -C). The mI peak is moderately elevated and tumor is slightly hyperintense relative to gray matter on T2-weighted images. Also shown are a photomicrograph from a predominately glial hamartoma (D) with corresponding spectrum (1.5T) and T2-weighted images (E,-F). The mI peak is markedly elevated, and the lesion is very hyperintense in comparison to gray matter. Cho is mildly elevated, and NAA is reduced in both cases.
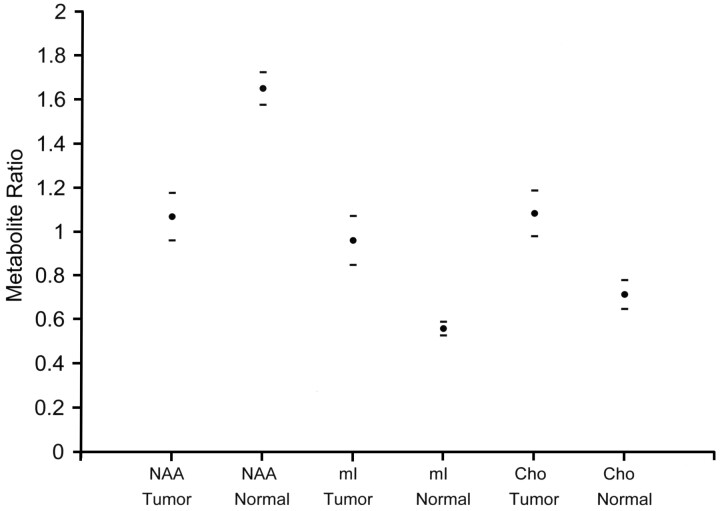
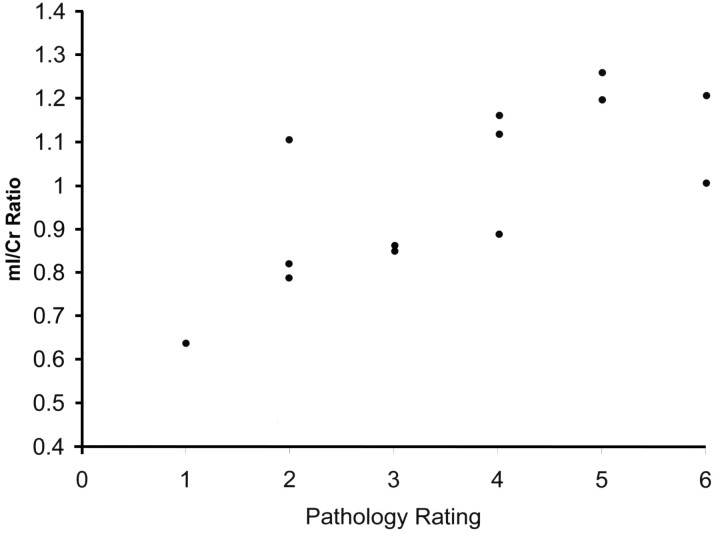
Data from single voxel spectroscopy of the hamartomas demonstrated significant differences in NAA/Cr (P < .001), Cho/Cr (P < .001), and mI/Cr ratios (P < .001) when compared with similar ratios in normal gray matter of the amygdala (Fig 2). NAA ratios were decreased, whereas mI and Cho ratios were increased compared with normal controls. Although all mI ratios were significantly higher than normal, a subgroup was retrospectively identified to be markedly higher than others. Values for mI were then plotted against the neuropathology rating scale. Except for 1 outlier, higher mI/Cr ratios corresponded to increased glial content within the tumor (Fig 3). Correlation of mI/Cr against pathologic grade yielded a linear regression coefficient of 0.74 (P = .004). Removal of the 1 outlier from the dataset increased the correlation coefficient to 0.84 (P = .0006). No association of NAA/Cr or of Cho/Cr with pathologic grade was found.
Fig 2.
Graph shows the comparison of spectral ratios within tumor and normal gray matter. A significant decrease is noted in NAA/Cr in the hypothalamic hamartomas compared with normal controls. Significant increases are seen in mI/Cr and Cho/Cr. Horizontal dashes represent 95% confidence intervals.
Fig 3.
Scatterplot shows individual mI/Cr ratios of hypothalamic hamartomas versus 6-point pathology rating scale (1 = mostly neuronal, 6 = mostly glial). Samples exhibit increased mI concentrations with increasing glial content. One relatively neuronal sample (pathology rating, 2) demonstrates an anomalously high mI/Cr = 1.1.
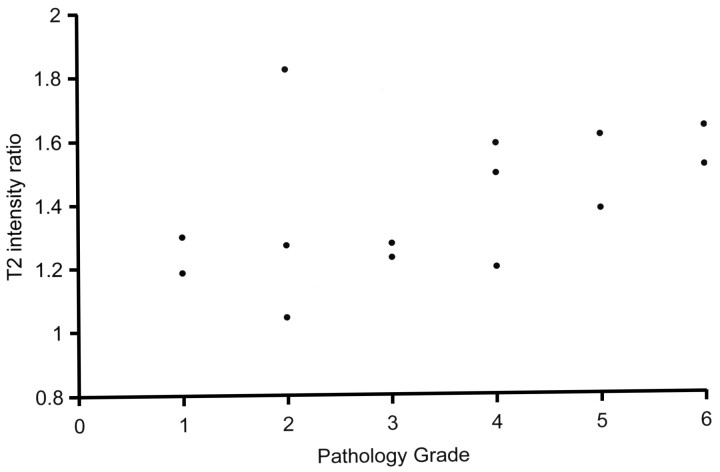
Appearance of the hamartomas on T2-weighted images also varied. Some lesions were only mildly hyperintense to gray matter on T2 sequences whereas others were notably higher in intensity. The ratio of intensity of hamartoma to gray matter ranged from 1.05 to 1.82 (mean, 1.40; standard deviation, 0.22). Four of the hamartomas in our series exhibited a heterogeneous appearance with areas of varying intensity within the lesion. Intensity ratios were measured with region of interest encompassing most of the lesion without measuring individual areas of heterogeneity. T2 intensity ratios were also plotted against the rating scale of the neuropathologist, and except for the same sample seen as an outlier with mI/Cr, a similar relationship was again noted: Higher T2 intensities correlated with tumors of increased glial content on pathologic evaluation (Fig 4). Correlation analysis yielded a linear correlation coefficient of 0.46 (P =.1), which increased to 0.74 (0.003) when the outlier was removed.
Fig 4.
Graph shows relative T2 hyperintensity of hypothalamic hamartomas versus 6-point pathology rating scale (1 = mostly neuronal, 6 = mostly glial). Data demonstrate increasing T2 intensity with increased tumor glial content. A sample with pathology rating of 2 and an anomalously high T2 ratio of 1.8 is the same sample seen as an outlier in Fig 3 and discussed in the text.
Clinical features of the patients were also examined against the fraction of glial component for correlation. Features including age at onset of epilepsy, duration of epilepsy, severity of epilepsy, presence of precocious puberty, and cognitive function were plotted against the 6-point pathology rating scale. No clear clinical associations existed with the degree of glial abundance on pathology in this series. Currently, this aspect of the pathology (and therefore that of the MR spectroscopy findings) does not prove to be a discriminator for clinical subgroups within the hypothalamic hamartoma spectrum.
Discussion
Prior studies have described the MR imaging appearance and MR spectroscopic properties of hypothalamic hamartomas. Signal intensity on T2-weighted images in published series has varied from isointense to hyperintense when compared with normal gray matter.4–10 Our finding of progressive T2 hyperintensity with increasing glial content sheds light on this variability of T2 appearance in prior studies.
Previous authors have also described the proton MR spectroscopic properties of hypothalamic hamartomas. Wakai et al14 found decreased NAA/Cr with no alteration of other metabolites in a single case study. Tasch et al15 also confirmed these findings in a spectroscopic study including 5 patients. More recent studies using short TE spectroscopic sequences have found an increase in mI in addition to the NAA reduction. Martin et al7 described increased mI in a hypothalamic hamartoma in a single case study. Freeman et al9 recently confirmed this finding of increased mI levels in a study that included 19 hamartomas. Our data are consistent with these findings.
One area of discordance seen in our study when compared with some of the previous literature is a significant increase in Cho/Cr ratios within hamartomas compared with normal gray matter of the amygdala. In the recent literature, an increase in Cho concentration within hypothalamic hamartomas compared with gray matter of the thalamus but not of the amygdala was reported by Martin et al,7 and a similar increase was reported by Akai et al.16 Freeman et al9 found no increase in Cho concentration within hypothalamic hamartomas in their series when compared with thalamic gray matter, though differences in Cr concentration between hamartoma and gray matter of the thalamus appear to be associated with some elevation of hamartoma Cho/Cr ratios compared with those in the thalamus in their data. Some of these differences could thus be methodologic, reflecting differences between Cho and Cr concentrations in normal gray matter in different parts of the brain as well as differences between concentrations derived from spectroscopic modeling and concentration ratios. Note also that although increased Cho has been associated with higher grade gliomas, this finding can also be seen in benign histologies.17,18
Alterations in cerebral metabolite concentrations detectable with MR spectroscopy have been associated with several pathologic conditions. Decreased NAA is generally identified with neuronal loss, and elevated Cho has been associated with rapid membrane turnover.19–21 Changes in these metabolites are associated with a number of cerebral pathologies. At spectral resolutions achieved in 1H-MR spectroscopy, the peak commonly associated with mI contains contributions from glycine and other macromolecular metabolites.22 Prior studies have associated increased mI with gliosis20,22 and also with osmotic shifts, reflecting the putative role of mI as an astrocytic osmolyte.23 Elevated mI has been reported in association with a broad spectrum of conditions, including glial neoplasms,24,25 multiple sclerosis and clinically isolated syndromes,26 stroke,27 neonatal encephalopathy,28 and Alzheimer disease.29 Our findings extend these observations by identifying an association between both mI level and average T2 signal intensity versus glial fraction within hypothalamic hamartomas.
Although in our series, mI ratio and T2 signal intensity are both positively correlated with increasing glial component within a lesion, several sources of heterogeneity are present in our measurements. The most significant include uncorrected partial volume effects within the spectroscopic voxel and sampling error related to piecemeal removal of only a portion of the hamartoma during transcallosal resection. Additional lesser sources of variability include intrinsic heterogeneity with a given lesion, apparent at histopathologic review and also on the T2-weighted images. An additional source of potential bias arises from the inclusion in our series of only patients selected for surgical therapy for refractory seizures. The pooling of spectroscopic ratio data from 1.5T and 3T imaging systems is also a potential source of heterogeneity; however, the conclusions of this study are separately supported by data from each of the 2 field strengths.
Beyond these sources of heterogeneity, 1 relatively neuronal sample demonstrated greater than expected mI ratio and excess T2 hyperintensity. This outlier exhibited mild heterogeneity on T2-weighted images. Even on retrospective review of the pathologic sample and the spectroscopic data, discordance was still present. We believe that surgical sampling bias is the most likely explanation for this outlier.
Although MR spectroscopy does provide a valuable additional probe of cerebral pathology, supplementing the information available from imaging alone, the results are not highly specific. In particular, elevation of mI can also be seen in some cases of low-grade glioma, even without associated elevation in Cho.25,30 Thus, the spectral signature alone cannot reliably differentiate hypothalamic hamartoma from glioma, although such data can supplement contrast-enhanced imaging and repeated scans in excluding glioma.
Conclusion
Our data reveal a correlation between both mI concentration and T2 signal intensity of hypothalamic hamartomas versus glial fraction as determined by histopathology. No association with clinical subgroups was found in this series; however, these imaging differences could potentially provide a basis for more accurate selection of patients for therapy techniques in the future.
Footnotes
Presented in part at the 35th annual meeting of the Western Neuroradiological Society, October 2003, Kohala Coast, Hawaii.
References
- 1.Judge D, Kulin H, Page R, et al. Hypothalamic hamartoma: a source of luteinizing-hormone-releasing factor in precocious puberty. N Engl J Med 1977;296:7–10 [DOI] [PubMed] [Google Scholar]
- 2.Inoue H, Kanazawa H, Kohga H, et al. Hypothalamic hamartoma: anatomic, immunohistochemical, and ultrastructural features. Brain Tumor Pathol 1995;12:45–51 [PubMed] [Google Scholar]
- 3.Diebler C, Ponsot G. Hamartomas of the tuber cinereum. Neuroradiology 1983;25:93–101 [DOI] [PubMed] [Google Scholar]
- 4.Veldueza J, Cristante L, Dammann O, et al. Hypothalamic hamartomas: with special reference to gelastic epilepsy and surgery. Neurosurgery 1994;34:949–58 [DOI] [PubMed] [Google Scholar]
- 5.Grossman R, Yousem D. Neuroradiology: The Requisites. 2nd ed. Philadelphia, Pa: Mosby;2003. :548–50
- 6.Osborn Anne. Diagnostic Imaging:. Brain. Vol. II. Salt Lake City, Utah: Amirsys;2004. :2:12 [Google Scholar]
- 7.Martin D, Seeger U, Ranke M, et al. MR imaging and spectroscopy of a tuber cinereum hamartoma in a patient with growth hormone deficiency and hypogonadotropic hypogonadism. AJNR Am J Neuroradiol 2003;24:1177–80 [PMC free article] [PubMed] [Google Scholar]
- 8.Barkovich A. Intracranial, Orbital and Neck Tumors of Childhood: Pediatric Neuroimaging. Philadelphia, Pa: Lippincott Williams & Wilkins;2000. :443–580
- 9.Freeman JL, Coleman LT, Wellard RM, et al. MR imaging and spectroscopic study of epileptogenic hypothalamic hamartomas: analysis of 72 cases. AJNR Am J Neuroradiol 2004;25:450–62 [PMC free article] [PubMed] [Google Scholar]
- 10.Richter RB. True hamartoma of the hypothalamus associated with pubertas praecox. J Neuropathol Exp Neurol 1951;10:368–83 [DOI] [PubMed] [Google Scholar]
- 11.Kahane P, Tassi L, Hoffmann D. Cries dacrystiques et hamartome hypothlamique: a propos d’une observation video-EEG. Epilepsies 1994;6:259–79 [Google Scholar]
- 12.Northfield D, Russell D. Pubertas praecox due to hypothalamic hamartoma: report of two cases surviving surgical removal of the tumour. J Neurol Neurosurg Psychiatry 1967;30:166–73 [DOI] [PMC free article] [PubMed] [Google Scholar]
- 13.Georgakoulias N, Vize C, Jenkins A, et al. Hypothalamic hamartomas causing gelastic epilepsy: two cases and a review of the literature. Seizure 1998;7:167–71 [DOI] [PubMed] [Google Scholar]
- 14.Wakai S, Nikaido K, Nihira H, et al. Gelastic seizure with hypothalamic hamartoma: proton magnetic resonance spectrometry and ictal electroencephalographic findings in a 4-year-old girl. J Child Neurol 2002;17:44–46 [DOI] [PubMed] [Google Scholar]
- 15.Tasch E, Cendes F, Li L, et al. Hypothalamic hamartomas and gelastic epilepsy: a spectroscopic study. Neurology 1998;51:1046–50 [DOI] [PubMed] [Google Scholar]
- 16.Akai T, Okamoto K, Iizuka H, et al. Treatments of hamartoma with neuroendoscopic surgery and stereotactic radiosurgery: a case report. Minim Invas Neurosurg 2002;45:235–39 [DOI] [PubMed] [Google Scholar]
- 17.Krieger MD, Panigrahy A, McComb JG, et al. Differentiation of choroid plexus tumors by advanced magnetic resonance spectroscopy. Neurosurg Focus 2005;15:18. [PubMed] [Google Scholar]
- 18.Kawaguchi T, Kumabe T, Shimizu H, et al. 201Tl-SPECT and 1H-MRS study of benign lateral ventricle tumors: differential diagnosis of subependymoma. Neurosurg Rev 2005;28:96–103 [DOI] [PubMed] [Google Scholar]
- 19.Urenjak J, Williams S, Gadian D, et al. Proton nuclear magnetic resonance spectroscopy unambiguously identifies different neural cell types. J Neurosci 1993;13:981–89 [DOI] [PMC free article] [PubMed] [Google Scholar]
- 20.Ross B. Biochemical considerations in 1H spectroscopy: glutamate and glutamine—myo-inositol and related metabolites. NMR Biomed 1991;4:59–63 [DOI] [PubMed] [Google Scholar]
- 21.Miller BL. A review of chemical issues in 1H NMR spectroscopy: N-acetyl-L-aspartate, creatine and choline. NMR Biomed 1991;4:47–52 [DOI] [PubMed] [Google Scholar]
- 22.Kim JP, Lentz MR, Westmoreland SV, et al. Relationships between astrogliosis and 1H MR spectroscopic measures of brain choline/creatine and myo-inositol/creatine in a primate model. AJNR Am J Neuroradiol 2005;26:752–59 [PMC free article] [PubMed] [Google Scholar]
- 23.Strange K, Emma F, Paredes A, et al. Osmoregulatory changes in myo-inositol content and Na+/myo-inositol cotransport in rat cortical astrocytes. Glia 1994;12:35–43 [DOI] [PubMed] [Google Scholar]
- 24.Castillo M, Smith JK, Kwock L. Correlation of myo-inositol levels and grading of cerebral astrocytomas. AJNR Am J Neuroradiol 2000;21:1645–49 [PMC free article] [PubMed] [Google Scholar]
- 25.Saraf-Lavi E, Bowen BC, Pattany PM, et al. Proton MR spectroscopy of gliomatosis cerebri: case report of elevated myoinositol with normal choline levels. AJNR Am J Neuroradiol 2003;24:946–51 [PMC free article] [PubMed] [Google Scholar]
- 26.Fernando KTM, McLean MA, Chard DT, et al. Elevated white matter myo-inositol in clinically isolated syndromes suggestive of multiple sclerosis. Brain 2004;127:1361–69 [DOI] [PubMed] [Google Scholar]
- 27.Rumpel H, Lim WE, Chang HM, et al. Is myo-inositol a measure of glial swelling after stroke? A magnetic resonance study. J Magn Reson Imaging 2003;17:11–19 [DOI] [PubMed] [Google Scholar]
- 28.Robertson NJ, Lewis RH, Cowan FM, et al. Early increases in brain myo-inositol measured by proton magnetic resonance spectroscopy in term infants with neonatal encephalopathy. Pediatr Res 2001;50:692–700 [DOI] [PubMed] [Google Scholar]
- 29.Jones RS, Waldman AD. 1H-MRS evaluation of metabolism in Alzheimer’s disease and vascular dementia. Neurol Res 2004;26:488–95 [DOI] [PubMed] [Google Scholar]
- 30.Londono A, Castillo M, Armano D, et al. Unusual MR spectroscopic imaging pattern of an astrocytoma: lack of elevated choline and high myo-inositol and glycine levels. AJNR Am J Neuroradiol 2003;24:942–45 [PMC free article] [PubMed] [Google Scholar]


