

Abstract
SUMMARY: Reliable identification of the subthalamic nucleus (STN) is a critical step in deep brain stimulation for Parkinson disease but difficult on T1-weighted stereotactic MR imaging. By simultaneous imaging of multiple gradient echoes, susceptibility contrast is added to conventional T1-weighted high-resolution MR image. Thus, the visibility of the STN is enhanced on a second co-localized dataset by exploiting the sensitivity of the T2*-relaxation to local iron deposits. The feasibility is underpinned by quantitative measurements on healthy adults.
An established neurosurgical therapy for Parkinson disease is to place electrodes for deep brain stimulation within the subthalamic nucleus (STN).1 Reliable identification of the anatomic borders of the STN is thus a critical step in stereotactic procedures.2,3 T2-weighted MR imaging showing the iron-rich structures as hypointensities has been suggested as additional information to the poor contrast of the STN on T1-weighted high-resolution 3D MR imaging.4,5 Exploiting the increased sensitivity of T2* to local iron deposits, a multigradient echo fast low-angle shot (FLASH) technique6 is proposed to visualize the STN. This 3D MR technique enables simultaneous acquisition of T1-weighted images for stereotactic use and images with superimposed T2* contrast to localize the STN.
Technique
The feasibility study was carried out on 16 healthy adults (8 men; age range, 23–31 years; mean age, 26 years) on a 3T MR system (Magnetom Trio; Siemens Medical Solutions, Erlangen, Germany) using an 8-channel phased-array head coil (MR Imaging Devices, Waukesha, Wis). Written informed consent as supervised by the local ethical committee was obtained.
A multi-echo FLASH sequence (TR, 30 ms; flip angle, 20°) provided primarily T1-weighted 3D datasets of 0.95-mm isotropic resolution (FOV = 243 mm; 176 sagittal partitions with 6/8 partial Fourier sampling in phase and section directions; 7:09 minutes). Eight gradient-echoes (TE = 2.2/5.2/8.2/11.2/14.2/17.2/20.2/23.2 ms; bandwidth/pixel = 370 Hz) provided additional T2*-weighted contrast increasing with TE. For comparison, multisection turbo spin-echo images (TSE; 29 contiguous 2-mm axial sections; effective TE, 119 ms; TR, 3900 ms) were also obtained.
The data were transferred to a stereotactic workstation (Sofamore Danek Stealth Station; Medtronic, Minneapolis, Minn) for coregistration of images with the Schaltenbrand-Wahren atlas.7 For quantitative comparison, T2* was determined in the STN and the reticulate formation by a region-of-interest analysis in 1 subject.
Results
The T2*-signal intensity decay was markedly faster in the area of the STN than in the surrounding tissue. Figure 1 shows representative curve fits to the STN and the reference region of the reticulate formation. This corresponded with a contrast of approximately 25% at the longest TE. Thus, both STNs could be identified in all 16 of the subjects even when motion artifacts impaired the delineation (2 subjects).
Fig 1.

T2* decay in the STN (dots) and reticular formation (RF; circles). Fitted T2* values were 25.0 ± 0.4 ms (STN, bold) and 59.1 ± 2.0 (RF, dashed).
Figure 2 shows the midbrain region, where the solely T1-weighted data (echo 1; TE = 2.3 ms; top) did not reveal any structures, but the STN became clearly visible at a TE of 20 ms and above (echo 7; middle). The main axis of the STN was slightly oblique to the anterior/posterior commissure plane shown in Fig 2. Its position was approximately 7 mm rostroanterior to the superior pole of the red nucleus. The spatial assignment was confirmed by comparison with the coregistered T2-weighted TSE images with the use of a stereotactic system. In the subject shown in Fig 2, the estimated position of the STN by using Schaltenbrand-Wahren coordinates was slightly different from the direct visually identified position. In addition, phase data were acquired to calculate the spatial distortions as a result of magnetic field inhomogeneities. Even in the critical areas at the skull base, these did not exceed 1 pixel.
Fig 2.
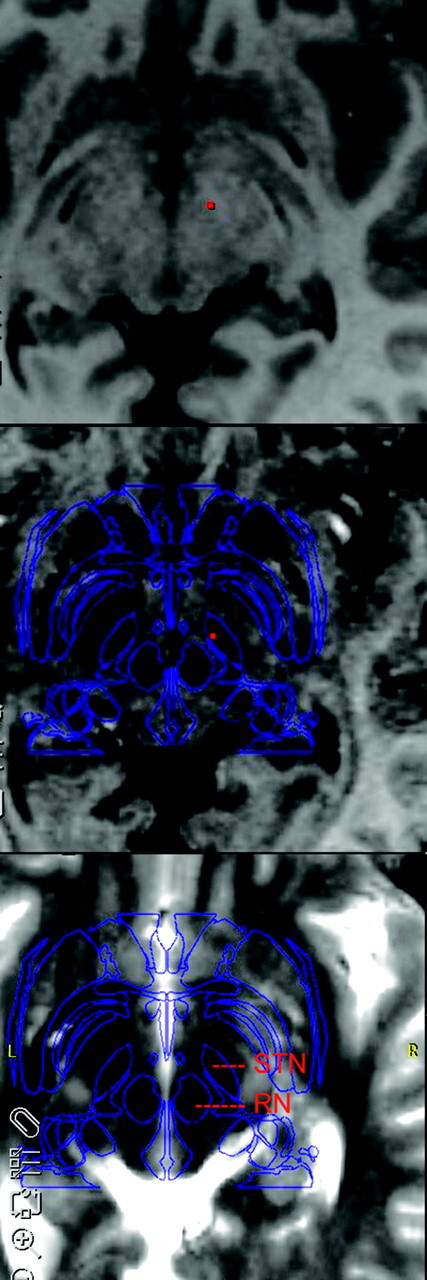
Comparison of T1-weighted, T1+T2*-weighted, and T2-weighted (top to bottom) MR imaging in anterior/posterior commissure orientation. Note the T2* contrast of vessels and iron-containing structures. The outlines of the Schaltenbrand-Wahren atlas are shown as overlay (blue). The STN and red nucleus (RN) are assigned. A mismatch between the atlas and individual anatomy of the STN can be seen. The apparent inconsistency between T2*- and T2-weighted images (as seen on the left and right STN) demonstrates the limitations when coregistering the multisection T2-weighted data with the multiecho 3D datasets.
Discussion
The correlation of iron deposits in the STN and the associated hypointensities on T2-weighted MR imaging has been firmly established by a histologic study4 and has been applied recently at 3T.5 This is the first report to use the higher sensitivity of T2* to local iron content8 for direct visualization of the STN. Comprehensible contrast could be obtained at short TE compatible with TR durations as used in high-resolution 3D T1-weighted MR imaging in clinically feasible time. We were able to demonstrate the T2* contrast of the STN also at 1.5T by using a standard quadrature head coil and a single echo measurement with TE at 20 ms. Implementation as a multiecho technique permitted simultaneous acquisition and, thus, inherently co-localized datasets without loss of resolution such as T2-weighted MR imaging and without additional measuring time. The dataset of the first echo may be used in standard stereotactic procedures; the later echoes provide additional contrast of iron-containing structures. The low heat deposition of the gradient-echo approach is an additional advantage at higher field strengths and in the presence of metal implants. However, the feasibility for postsurgical control is expected to be hampered by the presence of B0 field inhomogeneity. Quantitative in vivo data of the iron content and relaxation in the STN are lacking, because this structure has not been evaluated in MR imaging studies.8,9 Further systematic evaluation on a larger cohort is in progress to fully evaluate the potential of the suggested technique and individual-, age-, and disease-related variations.
Conclusion
Because of the iron content of the STN and sensitivity of T2* to iron deposits, the STN can be visualized on stereotactic MR imaging by simultaneous acquisition of multiple gradient echoes at 3T to generate co-localized 3D datasets with T1 and T1-T2* contrast.
Acknowledgments
We thank Dr G. Krüger of Siemens Medical Solutions for providing the multiecho FLASH sequence.
Footnotes
This work was supported by the Volkswagen Foundation of Lower Saxony.
References
- 1.Richter EO, Hoque T, Halliday W, et al. Determining the position and size of the subthalamic nucleus based on magnetic resonance imaging results in patients with advanced Parkinson disease. J Neurosurg 2004;100:541–46 [DOI] [PubMed] [Google Scholar]
- 2.Aziz TZ, Nandi D, Parkin S, et al. Targeting the subthalamic nucleus. Stereotact Funct Neurosurg 2001;77:87–90 [DOI] [PubMed] [Google Scholar]
- 3.Benabid AL, Koudsie A, Benazzouz A, et al. Subthalamic stimulation for Parkinson's disease. Arch Med Res 2000;31:282–89 [DOI] [PubMed] [Google Scholar]
- 4.Dormont D, Ricciardi KG, Tande D, et al. Is the subthalamic nucleus hypointense on T2-weighted images? A correlation study using MR imaging and stereotactic atlas data. AJNR Am J Neuroradiol 2004;25:1516–23 [PMC free article] [PubMed] [Google Scholar]
- 5.Slavin KV, Thulborn KR, Wess C, et al. Direct visualization of the human subthalamic nucleus with 3T MR imaging. AJNR Am J Neuroradiol 2006;27:80–84 [PMC free article] [PubMed] [Google Scholar]
- 6.Frahm J, Haase A, Matthaei D. Rapid three-dimensional MR imaging using the FLASH technique. J Comput Assist Tomogr 1986;10:363–68 [DOI] [PubMed] [Google Scholar]
- 7.Schaltenbrand G, Wahren W. Atlas for Stereotaxy of the Human Brain. Stuttgart, Germany: Thieme;1977
- 8.Gelman N, Gorell JM, Barker PB, et al. MR imaging of human brain at 3.0 T: preliminary report on transverse relaxation rates and relation to estimated iron content. Radiology 1999;210:759–67 [DOI] [PubMed] [Google Scholar]
- 9.Schenck J, Zimmerman E. High field magnetic resonance imaging of brain iron: birth of a biomarker? NMR Biomed 2004;17:433–45 [DOI] [PubMed] [Google Scholar]