Abstract
BACKGROUND AND PURPOSE: The size of vestibular aqueducts (VAs) seen on CT studies varies. The current practice of calling a VA enlarged when it exceeds a certain threshold (eg, 1.5 mm at the midpoint) is arbitrary. Our hypothesis was that statistical analysis of the range of VA widths in a normal-hearing population would lead to a mathematic definition of the upper-limit-of-normal VA width.
Materials and METHODS: The VA midpoint and opercular widths were measured in 73 children with normal hearing. Statistical analysis yielded values of the 99th, 97.5th, 95th, 90th, 75th, and 50th percentiles for this normal distribution.
RESULTS: The upper-limit-of-normal (95th percentile) values for the VA midpoint and opercular widths were 0.9 and 1.9 mm, respectively. The VAs with greater widths may reasonably be considered enlarged.
CONCLUSION: The VAs with midpoint or opercular widths of 1.0 and 2.0 mm or greater, respectively, are enlarged.
Radiologic assessment is an important tool in the evaluation of childhood sensorineural hearing loss (SNHL). Although the incidence of radiologic abnormalities in children with SNHL has been reported to be as high as 39%,1 at our institution the incidence is 32%.2 A large vestibular aqueduct (LVA) is the most commonly identified malformation.3 There has been no precise definition of normal vestibular aqueduct (VA) size on CT studies. In their original 1978 description of large vestibular aqueduct syndrome (LVAS), Valvassori and Clemis4 measured the VAs of 3700 patients by using hypocycloidal polytomography and reported that a midpoint VA width of greater than 1.5 mm is abnormal. This value is still generally accepted today.
From a clinical standpoint, LVAS seems to be a unique clinical condition characterized by SNHL, frequently progressive, in children whose temporal bone CT studies demonstrate an enlarged VA. Accompanying abnormalities of the cochlea, modiolus, vestibule, and semicircular canals are frequent.5 Several authors have independently reported a relationship among head trauma, changes in barometric pressure, and progression of SNHL in this syndrome.6,7 Although the risk remains undefined, most otolaryngologists caution patients with LVAs against high-risk activities, such as participation in contact sports, and advise the use of protective head gear when participating in moderate-risk activities.
The aim of this study was to define a normal range for the width of the aqueduct in a group of pediatric patients without SNHL.
Materials and Methods
Subjects
The temporal bone CT studies of 73 children without known SNHL were collected retrospectively in accordance with institutional review board guidelines. The cases were first identified by inspecting radiology reports of temporal bone CT studies performed between 1995 and 2003. The CT examinations were performed for the following indications: otomastoiditis (28), trauma (17), cholesteatoma (10), conductive hearing loss (9), mastoidectomy follow-up (3), facial nerve paralysis (3), and headache (1), otalgia (1), and external otitis (1).3 We then assessed the audiologic records of all of the patients to ensure that there was no SNHL. This was defined as an average bone conduction threshold of 20 dB or better over the frequencies of 500, 1000, and 2000 Hz.
CT Temporal Bone Measurements
We performed all studies by using a standard temporal bone protocol with contiguous 1.0- or 1.25-mm scans. Only axial-plane images were used. Measurements were made with images enlarged 10–15 times with the use of current workstation software (Centricity; GE Healthcare, Milwaukee, Wis) by 3 neuroradiologists (C.B., D.M.E.B., M.J.H.).
VA Midpoint Measurement (Figs 1–3, 5).
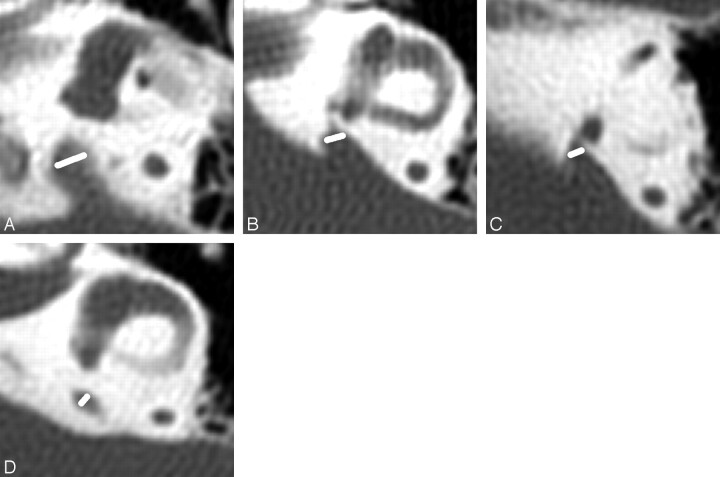
Fig 1.
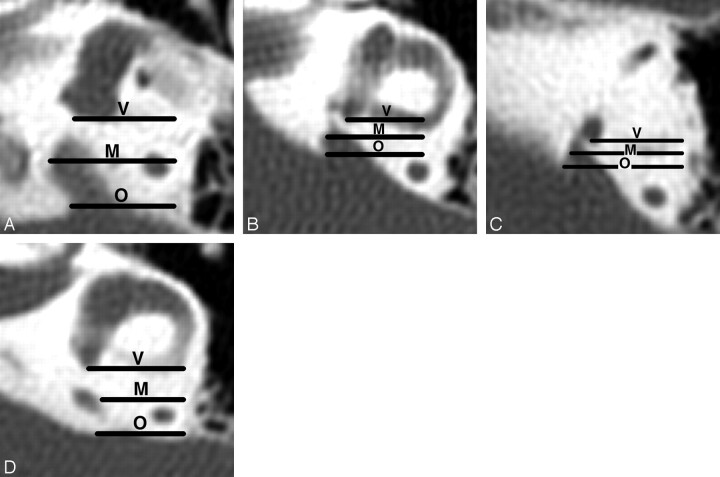
Axial CT images showing the coronal planes used to define the VA midpoint plane in 4 temporal bones. The vestibular plane (V) lies at the level of the posterior wall of the vestibule or crus commune. The opercular plane is at the level of the VA operculum (O) or adjacent posterior wall of the petrous bone. The midpoint plane (M) is equidistant from the vestibular and opercular planes. Magnification of all images is the same. Enlarged rather than normal VAs are used for illustration so that the relationships of the VAs to the planes are easier to see.
A, The posterior wall of the vestibule defines the vestibular plane, and the edge of the operculum defines the opercular plane.
B, The transition between the posterior wall of the vestibule and crus commune defines the vestibular plane, and the edge of the operculum defines the opercular plane.
C, The posterior wall of the crus commune defines the vestibular plane, and the edge of the operculum defines the opercular plane.
D, The posterior wall of the vestibule defines the vestibular plane, and the posterior wall of the temporal bone just above the operculum defines the opercular plane.
Fig 3.
Axial CT images showing VA midpoint measurements in 4 additional children with large midpoints. Magnification of all images is the same. Enlarged rather than normal VAs are used for illustration so that the relationships of the VAs to the planes are easier to see.
A, VA midpoint measures 2.8 mm.
B, VA midpoint measures 2.6 mm.
C, VA midpoint measures 2.5 mm. D, VA midpoint measures 2.3 mm.
Fig 5.
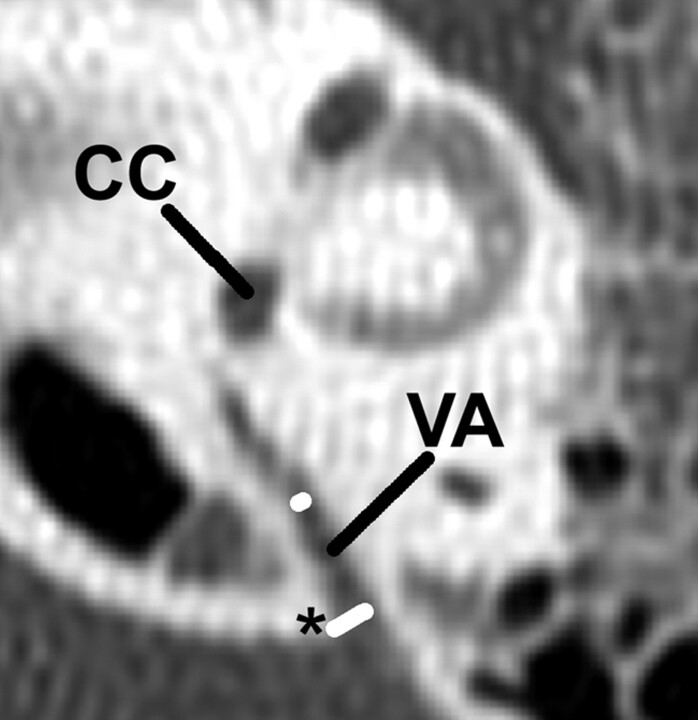
Normal opercular and midpoint VA measurements. The width of the VA at the operculum (*) is 1.4 mm (long white line), and the width at the midpoint (short white line) is 0.4 mm in this temporal bone. The crus commune (CC) is in the axial plane of this VA.
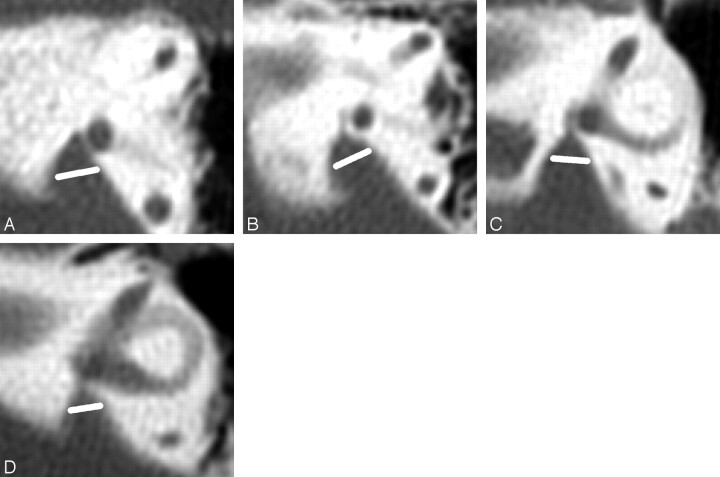
The VA, in the axial plane, originates from the upper vestibule close to the crus commune and ends in an aperture at the edge of the aqueductal operculum.8 The midpoint of the VA can be defined as 1) halfway between the origin and aperture measured along the length of the VA or 2) the part of the VA located half the distance in the petrous bone from its origin in the labyrinth to its aperture in the epidural space. We chose the latter because the points of measurement are easier to define; the length of the VA is hard to define when the lumen is J-shaped, the operculum is oblique, or both. Because the origin of a normal aqueduct is usually invisible, we used the posterior wall of the vestibule, or crus commune if the midpoint lay above the vestibule, in its place. The midpoint was measured on the image in which the width was largest. If the operculum was below the image used for measurement, the posterior wall of the petrous bone was used instead. Because the origin of the VA, midpoint, and operculum progress laterally, it is convenient to use the workstation arrow annotation tool to draw horizontal lines (from medial to lateral) that define the coronal planes of the VA's origin and aperture, and then, by trial and error, find the parallel line that can be drawn that is halfway between the first and second lines. The anterior line, in the coronal plane of the posterior wall of the vestibule or crus commune, defines the vestibular plane. The posterior line, in the coronal plane of the opercular edge or posterior petrous bone, defines the opercular plane. The line in between is the midpoint plane. The midpoint measurement line is drawn across the VA so that it lies equally above and below the midpoint plane and forms the same angle with both walls of the VA. The end points of the measurement lines were subjectively placed in the region where the pixel grayness was halfway between that in the middle of the VA and in the petrous wall.
VA Opercular Measurement (Figs 4, 5).
Fig 4.
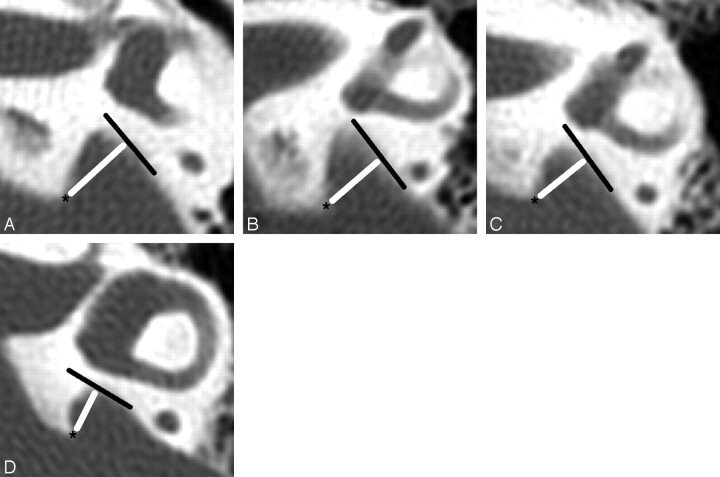
Technique of measuring the width of the VA at the operculum. Asterisks (*) mark the opercular margins of the VAs. The widths (white lines) are measured from the opercular margins to the spots on the posterior temporal bone walls whose surface is perpendicular to the measurement lines. Tangents (black lines) to these spots are shown to illustrate these right-angle relationships. The magnification of all images is the same.
A, VA opercular width is 5.3 mm.
B, VA opercular width is 4.0 mm.
C, VA opercular width is 4.0 mm.
D, VA opercular width is 3.7 mm.
We measured the operculum in a way that allowed comparison with the widths and depths of enlarged endolymph sacs seen on MR studies. The opercular widths of the VA are measured in the same plane as endolymph sac depths by drawing a line from the opercular edge anterolaterally to form a 90° angle with the posterior wall of the petrous bone. Sometimes we cannot achieve 90° when the contour of the operculum and petrous wall is J-shaped; in such instances, 70° or 80° is acceptable. The CT image on which the opercular width was largest was used for measurement.
Statistical Analysis
Because the distribution patterns of both VA measurements (operculum and midpoint) followed a non-Gaussian distribution (both measurements appeared to be positively skewed), the medians and ranges along with the percentiles were reported. We investigated the associations between midpoint and opercular size and the age of the subjects by using the Pearson correlation coefficient (ρ). Subjects were classified into 1 of 4 age categories (younger than 4 years, 4–6.9 years, 7–9.9 years, and 10 years or older), and we used the Kruskal-Wallis one-way analysis of variance by ranks to examine further the potential differences in the VA measurements by these age categories.
To evaluate the reliability of the reported measurement readings, we assessed both interobserver (the degree of agreement between 2 or more observers) and intraobserver reliability (test-retest reliability). We assessed the interobserver and intraobserver correlations by calculating the intraclass correlation coefficient (ICC). A P value of .05 or less was considered significant for all analyses. We performed statistical analyses by using SAS for Windows, version 8.2 (SAS Institute, Cary, NC).
Results
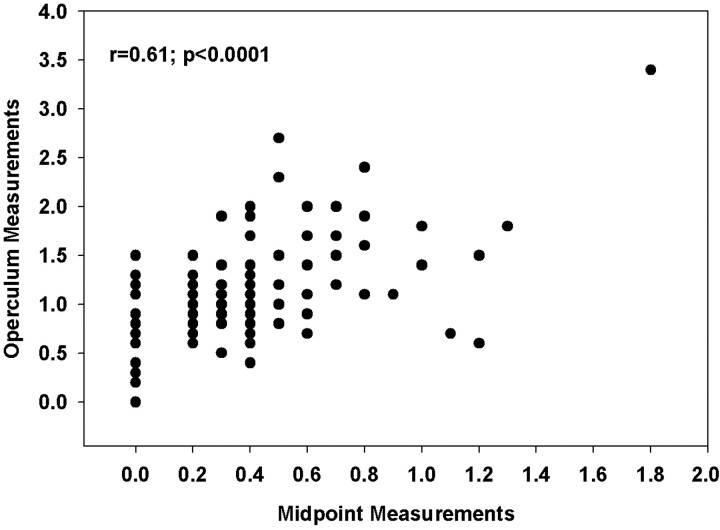
The median (range) values on 146 ears (73 subjects) for VA width at the midpoint and operculum were 0.20 mm (0–1.8 mm) and 0.90 mm (0–3.4 mm), respectively. The largest widths were 1.8 mm for the midpoint and 3.4 mm for the operculum (Table). The 95th percentile values for the VA at the midpoint for all 146 ears was 0.9 mm and, for the VA at the operculum, 1.9 mm. The 95th percentile values for the same measurements were 0.9 mm for the midpoint and 1.9 mm for the operculum. The widths of the operculum and midpoint were significantly correlated with each other (Pearson ρ = 0.61, P < .0001) (Fig 6). The VA was not visible at its midpoint in 17 (23%) children bilaterally and in 14 (19%) children unilaterally. The aqueduct was not visible at the operculum in 2 (3%) children bilaterally and in 2 (3%) children unilaterally. In these cases, the width of the aqueduct was recorded as zero.
The upper ranges of normal vestibular aqueduct widths
| Plane and Percentile | Size (mm) |
||
|---|---|---|---|
| All Ears(n = 146) | Left Side(n = 73) | Right Side(n = 73) | |
| Opercular | |||
| Maximum | 3.4 | 3.4 | 2.7 |
| 99th | 2.7 | 3.4 | 2.7 |
| 97.5th | 2.3 | 2.3 | 2.4 |
| 95th | 1.9 | 2.0 | 1.9 |
| 90th | 1.7 | 1.7 | 1.5 |
| 75th | 1.2 | 1.2 | 1.1 |
| 50th | 0.9 | 0.9 | 0.8 |
| Midpoint | |||
| Maximum | 1.8 | 1.8 | 1.3 |
| 99th | 1.3 | 1.8 | 1.3 |
| 97.5th | 1.2 | 1.2 | 1.2 |
| 95th | 0.9 | 0.8 | 1.0 |
| 90th | 0.7 | 0.7 | 0.7 |
| 75th | 0.4 | 0.4 | 0.4 |
| 50th | 0.2 | 0.2 | 0.2 |
Fig 6.
Correlation structure of the midpoint and the operculum measurements of 146 ears without regard to right or left side.
When comparing the median (range) measurements of the VA at the midpoint for the left and right ears of the 73 subjects, we noted no statistically significant differences (0.20 mm [0–1.8] vs 0.20 mm [0–1.3], respectively; one-sample signed rank P = .38). This finding was consistent when comparing the median (range) measurements of the VA at the operculum for both the left and right ears (0.9 mm [0–3.4] vs 0.80 [0–2.7], respectively; one-sample signed rank P = .23).
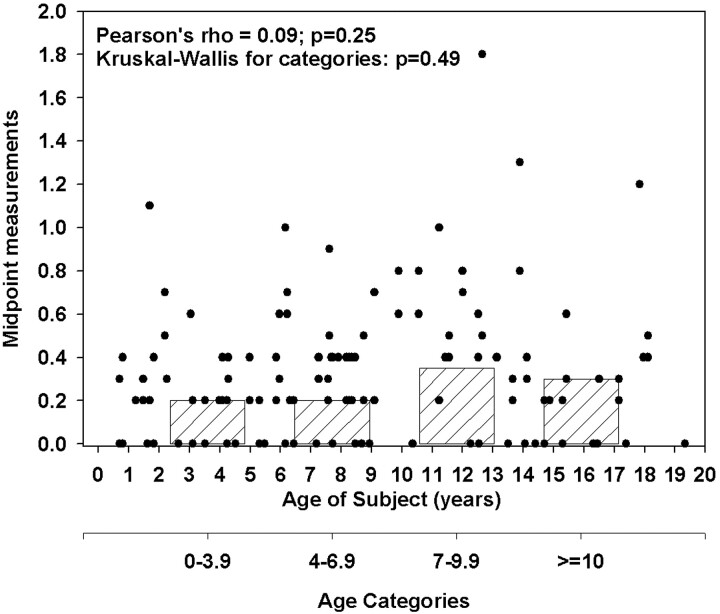
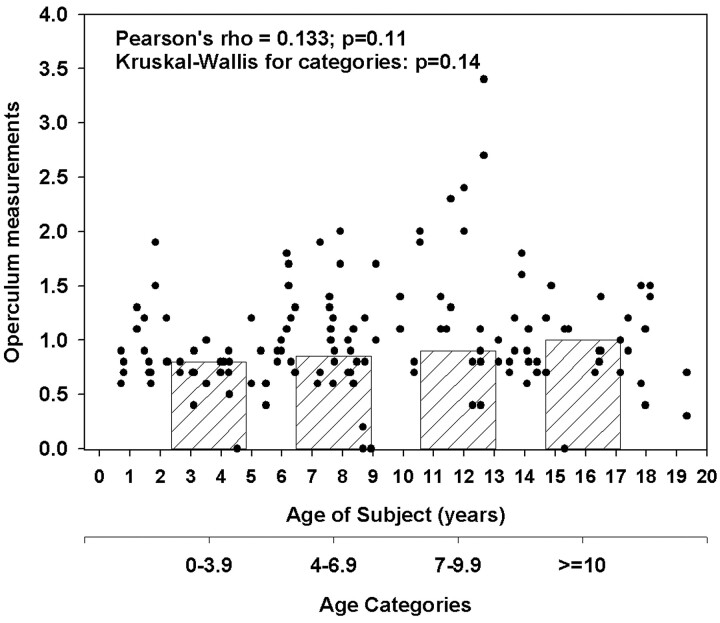
The mean (SD) age of the 73 subjects was 9.1 (5.1) years, with a range of 0.7–19.3 years. Fourteen subjects (19%) were in the age category of 0–3.9 years; 13 subjects (18%), 4–6.9 years; 16 subjects (22%), 7–9.9 years; and the remaining 30 (41%) were 10 years or older. There appeared to be no linear relationship between the width of the VA and the age of the subject. Age as a continuous variable was not correlated with either the midpoint (r = 0.097; P = .25) or the operculum (0.133; P = .11) (Figs 7, 8 respectively). When investigating potential differences in the median VA measurements by the age categories listed above, we noted no statistically significant differences for either the midpoint (Kruskal-Wallis P = .49) or the operculum (Kruskal-Wallis P = .14).
Fig 7.
Scatter and box plot of midpoint measurement compared with age of subject. The dots represent the scatter plot of midpoint measurements (mm) by age of subject in years. The bar graphs represent the bottom offset axis for the median midpoint measurements (mm) by the 4 age categories (0–3.9 years, 4–6.9 years, 7–9.9 years, and >10 years).
Fig 8.
Scatter and box plot of opercular measurement in comparison to age of subject The dots represent the scatter plot of operculum measurements (mm) by age of subject in years. The bar graphs represent the bottom offset axis for the median operculum measurements (mm) by the 4 age categories (0–3.9 years, 4–6.9 years, 7–9.9 years, and >10 years). To the eye, the boxes look like a trend toward increasing size with increasing patient age, but this is insignificant.
Interobserver and Intraobserver Reliability
The VA measurements did not appear to demonstrate significant variability between the 2 raters. The ICC for the midpoint between the 2 different raters was 0.74 (P < .0001) and for the operculum measurements, 0.93 (P < . 0001). These findings are consistent with a high degree of repeatability regarding VA measurements. The intraobserver (test-retest) ICC values for the midpoint and the operculum were 0.77 and 0.95, respectively (P < .0001), consistent with the results from the interobserver reliability analysis. The variability measuring the midpoint was greater than the variability measuring the operculum. This was thought to be due to the smaller widths of the midpoint resulting in less precise measurements.
Discussion
Several definitions of VA enlargement are found in the literature. Most frequently used is the proposition by Valvassori and Clemis4 that a VA is enlarged when its midpoint diameter is greater than 1.5 mm. The authors measured the VA midpoint “halfway between the external aperture and the common crus” or in the “midpoint of the post isthmic segment.” Their VA isthmus is the curved part of the J-shaped VA, near the crus commune, and their postisthmic segment is the straight distal part. Most subsequent authors have continued measuring at the midpoint.7,9–14 The value for the maximum normal VA midpoint width varies among authors. The published values include 1.4,13 1.5,4,11,12,14,15 1.9,7 and 2.0 mm.9,10 One publication did not refer to the midpoint width; instead, it defined a large VA as one with a “visible large aperture (≥4 mm) and a small distance between the vestibule and traceable part of the VA nearest to the vestibule (≥1 mm).”16 Another author suggested that the diameter should not “exceed the diameter of one crus of the adjacent normal semicircular canal.”17 (In our series, the mean diameter of the crus commune was 1.34 mm with an SD of 0.19 mm and a range of 0.9–2.1 mm. These normal crus commune widths are slightly greater than the 95th percentile VA midpoint width of 0.9 mm discussed below.)
We believe that no single threshold can be used to designate whether a VA is enlarged. The International Union of Pure and Applied Chemistry recommends at least 120 reference values be used for the calculation of a reference interval, which is denoted by the 0.95 interfractile interval (between the 2.5th and 97.5th percentiles).18 These ranges are supported by other authorities.19 We propose that VA widths be evaluated in a similar manner. By using 146 reference values, our findings show that the upper limits of normal (95th percentile) for the midpoint and opercular widths are 0.9 and 1.9 mm, respectively. The 95th, rather than the 97.5th percentile, is used because the distribution regarding the midpoint and operculum follows one that is similar to a χ2 distribution rather than a normal distribution pattern. Thus, the typical 2 SDs from the mean often used to determine normal limits would not apply. This midpoint value is smaller than those that have been published previously.
Others have used the 0.90 interfractile interval to define normal ranges.20 With this standard, the upper limit of normal is the 95th percentile. Based on our measurements, the 95th percentile values for the VA midpoint and operculum are 0.9 mm and 1.9 mm, respectively. Importantly, the distributions of the opercular and midpoint measurements follow not a standard normal distribution but a χ2 distribution. Therefore, the SD cutoffs that are widely used to define “abnormal” do not apply. When considering normal distributions, “abnormal” is often defined as 5% of values at either end of the spectrum (upper and lower tails of the distribution), which is equivalent to a distance of 2 SDs above and below the mean. However, with a χ2 distribution (similar to what we see with our data), 5% of our population would be captured in the upper distribution tail, based on the quantiles that are reported in Table 1 and not the SDs from the mean, which would not be applicable. Therefore, it is reasonable to consider VAs with widths greater than the 95th percentile to be enlarged.
This technique for measuring the VA shows modest intraobserver and interobserver variability and is therefore easily applied in a generalized radiology practice setting. Every temporal bone CT scan at our institution is evaluated in this manner. VA measurements greater than the 95th percentile are reported as abnormal. Our neuroradiologists find that these measurements can be performed quickly with slight interobserver variation. Abnormal values are reported as “the vestibular aqueduct (midpoint and/or operculum) is enlarged, with a width greater than the 95th percentile,” and the width measurement is given. Our observation that there is no age-related variability in the dimensions of the VA has been confirmed in a study reporting the same findings in a group of 200 children.15
A potential criticism of this work is the moderately high degree of correlation between the left and right ear measurements. Although our current report focuses on the percentile cutoffs based on 146 ears, we do illustrate the percentile cutoffs with respect to the left and the right ear separately in Table 1. As we have stated, there were no statistical differences between the 2 sides, though statistical significance does not speak to the potential clinical relevance of any particular aqueduct size. An alternative solution might be to choose an ear randomly, regardless of left or right, and base the findings on these ears. By randomly choosing an ear for analysis, we found that the 95th and 97.5th percentiles for the midpoint were 0.8 and 1.2, respectively, and the 95th and 97.5th percentiles for the operculum were 1.9 and 2.4, respectively.
We recommend that both the midpoint and opercular measurements be recorded and that a VA be considered enlarged, not only when both but also when just one of these measurements exceeds the 95th percentile. Although the midpoint and opercular measurements are significantly correlated with each other (Fig 6), the correlation is not perfect, and some children with enlarged VAs would be unrecognized if only 1 of the 2 measurements were used. This midpoint-opercular correlation has also been reported by others.15
We are pursuing our studies of the normal temporal bone by establishing methods of assessing the modiolus on CT and MR studies and by assembling a data base of endolymph duct, endolymph sac, and modiolar dimensions that may be measured on MR images. Reports in the literature describe the features of modiolar hypoplasia, VA and endolymph duct enlargements, and endolymph sac enlargement in the large endolymphatic duct and sac syndrome.5,14,21–24 We believe that the statistical approach set forth in this paper will prove useful for evaluation of the size of all these labyrinthine structures.
Conclusion
The establishment of normative values facilitates consistency and accuracy in the evaluation of CT scans in children with congenital SNHL. To heighten awareness of the important role radiologists should play in the diagnosis of SNHL, and to provide them with the tools necessary to do so, we present a method for assessment of the VA width by using CT workstation tools and present normal measurements of VA width from a group of 73 children without SNHL. We describe a method of measuring VAs that can be applied universally, and we suggest a way to report the measurement values as normal or abnormal. Further studies are being conducted to assess the clinical significance of abnormal VA measurements, correlating genetic profiles with imaging and clinical outcomes. The normative data presented here will serve as a baseline as we further our understanding of the genetics, physiology, and anatomic correlates of SNHL.
Fig 2.
The same axial CT images seen in Fig 1 with the VA midpoint measurement lines drawn. Magnification of all images is the same.
A, The VA midpoint width is 2.0 mm.
B, The VA midpoint width is 1.4 mm.
C, The VA midpoint width is 1.0 mm.
D, The VA midpoint width is 0.8 mm.
References
- 1.Mafong DD, Shin EJ, Lalwani AK. Use of laboratory evaluation and radiologic imaging in the diagnostic evaluation of children with sensorineural hearing loss. Laryngoscope 2002;112:1–7 [DOI] [PubMed] [Google Scholar]
- 2.Boston M, Halsted M, Meinzen-Derr J, et al. The large vestibular aqueduct: a new definition based on audiologic and computed tomography correlation. Otolaryngol Head Neck Surg 2007. . In press. [DOI] [PubMed]
- 3.Madden C, Halsted M, Benton C, et al. Enlarged vestibular aqueduct syndrome in the pediatric population. Otol Neurotol 2003;24:625–32 [DOI] [PubMed] [Google Scholar]
- 4.Valvassori GE, Clemis JD. The large vestibular aqueduct syndrome. Laryngoscope 1978;88:723–28 [DOI] [PubMed] [Google Scholar]
- 5.Davidson HC, Harnsberger HR, Lemmerling MM, et al. MR evaluation of vestibulocochlear abnormalities associated with large endolymphatic duct and sac. AJNR Am J Neuroradiol 1999;20:1435–41 [PMC free article] [PubMed] [Google Scholar]
- 6.Jackler RK, De La Cruz A. The large vestibular aqueduct syndrome. Laryngoscope 1989;99:1238–42; discussion 1242–43 [DOI] [PubMed] [Google Scholar]
- 7.Arcand P, Desrosiers M, Dube J, et al. The large vestibular aqueduct syndrome and sensorineural hearing loss in the pediatric population. J Otolaryngol 1991;20:247–50 [PubMed] [Google Scholar]
- 8.Ammirati M, Ma J, Cheatham ML, et al. Drilling the posterior wall of the petrous pyramid: a microneurosurgical anatomical study. J Neurosurg 1993;78:452–55 [DOI] [PubMed] [Google Scholar]
- 9.Pappas DG, Simpson LC, McKenzie RA, et al. High-resolution computed tomography: determination of the cause of pediatric sensorineural hearing loss. Laryngoscope 1990;100:564–69 [DOI] [PubMed] [Google Scholar]
- 10.McClay JE, Tandy R, Grundfast K, et al. Major and minor temporal bone abnormalities in children with and without congenital sensorineural hearing loss. Arch Otolaryngol Head Neck Surg 2002;128:664–71 [DOI] [PubMed] [Google Scholar]
- 11.Tong KA, Harnsberger HR, Dahlen RT, et al. Large vestibular aqueduct syndrome: a genetic disease? AJR Am J Roentgenol 1997;168:1097–101 [DOI] [PubMed] [Google Scholar]
- 12.Reussner LA, Dutcher PO, House WF. Large vestibular aqueduct syndrome with massive endolymphatic sacs. Otolaryngol Head Neck Surg 1995;113:606–10 [DOI] [PubMed] [Google Scholar]
- 13.Zalzal GH, Tomaski SM, Vezina LG, et al. Enlarged vestibular aqueduct and sensorineural hearing loss in childhood. Arch Otolaryngol Head Neck Surg 1995;121:23–28 [DOI] [PubMed] [Google Scholar]
- 14.Antonelli PJ, Nall AV, Lemmerling MM, et al. Hearing loss with cochlear modiolar defects and large vestibular aqueducts. Am J Otol 1998;19:306–12 [PubMed] [Google Scholar]
- 15.Legeais M, Haguenoer K, Cottier JP, et al. Can a fixed measure serve as a pertinent diagnostic criterion for large vestibular aqueduct in children? Pediatr Radiol 2006;36:1037–42 [DOI] [PubMed] [Google Scholar]
- 16.Okumura T, Takahashi H, Honjo I, et al. Sensorineural hearing loss in patients with large vestibular aqueduct. Laryngoscope 1995;105:289–93; discussion 293–94 [DOI] [PubMed] [Google Scholar]
- 17.Weissman JL. Hearing loss. Radiology 1996;199:593–611 [DOI] [PubMed] [Google Scholar]
- 18.Poulsen OM, Holst E, Christensen JM. Calculation and application of coverage intervals for biological reference values. Pure Appl Chem 1997;69:1601–11 [Google Scholar]
- 19.Ewers U, Krause C, Schulz C, et al. Reference values and human biological monitoring values for environmental toxins. Report on the work and recommendations of the Commission on Human Biological Monitoring of the German Federal Environmental Agency. Int Arch Occup Environ Health 1999;72:255–60 [DOI] [PubMed] [Google Scholar]
- 20.Selhub J, Jacques PF, Rosenberg IH, et al. Serum total homocysteine concentrations in the third National Health and Nutrition Examination Survey (1991–1994): population reference ranges and contribution of vitamin status to high serum concentrations. Ann Intern Med 1999;131:331–39 [DOI] [PubMed] [Google Scholar]
- 21.Koesling S, Rasinski C, Amaya B. Imaging and clinical findings in large endolymphatic duct and sac syndrome. Eur J Radiol 2006;57:54–62 [DOI] [PubMed] [Google Scholar]
- 22.Naganawa S, Koshikawa T, Fukatsu H, et al. Serial MR imaging studies in enlarged endolymphatic duct and sac syndrome. Eur Radiol 2002;12 Suppl 3:S114–17 [DOI] [PubMed] [Google Scholar]
- 23.Naganawa S, Ito T, Iwayama E, et al. MR imaging of the cochlear modiolus: area measurement in healthy subjects and in patients with a large endolymphatic duct and sac. Radiology 1999;213:819–23 [DOI] [PubMed] [Google Scholar]
- 24.Lemmerling MM, Mancuso AA, Antonelli PJ, et al. Normal modiolus: CT appearance in patients with a large vestibular aqueduct. Radiology 1997;204:213–19 [DOI] [PubMed] [Google Scholar]


