Abstract
BACKGROUND AND PURPOSE: The purpose of this work was to test the feasibility of using high angular resolution diffusion imaging (HARDI)-based multitensor tractography to depict motor pathways in patients with brain tumors.
MATERIALS AND METHODS: Ten patients (6 males and 4 females) with a mean age of 52 years (range, 9–77 years) were scanned using a 1.5T clinical MR unit. Single-shot echo-planar imaging was used for diffusion-weighted imaging (repetition time, 6000 ms; excitation time, 88 ms) with a diffusion-sensitizing gradient in 32 orientations and a b-value of 1000 s/mm2. Data postprocessing was performed using both the conventional single- and multitensor methods. The depiction rate of the 5 major components of the motor pathways, that is, the lower extremity, trunk, hand, face, and tongue, was assessed.
RESULTS: Motor fibers on both lesional and contralesional sides were successfully depicted by both the single-tensor and multitensor techniques. However, with the single-tensor model, the depiction of motor pathways was typically limited to the fibers of trunk areas. With the multitensor technique, at least 4 of 5 major fiber bundles arising from the primary motor cortex could be identified.
CONCLUSION: HARDI-based multitensor tractography using a standard b-value (1000 s/mm2) can depict the fiber tracts from the face and tongue regions of the primary motor cortex.
The primary motor cortex and the motor fibers constitute one of the most important eloquent regions of the brain; they are connected to the lower motor neurons and control muscular movement. Thus, being able to determine whether a surgically treatable brain lesion (such as a tumor) is located near the motor system would be of major clinical importance. The primary motor cortex is relatively easily identified on CT and MR imaging using well-established neuroradiologic methods.1–4 On the other hand, identifying the location of the motor pathway has been much more challenging, but it has now become possible using the fiber-tracking method.5–8 Some of these recent articles have shown that this relatively new imaging technique allows the in vivo visualization of the pyramidal tract in anatomically reasonable locations.
However, the depiction of the motor pathway by using a conventional single-tensor model is unfortunately limited to only part of the entire tract.9,10 This limitation occurs because the information within a voxel is oversimplified to represent a fiber tract in a single direction. In other words, the conventional single-tensor model does not take into account the multiple fibers or fiber crossings within single voxels, and thus the single-tensor approach is not ideal for correctly estimating the location of brain fibers.
Proper localization is especially difficult when attempting to do tractography of the motor pathways of the face and tongue regions. This difficulty occurs primarily because of the major fiber bundles, such as the callosal fibers and superior longitudinal fascicles, crossing the motor tract at the level of the centrum semiovale. When these fiber bundles intersect within a voxel, the single-tensor model is not sufficient to describe this voxel, which makes it difficult for the tracking algorithm to track beyond this area.
Recent advances in image acquisition and postprocessing techniques allow the resolution of fibers crossing within a voxel.11–16 This is achieved by using images obtained by diffusion-sensitizing gradients in multiple orientations (typically >30 axes) and by using a high diffusion gradient (typically >3000 s/mm2). These high angular resolution diffusion imaging (HARDI) techniques tend to require an extended data acquisition time, which may hamper their use in the clinical setting. Thus, HARDI studies have so far only focused on methodologic development and have not been applied in clinical practice.
In our institute, diffusion-tensor imaging (DTI) uses 32 axes and a b-value of 1000 s/mm2. The protocol consists of doing 2 sets of 7-minute DTI scans of the whole brain; a total of 14 minutes for data acquisition is thought to be within a clinically feasible timeframe. We sought to determine whether this regular data acquisition protocol using a standard b-value (1000 s/mm2) could be used to resolve crossing fibers by performing a multitensor analysis of the dataset. Thus, the purpose of this study was to test the feasibility of HARDI-based multitensor tractography in depicting motor pathways from the face and tongue regions in patients with brain tumors.
Materials and Methods
This study was approved by the institutional review board. Informed consent was obtained from all of the patients before MR examinations. A total of 10 consecutive patients (6 males and 4 females) who had a mass lesion at or adjacent to the primary motor cortex were evaluated retrospectively. The patients’ mean age was 52 years (range, 9–77 years). The patients’ brain tumors were ultimately diagnosed as glioblastoma multiforme (n = 3), anaplastic astrocytoma (n = 3), grade II glioma (n = 3), and metastatic (n = 1).
Imaging Technique
All of the images were obtained by using a 1.5T whole-body scanner (Gyroscan Intera; Philips Medical Systems, Best, the Netherlands). Single-shot echo-planar imaging was used for DTI (repetition time, 6000 ms; excitation time, 88 ms) with a motion-probing gradient in 32 orientations and a b-value of 1000 s/mm2. The 7-minute protocol was repeated twice to achieve a higher signal-to-noise ratio (SNR). A parallel imaging technique was used to record 128 × 37 data points, which could be reconstructed to images equivalent to a 128 × 118 matrix. Data were zero-filled to generate images with a 128 × 128 resolution. A total of 42 sections with a thickness of 2.5 mm each was obtained without intersection gaps. The FOV was 230 × 230 mm; thus, the size of a voxel was 1.8 × 1.8 × 2.5 mm.
Data Processing for Fiber Tracking
The DWI data were transferred to an off-line workstation for registration, averaging, and analysis (Precision 530; Dell, Round Rock, Tex); PRIDE software (Philips Medical Systems) written in Interactive Data Language (RSI, Boulder, Colo) was used for image analysis. A total of 32 acquisitions in different diffusion sensitizing gradients was performed and registered with respect to the b = 0 measurement using the method of Netsch and van Muiswinkel.17 This was done to remove distortion and possible head motion over various sections and scans. Affine transformation was used in this study for registration.
Modeling: Single Tensor
For each voxel, all 32 of the diffusion directions were used to calculate 32 apparent diffusion coefficients (ADCs). The results were used to fit a 3D ellipsoid or tensor model. Using the fitting result, the flip angle (FA) can be calculated from the different eigenvectors using the following formula18,19:
 |
1) |
where λi represents the diffusivity along the i-th direction, and λ̄ is calculated as follows:
 |
2) |
The most important information derived from this part of the data processing, the direction of the main tensor axis or the principal diffusion direction (PDD), was used to perform fiber tracking.
Modeling: Multitensor
For the multitensor analysis, the data of the 32 directional ADCs were fitted to a 2-tensor model. This 2-tensor model is best described by equation 12 presented in the article by Frank.13 Both the orientations of each tensor (6 df for each tensor) and the relative volume fractions were obtained in this manner. Thus, in the given model, there are 13 df.
The 3 diffusivities (λ1, λ2, and λ3) of each tensor were restricted to a range of λi minimum and λi maximum, so that they will reflect highly oriented fibers. This will also limit the computation time. For our calculations, these were set to 1.2/1.8, 0.2/0.7, and 0.2/0.7 (10−3 mm2/s) for the 3 diffusivities (λ1, λ2, and λ3), respectively. These values are close to the diffusivities found in highly oriented white matter, such as the spinal cord and corpus callosum. Thus, in our model, we assumed that a voxel with crossing fibers consists of 2 individual fibers that have highly oriented diffusion patterns.
Tracking: Single Tensor
Tracking was performed by extending the direction following the PDD of each voxel and by using a streamlined algorithm with the Runge-Kutta interpolation of the fiber directions.20 Tracking was only performed when the following criteria were met: 1) the signal intensity in the b = 0 image was greater than a user-defined threshold; 2) the FA value exceeded a user-defined threshold; and 3) the angle by which the tract changes from one voxel to the next was not larger than αmax.
In this study we used a b = 0 threshold of 200, an FA threshold of 0.1–0.3, and an αmax of 27°, which were derived from a preceding unpublished investigation that sought the parameter setting that enables the most reliable depiction of fibers.
Tracking: Multitensor
Higher-order tracking of white matter fibers using a multitensor approach is based largely on the single-tensor tracking method described above. One of the major differences in using multitensor tracking is that when a tract arrives at a voxel that consists of 2 tensors, the current tract may be split into 2 tracts, each following the PDD of the respective tensors.
This branching was only allowed when the following 2 criteria were met: 1) the volume fraction of the respective tensor was larger than a user-defined fraction; and 2) the angle π (the difference between the 2 PDDs) was larger than a given threshold. If either of the above criteria was not met, the voxel was considered to match a single-fiber model, and tracking was done as described in the previous paragraph. In this study, we used a volume fraction of 5% and a directional angle π of 12°, which were derived from the preceding investigation21 (see Appendix).
The image analysis strategy was to start from depicting the trunk fibers, which are often the least challenging to depict (ie, can be typically seen with αmax = 20° and FA = 0.3). The stop criteria for other parts of primary motor cortices are started from these values used for trunk fibers, and they were altered in stepwise fashion until we found minimum depiction of the targeted tract.
We started by altering the FA, because the voxels with crossing fibers will tend to have lower FA, on which our multitensor approach will have the best benefit. The FA value started from 0.3 and was lowered by 0.1 steps until it reached 0.1 (total of 3 steps). If there was no fiber depiction, then we altered the angular threshold by 1° steps. We started from 20° but did not exceed 27°; there were a total of 8 steps for the angle.
Regions of Interest
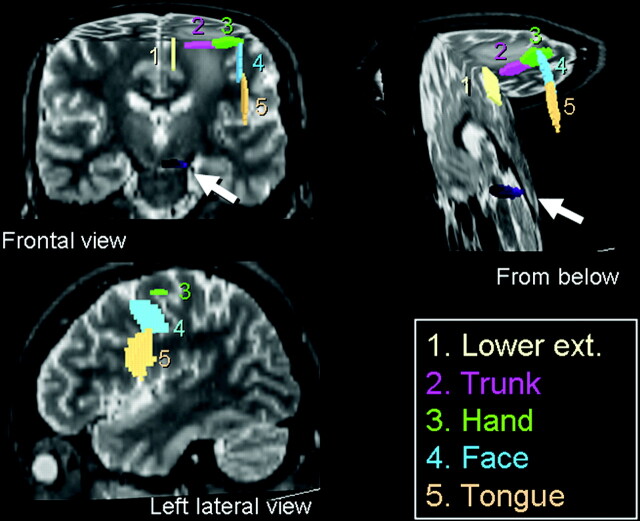
To trace the motor pathways of a single hemisphere, 5 regions of interest (ROIs) were placed over the primary motor cortex (Fig 1), and a single region of interest was placed at the ventral part of the brain stem. The primary motor cortex was identified using well-established neuroradiologic methods described in the literature1–4 for both transaxial and sagittal planes. The 5 cortical ROIs were placed over the tongue, face, hand, trunk, and lower extremity (LE) areas. When placing ROIs at the hand/trunk areas, we used transaxial planes, whereas for the face/tongue and LE areas, we used the sagittal planes. The sizes/shapes of ROIs were identical between single- and multitensor tractography.
Fig 1.
ROIs were placed at 5 different locations along the primary motor cortex to depict the different fiber tracts of the pyramidal tract. The brain stem ROI is indicated by the arrows.
The hand ROI was placed by identifying the “hand knob” of the primary motor cortex.4 The trunk ROI was placed medial to the hand ROI. The lower-extremity ROI was placed medial to the trunk ROI on the sagittal plane. Similarly, the face and tongue ROIs were placed lateral to the hand ROI on the sagittal plane. The location of ROI at the brain stem was determined based on the color vector map. We first identified a pair of regions containing craniocaudally oriented fibers that course through the pons. The ROI was placed over the ventral part of these areas. The locations of these ROIs were determined by a consensus of 2 board-certified neuroradiologists.
Image Analysis
The number of voxels that constituted each fiber bundle (LE, trunk, hand, face, and tongue) was recorded. From these numbers, we calculated the “fiber ratio” for each case, which is the relative volume of fibers per case derived from the following formula:
 |
3) |
Results
Tractography was successfully done in all of the cases. The results of both techniques for the lesional and contralesional hemispheres are described separately.
Contralesional Hemisphere
Single-Tensor Tractography.
The trunk fibers in the healthy hemisphere were depicted by using the single-tensor technique in 8 of the 10 cases, whereas the fibers from the LE were depicted in only 2 of the 10 cases, and the fibers from the hand were depicted in only 2 of the 10 cases. None of the face or tongue fibers were depicted by using single-tensor tractography.
Multitensor Tractography.
Fibers from the trunk and LE were depicted in all of the cases by using the multitensor model. In 8 of the 10 cases, fibers from the hand, face, and tongue regions were depicted.
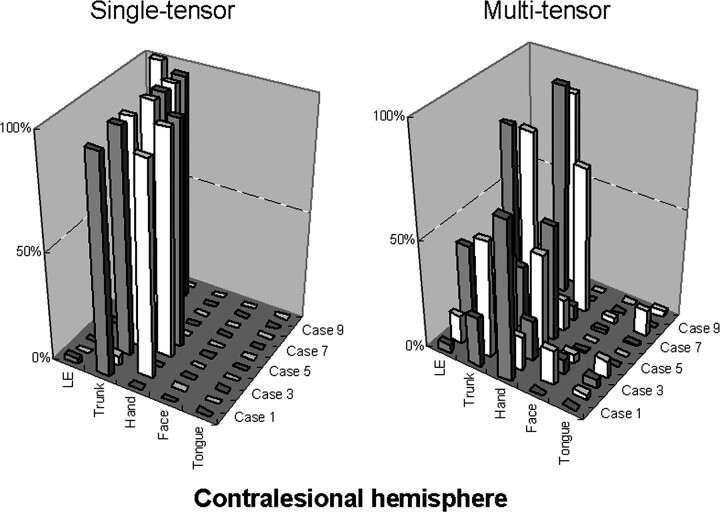
The relative number of points constituting each fiber bundle (fiber ratio) was calculated; the results are summarized in Fig 2. The figure indicates that the multitensor technique enables the depiction of fibers from wider areas of the primary motor cortex, whereas the single-tensor approach is only able to depict the part of the fibers that is limited to the trunk and hand regions. In addition to this, it can be seen that depiction of the face/tongue regions is not yet perfect, because they appear to be less robust than the trunk or hand areas.
Fig 2.
The relative number of points constituting each fiber bundle in the contralesional hemisphere are shown. For example, by using tensor-based tractography, case 1 had mostly trunk fibers depicted (97%) and a low percentage (3%) of LE fibers. On the other hand, by using the multitensor technique, the fibers from other parts are also depicted, and, in this particular case, the trunk fibers constitute only 23% of all fibers. Of note, in general the multitensor approach is able to depict fibers from various locations, whereas the single-tensor approach is limited to the depiction of the trunk and hand regions.
Lesional Hemisphere
Single-Tensor Tractography.
Motor fibers arising from the trunk areas were depicted in 8 of the 10 cases by using the single-tensor model. LE motor fibers were depicted in only 1 of the 10 cases. Motor fibers of the hand, face, and tongue regions were not depicted in any of the cases using the single-tensor model.
Multitensor Tractography.
Motor fibers arising from the trunk regions were depicted in all 10 of the cases. Fibers of the LE and hand regions were also well depicted by using multitensor tractography in 9 of the 10 cases. Motor fibers of the face and tongue regions were also successfully depicted in more than half of the cases by using the multitensor technique (face, 7 of 10; tongue, 8 of 10).
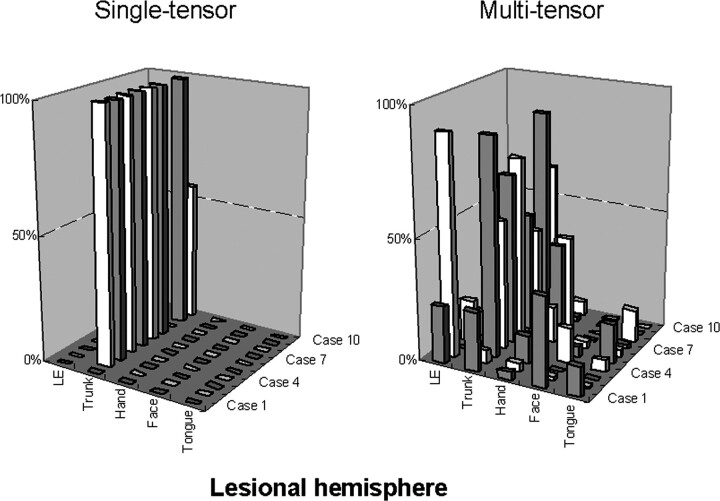
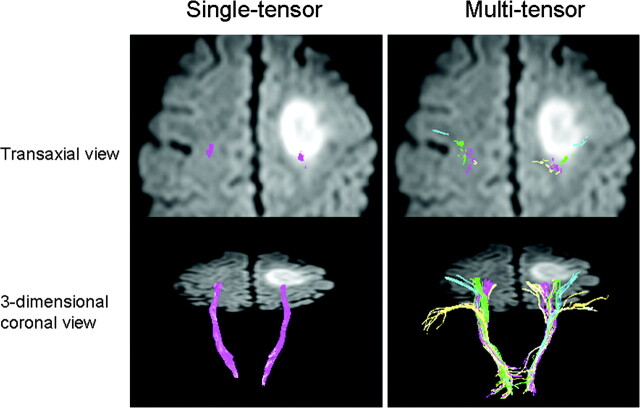
Fig 3 illustrates the fiber ratio for each patient and shows that the fibers depicted by the single-tensor technique are only limited parts of the motor fibers, whereas the multitensor technique depicts other parts of the fibers. Representative cases are illustrated in Figs 4 and 5. These examples show that the use of the multitensor technique was able to depict not only the fibers from the trunk region but also those from various other locations.
Fig 3.
The relative number of points constituting each fiber bundle in the lesional hemisphere is shown. Of note, the depiction of the fibers in this hemisphere is largely limited to the trunk fibers when the single-tensor approach is used. The difference between the single-tensor technique and the multitensor technique becomes obvious in the lesional hemisphere.
Fig 4.
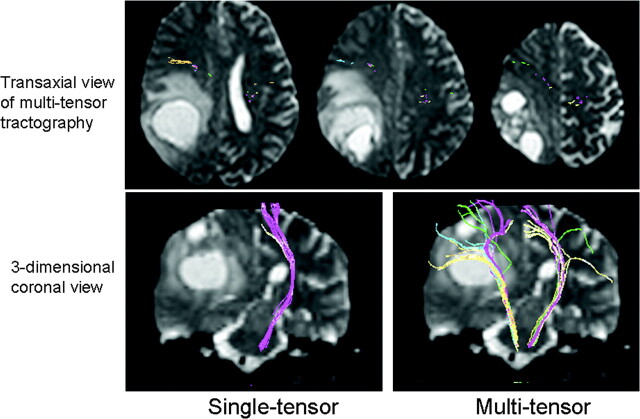
A 55-year-old man (case 4) presented to the hospital with a Jacksonian seizure starting in his right fingers. On MR imaging, a large left frontal lobe tumor was depicted. Of note, the multitensor technique is able to depict fibers from various locations and is able to reveal the relationship between the vital fiber tracts and the dorsal edge of the tumor. On the transaxial view, note that single-tensor tractography is able to show that the trunk fibers (purple) are located within the tumor. Using the multitensor approach, one can see that the hand fibers (green) are involved. Facial fibers (blue) are also seen in close proximity to the tumor.
Fig 5.
A 58-year-old woman with glioblastoma multiforme (case 1) is illustrated. A large right parietal lobe tumor is noted with surrounding vasogenic edema. Note that the pyramidal fibers of lesional side (right) are not depicted using single-tensor tractography, whereas they are well shown by using multitensor tractography. These fibers are noted to have substantial anterior displacement.
Discussion
In this study we have shown that multitensor tractography allows the visualization of the previously undepicted fiber tracts from the face and tongue regions; this information can be of great clinical importance in neurosurgical cases. Crossing fibers has been one of the most challenging problems in single-tensor tractography, particularly in the area of the centrum semiovale, where other major fiber bundles intersect motor fibers.9,10 An underestimation of motor fibers because of crossing fibers can mislead the surgeon and lead to serious damage to the pyramidal tract during surgery.22 Therefore, a more precise way to depict the fibers is needed.
The HARDI technique is known to be able to solve this problem and has been successfully used in simulation studies and normal volunteers. One of the major concerns of using the HARDI technique has been the data acquisition time, which is typically in the range of 25–60 minutes for only a limited amount of brain coverage.11–14 This long scanning time makes it difficult to apply the HARDI technique in clinical cases.
When the single-tensor tractography technique was first introduced clinically, one of the first issues that was raised was the length of the “acquisition time.”23 There is no question that this will also be an issue with multitensor tractography. In this study, we used DWI with an acquisition time of approximately 14 minutes, involving 2 approximately 7-minute time periods. The averaged data of these scans were used to generate the tractography. The total acquisition time of less than 15 minutes for whole-brain coverage is within a clinically feasible timeframe.
A high b-value is known to be useful when combined with HARDI. The downside of using a high b-value is the lower SNR for each acquisition. To overcome the lower SNR, one has to scan the patients for a longer period of time, which conflicts with the need to have a “clinically feasible” acquisition time. Thus, in this study, we did not use a high b-value but the standard b-value for routine clinical imaging (b = 1000 s/mm2), because the study was done in a retrospective fashion using MR datasets obtained for single-tensor tractography. Thus, we were able to test whether our regular data acquisition protocol with a standard b-value would allow the resolution of crossing fibers. The results of our study show that the use of a standard b-value allows the resolution of crossing fibers to a certain extent; thus, the problem is at least in part solved. To further improve the depiction of the face and tongue fibers, a higher b-value may be beneficial; we are, therefore, currently planning a prospective comparison study.
This study has some limitations. First, we did not directly assess the impact of the longer computational time that is necessary to obtain the multitensor dataset for tracking. One of the advantages of using the single-tensor model is the almost instantaneous calculation of the tensor dataset, which allows one to start tracking the fibers soon after the completion of data acquisition. This is not possible with the multitensor technique, which requires much more complex fitting of data. This longer calculation time may be problematic when intraoperative use is contemplated.24 Second, the selection of the threshold for tractography has not yet been standardized. The multitensor tracking algorithm is somewhat more complex than the single-tensor approach and, therefore, would benefit from further optimization. Third, though the multitensor technique seems much more robust than the single-tensor technique, it still fails to depict parts of the fiber tracts; as illustrated in the figures, some parts of the fibers were left undepicted. In general, it was most difficult to depict the fibers from the face region. Use of a higher b-value may resolve this issue. Fourth, there was slight discrepancy in locations of the depicted fibers between single- and multitensor tractography in some of our cases. The exact cause of this phenomenon is not known and needs further investigation. Finally, we did not compare the direct impact on surgical planning of the multitensor approach versus the single-tensor method, because this was a retrospective study. A prospective comparison study is currently underway.
Conclusion
Pyramidal tracts of the face and tongue regions can now be depicted by using DWI done within 15 minutes by using a standard b-value (1000 s/mm2).
Appendix
It is difficult to resolve situations where the angle between 2 tensors is small or when the volume fraction is very unbalanced (eg, 98% of one volume and 2% of the other fiber). Both of these situations can look similar to a single-tensor voxel. Moreover, it is difficult to determine whether the deviation from single tensor is caused by the angle or volume differences. Therefore, a minimum angle and minimum volume fraction is needed before certainty can be claimed with respect to the multitensor outcome. Because there is no “gold standard” in this matter, a simulation analysis was performed for diffusion experiments to sketch the boundaries of such methods at various SNR levels.21 In these simulations it was found that a volume fraction balance of 0.85/0.15 can cause maximum errors of approximately 13°. Further simulation revealed that the size of these errors was related to the applied optimization scheme, resulting in too many local minima in the model fitting process. The multitensor modeling was then improved to overcome these issues, showing a large reduction in the fitting error, even at large volume fractions of up to 95%. In the clinical application of the procedure, we thus set limits of our model fitting to the conservative values of 5% volume fraction and a directional angle π of 12°.
References
- 1.Steinmetz H, Furst G, Freund HJ. Variation of perisylvian and calcarine anatomic landmarks within stereotaxic proportional coordinates. AJNR Am J Neuroradiol 1990;11:1123–30 [PMC free article] [PubMed] [Google Scholar]
- 2.Iwasaki S, Nakagawa H, Fukusumi A, et al. Identification of pre- and postcentral gyri on CT and MR images on the basis of the medullary pattern of cerebral white matter. Radiology 1991;179:207–13 [DOI] [PubMed] [Google Scholar]
- 3.Naidich TP, Valavanis AG, Kubik S. Anatomic relationships along the low-middle convexity: Part I–normal specimens and magnetic resonance imaging. Neurosurgery 1995;36:517–32 [DOI] [PubMed] [Google Scholar]
- 4.Yousry TA, Schmid UD, Alkadhi H, et al. Localization of the motor hand area to a knob on the precentral gyrus. A new landmark. Brain 1997;120:141–57 [DOI] [PubMed] [Google Scholar]
- 5.Mori S, Crain BJ, Chacko VP, et al. Three-dimensional tracking of axonal projections in the brain by magnetic resonance imaging. Ann Neurol 1999;45:265–69 [DOI] [PubMed] [Google Scholar]
- 6.Conturo TE, Lori NF, Cull TS, et al. Tracking neuronal fiber pathways in the living human brain. Proc Natl Acad Sci U S A 1999;96:10422–27 [DOI] [PMC free article] [PubMed] [Google Scholar]
- 7.Poupon C, Clark CA, Frouin V, et al. Regularization of diffusion-based direction maps for the tracking of brain white matter fascicles. Neuroimage 2000;12:184–95 [DOI] [PubMed] [Google Scholar]
- 8.Parker GJ, Stephan KE, Barker GJ, et al. Initial demonstration of in vivo tracing of axonal projections in the macaque brain and comparison with the human brain using diffusion tensor imaging and fast marching tractography. Neuroimage 2002;15:797–809 [DOI] [PubMed] [Google Scholar]
- 9.Mukherjee P. Diffusion tensor imaging and fiber tractography in acute stroke. Neuroimaging Clin N Am 2005;15:655–65 [DOI] [PubMed] [Google Scholar]
- 10.Holodny AI, Ollenschleger MD, Liu WC, et al. Identification of the corticospinal tracts achieved using blood-oxygen-level-dependent and diffusion functional MR imaging in patients with brain tumors. AJNR Am J Neuroradiol 2001;22:83–88 [PMC free article] [PubMed] [Google Scholar]
- 11.Tournier JD, Calamante F, Gadian DG, et al. Direct estimation of the fiber orientation density function from diffusion-weighted MRI data using spherical deconvolution. Neuroimage 2004;23:1176–85 [DOI] [PubMed] [Google Scholar]
- 12.Wedeen VJ, Hagmann P, Tseng WY, et al. Mapping complex tissue architecture with diffusion spectrum magnetic resonance imaging. Magn Reson Med 2005;54:1377–86 [DOI] [PubMed] [Google Scholar]
- 13.Frank LR. Characterization of anisotropy in high angular resolution diffusion-weighted MRI. Magn Reson Med 2002;47:1083–99 [DOI] [PubMed] [Google Scholar]
- 14.Tuch DS. Q-ball imaging. Magn Reson Med 2004;52:1358–72 [DOI] [PubMed] [Google Scholar]
- 15.Kreher BW, Schneider JF, Mader I, et al. Multitensor approach for analysis and tracking of complex fiber configurations. Magn Reson Med 2005;54:1216–25 [DOI] [PubMed] [Google Scholar]
- 16.Staempfli P, Jaermann T, Crelier GR, et al. Resolving fiber crossing using advanced fast marching tractography based on diffusion tensor imaging. Neuroimage 2006;30:110–20 [DOI] [PubMed] [Google Scholar]
- 17.Netsch T, van Muiswinkel A. Quantitative evaluation of image-based distortion correction in diffusion tensor imaging. IEEE Trans Med Imaging 2004;23:789–98 [DOI] [PubMed] [Google Scholar]
- 18.Basser PJ, Mattiello J, LeBihan D. Estimation of the effective self-diffusion tensor from the NMR spin echo. J Magn Reson B 1994;103:247–54 [DOI] [PubMed] [Google Scholar]
- 19.Pierpaoli C, Basser PJ. Toward a quantitative assessment of diffusion anisotropy. Magn Reson Med 1996;36:893–906 [DOI] [PubMed] [Google Scholar]
- 20.Basser PJ, Pajevic S, Pierpaoli C, et al. In vivo fiber tractography using DT-MRI data. Magn Reson Med 2000;44:625–32 [DOI] [PubMed] [Google Scholar]
- 21.Toussaint N, van Muiswinkel A, Hoogenraad FG, et al. Resolving fiber crossings: a two fiber model simulation result. In: Book of Abstracts. Annual Meeting of the International Society for Magnetic Resonance in Medicine: Miami;2005. :1339
- 22.Kinoshita M, Yamada K, Hashimoto N, et al. Fiber-tracking does not accurately estimate size of fiber bundle in pathological condition: initial neurosurgical experience using neuronavigation and subcortical white matter stimulation. Neuroimage 2005;25:424–29 [DOI] [PubMed] [Google Scholar]
- 23.Yamada K, Kizu O, Mori S, et al. Brain fiber tracking with clinically feasible diffusion-tensor MR imaging: initial experience. Radiology 2003;227:295–301 [DOI] [PubMed] [Google Scholar]
- 24.Nimsky C, Ganslandt O, Merhof D, et al. Intraoperative visualization of the pyramidal tract by diffusion-tensor-imaging-based fiber tracking. Neuroimage 2006;30:1219–29 [DOI] [PubMed] [Google Scholar]


