Abstract
BACKGROUND AND PURPOSE: Compared with the image intensifier (I.I.)-TV system, the flat panel detector (FPD) system of direct conversion type has several theoretic advantages, such as higher spatial resolution, wide dynamic range, and no image distortion. The purpose of this study was to compare the image quality of 3D digital subtraction angiography (DSA) in the FPD and conventional I.I.-TV systems using a vascular phantom.
MATERIALS AND METHODS: An anthropomorphic vascular phantom was designed to simulate the various intracranial aneurysms with aneurysmal bleb. The tubes of this vascular phantom were filled with 2 concentrations of contrast material (300 and 150 mg I/mL), and we obtained 3D DSA using the FPD and I.I.-TV systems. First, 2 blinded radiologists compared the volume-rendering images for 3D DSA on the FPD and I.I.-TV systems, looking for pseudostenosis artifacts. Then, 2 other radiologists independently evaluated both systems for the depiction of the simulated aneurysm and aneurysmal bleb using a 5-point scale.
RESULTS: For the degree of the pseudostenosis artifacts at the M1 segment of the middle cerebral artery at 300 mg I/mL, 3D DSA with FPD system showed mild stenoses, whereas severe stenoses were observed at 3D DSA with I.I.-TV system. At both concentrations, the FPD system was significantly superior to I.I.-TV system regarding the depiction of aneurysm and aneurysmal bleb.
CONCLUSION: Compared with the I.I.-TV system, the FPD system could create high-resolution 3D DSA combined with a reduction of the pseudostenosis artifacts.
3D angiographic techniques, including 3D digital subtraction angiography (DSA) and 3D digital angiography, have been used at several institutions with reported clinical benefits and are especially useful for evaluating intracranial aneurysms before surgical or endovascular treatment has been established.1–3 Although the 3D angiography system using conventional image intensifier (I.I.) has been reported helpful for determining 3D vessel structures, there are some problems related to the characteristics of the I.I. 3D angiographic techniques with the image intensifier television (I.I.-TV) system have inferior spatial resolution compared with conventional 2D DSA and do not enable imaging of the entire vascular structure.4 Moreover, a pseudostenosis phenomenon has been reported in previous research.5
Recently, a flat panel detector (FPD) of direct conversion type based on amorphous selenium (a-SE) became commercially available for angiography. Compared with the I.I.-TV system, this angiography system using the FPD has several theoretic advantages, such as high spatial resolution, wide dynamic range, square field of view, and real-time imaging capabilities with no geometric distortion. These advantages would be expected to allow for higher resolution 3D DSA from rotational angiography data; however, no studies have evaluated 3D angiography obtained by the angiography system using the FPD of direct conversion type. The purpose of this study was to compare the image quality of 3D DSA between the FPD system and conventional I.I.-TV system using a vascular phantom.
Materials and Methods
Phantom Design
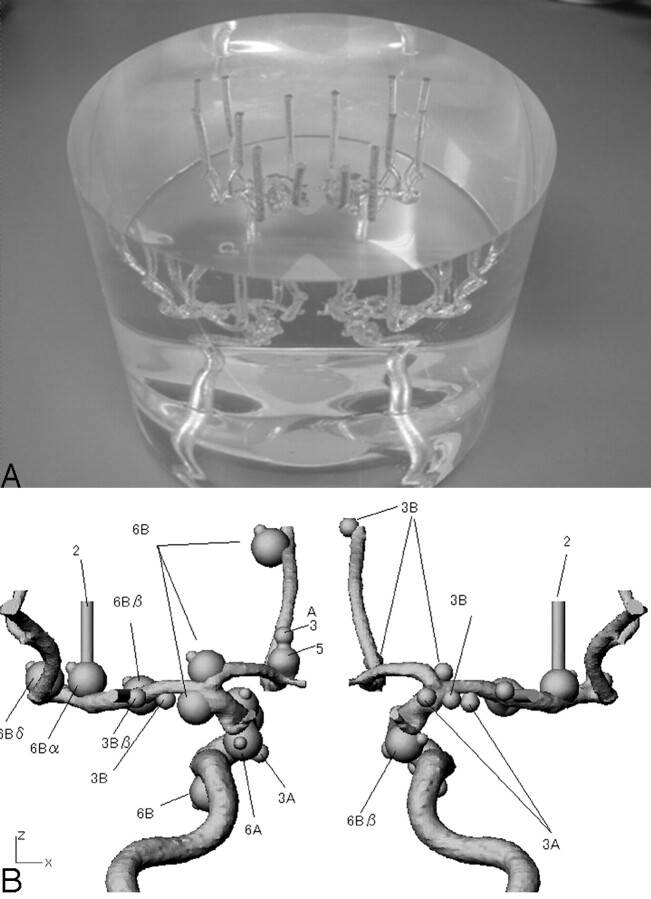
An anthropomorphic vascular phantom (Renaissance of Technology Corporation, Shizuoka, Japan) was designed to simulate bilateral intracranial arteries with various intracranial aneurysms, which were hollowed out of a 19-cm diameter cylinder made of silicone rubber. Two types of simulated aneurysms—17 aneurysms with diameter of 3 mm and 15 aneurysms with diameter of 6 mm—were placed on the simulated internal carotid artery, anterior cerebral artery, and middle cerebral artery (Fig 1). Of the 32 aneurysms, 15 had an aneurysmal bleb with a diameter of 2 mm, which was placed at a tip onto the surface of the aneurysm.
Fig 1.
Photograph (A) and schematic drawing (B) of the anthropomorphic vascular phantom used in this study. The phantom was designed to simulate the intracranial arteries with a total of 32 aneurysms. Of 32 aneurysms, 15 had an aneurysmal bleb with diameter of 2 mm.
Specifications of FPD and I.I.-TV Systems
The FPD angiography system consisted of a 0.5-mm focal spot and an FPD of direct conversion type (Panel Main ASSY, 9) on a motorized C-arm (Safire; Shimadzu, Kyoto, Japan). This newly developed detector has a pixel pitch of 150 μm and an array format of 1536 × 1536 pixels, covering a field of view of 23 cm2. An a-SE film approximately 1000 μm thick is used as an x-ray converter. The I.I.-TV system consisted of a 0.6-mm focal spot and a 12-inch (305-mm) cesium iodide image-intensifying tube (IA16LM; Shimadzu) with an image intensifier matrix of 1024 × 1024 on a motorized C-arm (Safire; Shimadzu). Thus, the 2 detectors compared in this study were mounted on a same motorized C-arm angiography system.
Angiography Protocol
We obtained 3D DSA of the vascular phantom with the FPD system and I.I.-TV system using the same equipment specification (95 KV, 400 mA, 24 mAs). 3D datasets were obtained from rotational series consisting of 2 rotations. This series covers a total angular range of 195° around subjects, with a first rotation of 60° per second to acquire the subtraction mask images and rotation of 60° per second to acquire the opacified images. For opacified images, we sank the vascular phantom into a column-shaped container filled with 2 kinds of contrast material concentration (300 and 150 mg I/mL) of nonionic contrast material (Iopamiron 300; Nihon Schering, Osaka, Japan) so as to fill the cylinder tubes of the phantom with the contrast material without introduction of air bubble. Data were acquired at 30 frames per second with 1024 × 1024 matrices for the both systems. The isocenter for the rotational field was the center of the vascular phantom. The image datasets were immediately transferred to a workstation (DAR-5000; 3D-ANGIO option ver. 3.0; Shimadzu). 3D images were available approximately 5 minutes after 3D data were transferred to a workstation.
Image Analysis of 3D DSA
To assess the image quality of the 3D DSA obtained with 2 systems, the pseudostenosis artifacts and the depiction of simulated intracranial vascular lesions were evaluated. Each image was analyzed separately, and only 1 image was shown at a time. The schematic drawing of an anthropomorphic vascular phantom was always used as the standard of reference (Fig 1B). The volume-rendered display was the only method used for evaluating 3D DSA in this study. The 3D DSA were displayed and interpreted on a diagnostic monitor (Flexscan L365; EIZO NANAO, Ishikawa, Japan).
Evaluation for Pseudostenosis Artifacts
The assessed intracranial vessels included segments of the internal carotid artery (C1 [the terminal segment], C2 [the first part of the cisternal segment], C3 [the carotid knee segment], C4 [the cavernous segment], C5 [the vertical segment], and C6 [the carotid canal segment of the petrous portion]), the middle cerebral artery (M1 [the sphenoidal segment]), the anterior cerebral artery (A1 [the segment from the origin of the anterior cerebral artery to the anterior communicating artery], and A2 [the infracallosal segment]).5
For each vessel segment, 2 neuroradiologists (S.K, J.M.) reviewed the 3D DSA together. They scored the degree of pseudostenosis artifact by consensus according to the following grades: 0, no stenosis; 1, mild stenosis less than 30%; 2, moderate stenosis of 30%–69%; and 3, severe stenosis more than 70%. Likewise, these radiologists also evaluated whether the pseudostenosis artifact affected aneurysm depiction artifact by consensus. Each simulated aneurysm was evaluated as follows: 4, the pseudostenosis artifacts have no influence on aneurysm depiction; 3, the pseudostenosis artifacts caused the minor distortion of aneurysm that did not interfere with diagnostic quality; 2, the pseudostenosis artifacts caused the marked distortion of aneurysm sufficient to interfere with diagnostic quality; 1, the pseudostenosis artifacts caused the severe distortion of aneurysm resulting in nondiagnostic study.
Evaluation of the Aneurysms and Aneurysmal Blebs
For FPD and I.I.-TV systems, 2 neuroradiologists (N.Oh., Y.H.) independently evaluated the reproducibility of 3D DSA in the assessment of simulated aneurysms and aneurysmal blebs, which were not affected by pseudostenosis artifacts. Therefore, we excluded aneurysms and aneurysmal blebs that were classified as having minor, marked, or severe distortion (scores 3, 2, or 1). Aneurysm delineation represented the depiction of the aneurysm neck and the shape of the aneurysm. The 3D images were always evaluated in conjunction with the schematic drawing of an anthropomorphic vascular phantom, and the radiologists rated the aneurysm and aneurysmal bleb depiction using a 5-point scale as follows: 5, excellent (an aneurysm or aneurysmal bleb were depicted with same quality, which is close to that of the schematic drawing); 4, more than adequate (aneurysm or aneurysmal bleb were clearly depicted but image quality somewhat reduced compared with that of the schematic drawing); 3, adequate (depiction of the aneurysm or aneurysmal bleb were still sufficient); 2, insufficient visualization; and 1, not visible. After independent interpretations were performed, the differences in assessment of both observers were resolved by consensus.
Statistical Analysis
For subjective evaluation, statistical analyses were performed with a statistical software package (StatView 5.0; SAS Institute, Cary, NC). For the scores of image quality, all results were expressed as the mean ± SEM for each angiography system and contrast material concentration. Analysis by Wilcoxon signed rank test was performed on the results to assess the statistical significance of the different scores assigned to the FPD and I.I.-TV system. A P value of less than .01 was considered to indicate a statistically significant difference. To evaluate the level of interobserver agreement of scores of image quality, a Kendall W test was performed on the independent scores from 2 radiologists before the consensus review. Kendall W coefficients between 0.5 and 0.8 were considered to indicate good agreement, and coefficients higher than 0.8 were considered to indicate excellent agreement.
Results
Evaluation for Pseudostenosis Artifacts
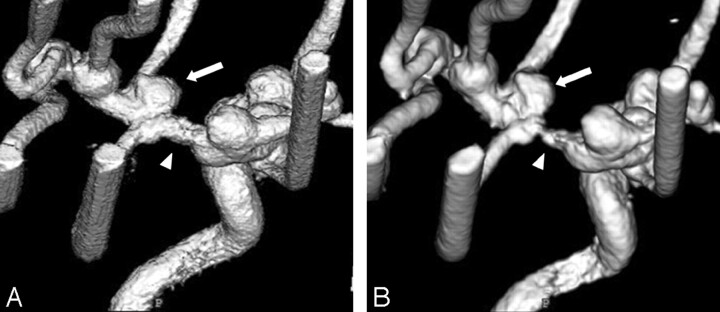
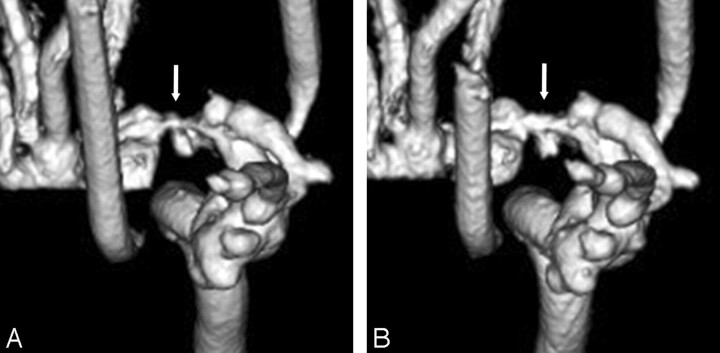
For the evaluation of 72 segments (9 segments × bilateral internal carotid arteries × 2 kinds of contrast material concentration × 2 angiography systems), the pseudostenosis artifacts were only observed in the M1 segments of the middle cerebral arteries on 3D DSA with both systems and other segments demonstrated no stenosis. With regard to pseudostenosis artifact of M1 segments, results of the final consensus reviewed by 2 radiologists are summarized in Table 1. For both contrast material concentrations, the ratings of the 3D DSA with FPD system were either no or mild stenoses (grades 0 or 1). Specifically at 300 mg I/mL, FPD system showed mild stenoses (grade 1), whereas I.I.-TV system showed severe stenoses (grade 3) (Fig 2). For the I.I.-TV system, the comparison between different contrast medium solutions demonstrated that the pseudostenosis artifacts were more severe at 300 mg I/mL than at 150 mg I/mL (Fig 3).
Table 1:
Degree of pseudostenosis artifacts
| Contrast Material Concentration & System | Grade for Pseudostenosis Artifact |
|
|---|---|---|
| Right M1 | Left M1 | |
| 300 mg I/mL | ||
| FPD | 1 | 1 |
| I.I. | 3 | 3 |
| 150 mg I/mL | ||
| FPD | 0 | 1 |
| I.I. | 2 | 2 |
Note:—FPD indicates flat panel detector; I.I., image intensifier; M1, sphenoidal segment of middle cerebral artery. Grades: 0, no stenosis; 1, mild stenosis less than 30%; 2, moderate stenosis of 30%–69%; 3, severe stenosis more than 70%.
Fig 2.
3D DSA from the superior and right posterior oblique view at 300 mg I/mL obtained with FPD system (A) and with I.I.-TV system (B). 3D DSA with FPD system shows mild stenosis at the M1 segment of the middle cerebral artery, whereas severe stenosis is observed on 3D DSA with I.I.-TV system (arrowheads). The pseudostenosis artifact caused the minor distortion of aneurysm on 3D DSA with FPD system, whereas the severe distortion of aneurysm on that with I.I.-TV system (arrows).
Fig 3.
Anteroposterior 3D DSA obtained with I.I.-TV system at 300 (A) and at 150 mg I/mL (B) demonstrated that the pseudostenosis artifacts are more severe at 300 than at 150 mg I/mL (arrows).
The results of the influence of the pseudostenosis artifact on the aneurysm depiction, determined by consensus of the 2 radiologists, are shown in Table 2. For the 3D DSA at a concentration of 300 mg I/mL, the radiologists scored the influence of the pseudostenosis artifact on the aneurysm depiction as an average of 3.66 in the FPD system and 3.16 in the I.I.-TV system (Fig 2). Differences were significant between each system, with a P value of less than 0.01. Likewise, at a concentration of 150 mg I/mL, the average reader ratings were significantly higher in the FPD system than in the I.I.-TV system (mean rating, 3.81 versus 3.31, P < .01).
Table 2:
The influence of the pseudostenosis artifacts on the aneurysm depiction
| Contrast Material Concentration & System | Score for Image Quality |
Mean ± SD | P* | |||
|---|---|---|---|---|---|---|
| 4 | 3 | 2 | 1 | |||
| 300 mg I/mL | ||||||
| FPD (n = 32) | 24 | 5 | 3 | 0 | 3.66 ± 0.65 | <.01 |
| I.I. (n = 32) | 20 | 2 | 5 | 5 | 3.16 ± 1.19 | |
| 150 mg I/mL | ||||||
| FPD (n = 32) | 28 | 2 | 2 | 0 | 3.81 ± 0.54 | <.01 |
| I.I. (n = 32) | 21 | 3 | 5 | 3 | 3.31 ± 1.06 | |
Note:—FPD indicates flat panel detector; I.I., image intensifier. Scale: 4, no influence; 3, minor distortion of aneurysm; 2, marked distortion of aneurysm; 1, severe distortion of aneurysm.
Wilcoxon signed rank test.
Evaluation for the Aneurysms and Aneurysmal Blebs
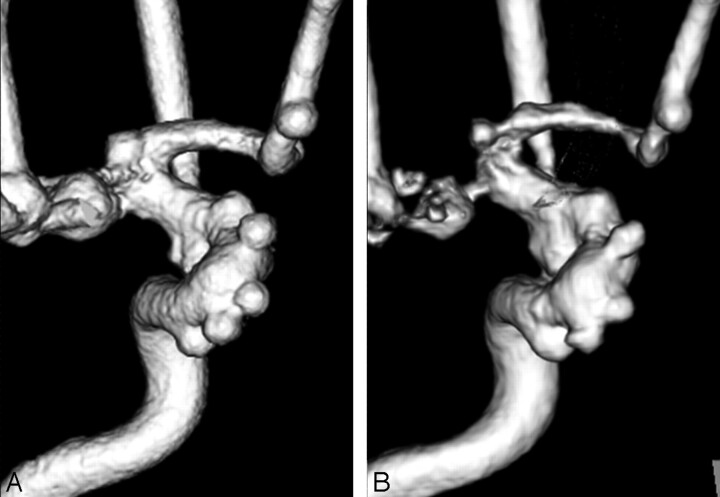
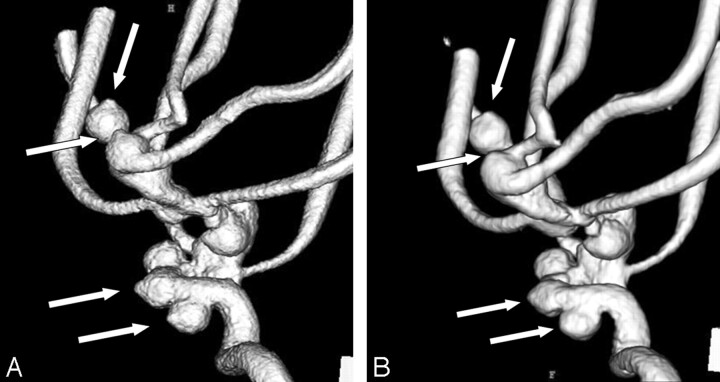
A total of 20 aneurysms and 11 blebs at 300 mg I/mL, and 21 aneurysms and 11 blebs at 150 mg I/mL were not influenced by pseudostenosis artifacts on both angiography systems and used for further evaluation; the results are summarized in Tables 3 and 4. The values given in Tables 3 and 4 are the final scores after the consensus review by the 2 radiologists. The radiologists scored the depiction of aneurysm as an average of 4.05, 3.48 in the FPD system and 3.00, 2.52 in the I.I.-TV system at a concentration of 300 and 150 mg I/mL, respectively (Fig 4). Differences were significant between each system, with a P value of less than 0.01. Likewise, the average reader ratings of the depiction of aneurysmal blebs were significantly higher for FPD system (mean image score = 3.73 and 3.18) than for I.I.-TV system (2.27 and 2.09) at a concentration of 300 and 150 mg I/mL, respectively (Fig 5).
Table 3:
Evaluation for the depiction of simulated aneurysms (I.I.-TV system vs FPD system)
| Contrast Material Concentration & System | Score for Image Quality |
Mean ± SD | P* | ||||
|---|---|---|---|---|---|---|---|
| 5 | 4 | 3 | 2 | 1 | |||
| 300 mg I/mL | |||||||
| FPD (n = 20) | 10 | 3 | 5 | 2 | 0 | 4.05 ± 1.10 | <.01 |
| I.I. (n = 20) | 3 | 4 | 6 | 4 | 3 | 3.00 ± 1.27 | |
| 150 mg I/mL | |||||||
| FPD (n = 21) | 3 | 10 | 4 | 2 | 2 | 3.48 ± 1.14 | <.01 |
| I.I. (n = 21) | 1 | 5 | 3 | 7 | 5 | 2.52 ± 1.20 | |
Note:—FPD indicates flat panel detector; I.I., image intensifier. Scale: 5, excellent; 4, more than adequate; 3, adequate; 2, insufficient visualization; 1, not visible.
Wilcoxon signed rank test.
Table 4:
Evaluation for the depiction of simulated blebs (I.I.-TV system vs FPD system)
| Contrast Material Concentration & System | Score for Image Quality |
Mean ± SD | P* | ||||
|---|---|---|---|---|---|---|---|
| 5 | 4 | 3 | 2 | 1 | |||
| 300 mg I/mL | |||||||
| FPD (n = 11) | 4 | 2 | 3 | 2 | 0 | 3.73 ± 1.19 | <.01 |
| I.I. (n = 1) | 0 | 3 | 1 | 3 | 4 | 2.27 ± 1.27 | |
| 150 mg I/mL | |||||||
| FPD (n = 1) | 1 | 4 | 3 | 2 | 1 | 3.18 ± 1.17 | <.01 |
| I.I. (n = 1) | 0 | 1 | 3 | 3 | 4 | 2.09 ± 1.04 | |
Note:—FPD indicates flat panel detector; I.I., image intensifier. Scale: 5, excellent; 4, more than adequate; 3, adequate; 2, insufficient visualization; 1, not visible.
Wilcoxon signed rank test.
Fig 4.
Anteroposterior 3D DSA (300 mg I/mL) obtained with the FPD system (A) and with the I.I.-TV system (B) show many aneurysms. For depiction of aneurysms such as the aneurysm neck and the shape of the aneurysm, the 3D DSA with FPD system is superior to that with the I.I.-TV system.
Fig 5.
3D DSA (300 mg I/mL) from the right posterior oblique view obtained with FPD system (A) and with I.I.-TV system (B) show many aneurysmal blebs (arrows). For depiction of aneurysmal blebs, the 3D DSA with FPD system is superior to that with the I.I.-TV system.
For evaluation of 3D DSA, interobserver agreement between the 2 radiologists in rating the depiction of aneurysms and aneurysmal blebs was good for both the FPD system and the I.I.-TV system; with Kendall W values (τ), 0.74 versus 0.69 at 300 mg I/mL and 0.65 versus 0.72 at 150 mg I/mL for aneurysms, and 0.60 versus 0.66 at 300 mg I/mL and 0.67 versus 0.64 at 150 mg I/mL for aneurysmal blebs, respectively.
Discussion
Our subjective evaluation for the depiction of aneurysms and aneurysmal blebs on 3D DSA demonstrated that the FPD system was significantly superior to the I.I.-TV system with any kind of contrast material concentration. These good performances of the FPD system seem to be a result of a combination of spatial resolution and signal-to-noise ratio. Modulation transfer function (MTF) is generally accepted as the most important parameter of spatial resolution for characterizing the performance of a detector system. Our FPD system shows a high MTF in previous theoretic analysis and experimental testing.6 In the FPD of direct conversion type used in this study, absorbed x-ray photons are directly converted to electron hole pairs in a conversion layer and then collected as electric charges on storage capacitors.7–9 Therefore, the capability of performing a simple conversion process with the FPD of direct conversion type reduces the scatter fraction of electrons and light photons within the detector in the underpenetrated regions of the image and improves the signal-to-noise ratio.
Recently, Hirai et al5 reported a pseudostenosis phenomenon on the 3D digital angiograms that was observed in vessels that were perpendicular to the axis of rotational angiography and had some degree of length. The authors also demonstrated that the pseudostenosis phenomenon was observed at approximately a third of the 3D digital angiographic examinations obtained with clinical cases and was frequently seen in the M1 segment of the middle cerebral artery, the A1 segment of the anterior cerebral artery, and the C6 segments of the internal carotid artery. The precise mechanism underlying this artifact is unclear; however, the authors have postulated that the pseudostenosis phenomenon could be related to a physical problem regarding the geometric difference in x-ray absorption for contrast material-filled structures. When a vessel has an angle perpendicular to the axis of rotational angiography and has some degree of length, a shortage of image spatial information caused by superimposition of the vessel itself during rotational image acquisition may occur. In an attempt to determine whether the degree of the pseudostenosis artifacts was dependent on contrast material concentration, we separately analyzed 3D DSA obtained at concentrations of 300 and 150 mg I/mL, and our results indicated that the degree of pseudostenosis artifacts at 300 mg I/mL was more severe than that at 150 mg I/mL. Their assumption for mechanism underlying pseudostenosis artifact may also explain why the pseudostenosis artifact in our study was more obvious as the contrast material concentration in the phantom tube increases.
In our study, the pseudostenosis artifacts were observed in the M1 segments of the middle cerebral arteries for both systems, and the pseudostenosis artifacts were more severe with I.I.-TV system than with FPD system. The dynamic range of our FPD system is 1:10,000, whereas that of the I.I.-TV system is approximately 1:4000, according to the manufacturers’ specifications. The difference in dynamic range may explain why there were few pseudostenosis artifacts on 3D DSA with FPD system; the wide dynamic range with FPD system might reduce the sampling deficiencies during the rotational angiography.
Our study design using a phantom was chosen because it is impossible to perform a direct comparison of FPD and I.I.-TV systems in a clinical study, which requires a higher radiation dose and contrast material delivered to a patient during angiography examination. In this study, 3D DSA was performed with the same angiography system and same equipment specification, except the detectors, which enabled direct comparison between detector performance of FPD and I.I.
Our study had the following limitations. First, we arbitrarily selected the range of contrast material concentration of contrast agent, because these have not been evaluated in the previous literature. The use of concentrations of 300 and 150 mg I/mL may not reflect the clinical reality, though we might suspect that the iodine concentration at the internal carotid artery would be between 300 and 150 mg I/mL. It is important to note that the 3D DSA with FPD system was superior to that with I.I.-TV system with 2 concentrations of contrast material. Second, as a limitation of our phantom design, no superimposed bone skull structures were simulated. Therefore, the absorption of the phantom in our study was much more homogeneous than the absorption of different areas of the actual human head (eg, the areas superimposed over the skull base versus those superimposed over the brain only). In addition, our phantom was much less dynamic in terms of absorption range than an actual human head. Third, the volume-rendering technique was the only 3D display method used in this study, because this technique, regarding the evaluation of intracranial aneurysms, is the most favored procedure for reconstruction in the widely applied postprocessing method for rotational angiography data.4,10 However, the volume-rendering technique seems to be less effective than the maximum intensity projection technique for evaluating the exact degree of pseudostenosis artifact.11 This can be explained by the arbitrary determination of low and upper thresholds for data exclusion when performing the volume-rendering technique.
In conclusion, our study should be regarded as a step toward appraising the use of FPD technology in interventional neuroradiology. Our FPD angiography systems based on a-SE could create high-quality 3D DSA, which was significantly superior to 3D DSA with the I.I.-TV system, combined with a reduction of artifacts caused by the pseudostenosis phenomenon. Our phantom study may not fully reflect the clinical reality for the performance of the FPD system; therefore, further investigation in clinical situations must be performed to evaluate high-quality 3D DSA using the FPD system regarding variable intracranial vascular lesions such as arteriovenous malformation or aneurysm.
References
- 1.Anxionnat R, Bracard S, Ducrocq X, et al. Intracranial aneurysms: clinical value of 3D digital subtraction angiography in the therapeutic decision and endovascular treatment. Radiology 2001;218:799–808 [DOI] [PubMed] [Google Scholar]
- 2.Tanoue S, Kiyosue H, Kenai H, et al. Three-dimensional reconstructed images after rotational angiography in the evaluation of intracranial aneurysm: surgical correlation. Neurosurgery 2000;47:866–71 [DOI] [PubMed] [Google Scholar]
- 3.Anxionnat R, Bracard S, Macho J, et al. 3D angiography: clinical interest—first applications in interventional neuroradiology. J Neuroradiol 1998;25:251–62 [PubMed] [Google Scholar]
- 4.Sugahara T, Korogi Y, Nakashima K, et al. Comparison of 2D and 3D digital subtraction angiography in evaluation of intracranial aneurysms. AJNR Am J Neuroradiol 2002;23:1545–52 [PMC free article] [PubMed] [Google Scholar]
- 5.Hirai T, Korogi Y, Ono K, et al. Pseudostenosis phenomenon at volume-rendered three-dimensional digital angiography of intracranial arteries: frequency, location, and effect on image evaluation. Radiology 2004;232:882–87 [DOI] [PubMed] [Google Scholar]
- 6.Adachi S, Hori N, Sato K, et al. Experimental evaluation of a-Se and CdTe flat-panel x-ray detectors for digital radiography and fluoroscopy. Proc SPIE 2000;3977:38–47 [Google Scholar]
- 7.Rowlands JA, Hunter DM, Araj N. X-ray imaging using amorphous selenium: a photoinduced discharge readout method for digital mammography. Med Phys 1991;18:421–31 [DOI] [PubMed] [Google Scholar]
- 8.Chotas HG, Dobbins JT, Rabin CE. Principles of digital radiography with large area, electronically readable detectors: a review of the basics. Radiology 1999;210:595–99 [DOI] [PubMed] [Google Scholar]
- 9.Zhao W, Ji WG, Debrie A, et al. Imaging performance of amorphous selenium based flat-panel detectors for digital mammography: characterization of a small area prototype detector. Med Phys 2003;30:254–63 [DOI] [PubMed] [Google Scholar]
- 10.Hirai T, Korogi Y, Suginohara K, et al. Clinical usefulness of unsubtracted 3D digital angiography compared with rotational digital angiography in the pretreatment evaluation of intracranial aneurysms. AJNR Am J Neuroradiol 2003;24:1067–74 [PMC free article] [PubMed] [Google Scholar]
- 11.Marcus CD, Ladam-Marcus VJ, Bigot JL, et al. Carotid arterial stenosis: evaluation at CT angiography with the volume-rendering technique. Radiology 1999;211:775–80 [DOI] [PubMed] [Google Scholar]


