

Abstract
BACKGROUND AND PURPOSE: More than 85% of brain traumas are classified as “mild”; MR imaging findings are minimal if any and do not correspond to clinical symptoms. Our goal, therefore, was to quantify the global decline of the neuronal marker N-acetylaspartate (NAA), as well as gray (GM) and white matter (WM) atrophy after mild traumatic brain injury (mTBI).
MATERIALS AND METHODS: Twenty patients (11 male, 9 female; age range, 19−57 years; median, 35 years) with mTBI (Glasgow Coma Scale score 13−15 with loss of consciousness for at least 30 seconds) and 19 age- and sex-matched control subjects were studied. Seven patients were studied within 9 days of TBI; the other 13 ranged from 1.2 months to 31.5 years (average and median of 4.6 and 1.7 years, respectively) after injury. Whole-brain NAA (WBNAA) concentration was obtained in all subjects with nonlocalizing proton MR spectroscopy. Brain volume and GM and WM fractions were segmented from T1-weighted MR imaging and normalized to the total intracranial volume, suitable for intersubject comparisons. The data were analyzed with least squares regression.
RESULTS: Patients with mTBI exhibited, on average, a 12% WBNAA deficit that increased with age, compared with the control subjects (p < .05). Adjusted for age effects, patients also suffered both global atrophy (−1.09%/year; P = .029) and GM atrophy (−0.89%/year; P = .042). Patients with and without visible MR imaging pathology, typically punctate foci of suspected shearing injury, were indistinguishable in both atrophy and WBNAA.
CONCLUSION: WBNAA detected neuronal/axonal injury beyond the minimal focal MR-visible lesions in mTBI. Combined with GM atrophy, the findings may provide further, noninvasive insight into the nature and progression of mTBI.
Each year, nearly 2 million traumatic brain injuries (TBIs), the leading cause of death and disability in children and young adults, occur in the United States.1 Its survivors incur an annual cost, beyond long-term disability, pain, and personal hardship, including direct expenses and lost income, of more than $40 billion, ∼0.5% of the GNP.2 TBI is most common in 15–24-year-olds, peaking in 20–24-year-old men by an order of magnitude over any other age or sex group. Overall, men are more than twice as likely to sustain TBI.3–5 While neurocognitive deficits are thought to persist in ∼100% of severe, 67% of moderate, and 10% of mild injury victims,3 studies have suggested that these figures may significantly underestimate the long-term sequelae of mild and moderate TBI,6,7 which together account for more than 90% of cases.8
Neuronal/axonal injury has been implicated as the leading pathologic lesion of TBI, with secondary damage resulting from numerous neurodegenerative cascades.9 Indeed, diffuse axonal injury, attributed to shearing stresses from acceleration/deceleration, typically occurs in the white matter (WM) of the cerebral hemispheres, corpus callosum, and brain stem, especially in severe TBI.10,11 Such injury is also supported by animal models of mild and moderate TBI,12 where cortical contusions and axonal damage have followed the well characterized fluid-percussion injury13–15 with subcortical cell loss continuing for at least a year.16 Furthermore, evidence of apoptosis at sites distal to the primary injury continued for several weeks after experimental TBI.17,18 Inflammation may also play a role in progressive neuronal degeneration.19
A striking and unpredictable discordance is often observed between the minimal findings on conventional MR imaging and the extent of neurocognitive deficits exhibited by patients with mild TBI (mTBI). To explain this, several advanced, quantitative MR techniques (eg, localized proton MR spectroscopy [1H-MR spectroscopy] and magnetization transfer imaging20–23) have been used to gauge the injury. Without MR imaging guidance to a specific pathologic condition, however, these methods are limited to sampling only a few suspected regions, which, as a result of lipid contamination (in 1H-MR spectroscopy) and poor contrast (for MR imaging), avoid most of the cortical gray matter (GM).
Based on the involvement of complex neurocognitive pathways and the paucity of clinical MR imaging findings, we hypothesize that mTBI is a diffuse disorder affecting the integrity of neurons and their axonal processes. Therefore, we further hypothesize that it may be assessed via 1) the global decline of the neuronal marker N-acetylaspartate (NAA), an amino acid that also yields the largest peak in the brain's 1H-MR spectrum,24–27 and 2) global GM and WM atrophy. This will be examined by comparing the whole-brain NAA (WBNAA) concentration and atrophy in patients with mTBI with age- and sex-matched healthy control subjects.
Materials and Methods
Human Subjects
Twenty patients (11 male, 9 female; median age, 35 years; range, 19−57 years) with mTBI (Glasgow Coma Scale [GCS] scores of 13−15 at emergency department admission and loss of consciousness for at least 30 seconds) and 19 age- and sex-matched healthy control subjects (age range, 21−61; median age, 39 years) were recruited. Seven patients were scanned within 9 days of injury and the other 13 after an average of 4.6 years (median, 1.7 years; range, 0.1−31.5 years). Enrollment was consecutive for patients with recent trauma and random from an author's database (R.I.G.) for remote trauma. The following exclusion criteria were used: medically unstable, contraindications for MR imaging (eg, intracranial clips, metal implants, external metallic devices/objects/clips within 10 cm of the head, suspected or confirmed metal in eyes, claustrophobia, cardiac pacemaker), pregnancy, other neurologic disorders, and alcoholism or drug dependency. Their relevant statistics are compiled in Table 1 for the patients and Table 2 for control subjects. All subjects were briefed on the procedure and gave Institutional Review Board-approved written consent.
Table 1:
Demographics of patients with mTBI and MR imaging findings suggestive of axonal injury (AI)
| No. | Age/Sex | Injury | Elapsed Time* | PBV† | PGM† | PWM† | WBNAA (mmol/L) | MRI Findings |
|---|---|---|---|---|---|---|---|---|
| 1 | 19/F | MVA | 3.8 years | 93.3 | 56.0 | 37.4 | 10.7 | Normal |
| 2 | 21/M | Assault | 1.2 years | 91.8 | 58.5 | 33.2 | 13.1 | Punctate AI foci |
| 3 | 22/M | MVA | 1 year | 94.4 | 60.0 | 34.4 | 13.1 | Normal |
| 4 | 25/M | Assault | 2.4 months | 94.8 | 56.8 | 37.9 | 12.1 | Punctate AI foci |
| 5 | 25/F | MVA | 8 days | 92.0 | 57.3 | 34.7 | 14.6 | Normal |
| 6 | 28/M | Assault | 1.2 months | 90.1 | 58.2 | 31.9 | 11.5 | Normal |
| 7 | 30/F | Assault | 7 months | 92.8 | 56.5 | 36.3 | 14.8 | Normal |
| 8 | 30/M | MVA | 3 years | 78.0 | 45.1 | 32.9 | 12.5 | Old contusion, volume loss, AI foci |
| 9 | 31/F | Fall | 1 day | 93.6 | 52.2 | 41.3 | 6.2 | Normal |
| 10 | 35/F | BA | 3 days | 84.7 | 54.8 | 29.9 | 10.5 | Normal |
| 11 | 35/F | MVA | 31.5 years | 86.1 | 55.3 | 30.8 | 10.4 | Old contusion, AI foci |
| 12 | 36/F | Assault | 9 days | 89.7 | 50.2 | 39.5 | 13.2 | Normal |
| 13 | 37/M | BA | 3 days | 89.6 | 59.2 | 30.4 | 15.0 | Normal |
| 14 | 39/M | MVA | 6.3 months | 89.4 | 51.0 | 38.3 | 9.5 | Normal |
| 15 | 41/M | Other† | 2 days | 89.8 | 51.0 | 38.8 | 9.1 | Normal |
| 16 | 43/M | MVA | 4.3 years | 91.6 | 53.6 | 37.9 | 11.9 | Normal |
| 17 | 47/M | Fall | 7.9 years | 83.0 | 48.5 | 34.4 | 9.6 | AI focus |
| 18 | 47/F | MVA | 1.7 years | 90.3 | 51.3 | 39.0 | 9.2 | Normal |
| 19 | 49/F | Fall | 4.6 years | 79.6 | 49.6 | 30.0 | 14.0 | Normal |
| 20 | 57/M | Fall | 9 days | 91.8 | 57.4 | 34.4 | 6.1 | Right frontal hemorrhage |
| Avg ± SD | 35 ± 10 | 89.3 ± 4.7 | 54.1 ± 4.1 | 35.2 ± 3.5 | 11.3 ± 2.6 |
Note:—mTBI indicates mild traumatic brain injury; PBV, percentage brain volume; PGM, percentage gray matter; PWM, percentage white matter; WBNAA, whole-brain N-acetylaspartate; MVA, motor vehicle crash; BA, bicycle accident. All patients had a GCS score of 15.
Time from injury to examination.
Injury involving a power tool.
Table 2:
Demographic information and data for control subjects
| No. | Age/Sex | PBV (%) | PGM (%) | PWM (%) | WBNAA (mmol/L) |
|---|---|---|---|---|---|
| 1 | 21/M | 89.1 | 55.4 | 33.7 | 17.87 |
| 2 | 21/F | 87.0 | 59.0 | 28.1 | 12.21 |
| 3 | 23/M | 89.4 | 55.3 | 34.0 | 10.60 |
| 4 | 27/M | 89.3 | 51.6 | 37.8 | 9.18 |
| 5 | 27/F | 89.1 | 55.5 | 33.7 | 16.46 |
| 6 | 27/F | 94.6 | 56.4 | 38.3 | 11.49 |
| 7 | 28/M | 91.9 | 51.7 | 40.2 | 10.13 |
| 8 | 29/F | 87.4 | 51.4 | 36.0 | 9.57 |
| 9 | 31/M | 92.4 | 51.2 | 41.2 | 13.87 |
| 10 | 39/F | 90.9 | 55.0 | 35.9 | 12.01 |
| 11 | 39/M | 85.1 | 51.2 | 33.9 | 13.50 |
| 12 | 39/F | 94.8 | 60.6 | 34.1 | 14.40 |
| 13 | 39/M | 87.9 | 56.2 | 31.6 | 12.29 |
| 14 | 40/F | 92.1 | 59.0 | 33.0 | 10.71 |
| 15 | 41/M | 88.5 | 52.5 | 36.1 | 11.86 |
| 16 | 43/M | 86.3 | 53.4 | 32.9 | 16.07 |
| 17 | 44/M | 87.0 | 54.5 | 32.7 | 16.48 |
| 18 | 50/F | 89.6 | 56.4 | 33.2 | 12.60 |
| 19 | 61/M | 82.6 | 52.1 | 30.5 | 13.24 |
| Avg ± SD | 35 ± 11 | 89.2 ± 3.1 | 54.7 ± 2.9 | 34.6 ± 3.2 | 12.87 ± 2.49 |
Note:—PBV indicates percentage brain volume; PGM, percentage gray matter; PWM, percentage white matter; WBNAA, whole-brain N-acetylaspartate.
MR Imaging Segmentation—Brain Volumetry
Brain Volume.
Each subject's whole-brain volume, VB, was obtained from T1-weighted sagittal magnetization-prepared rapid acquisition of gradient echo (MPRAGE), TE, 7.0 ms; TR,14.7 ms; TI, 300 ms; 128 sections; 1.5-mm section thickness; 256 × 256 matrix; FOV, 210 × 210-mm2; MR imaging performed using the MIDAS package.28 Specifically, a “seed” region was placed in periventricular WM followed by selection of all pixels at or above GM signal intensity (SI) and brain mask construction by 1) morphologic erosion, 2) recursive region growth, which retains pixels connected to the “seed” region, and 3) morphologic inflation to reverse the effect of erosion. Next, the masks were truncated at the foramen magnum to incorporate the brain stem and cerebellum but not the cord. VB was the product of the number of pixels in the mask and their volume. An example of the brain mask is shown in Fig 1.
Fig 1.

Segmentation performance. T1-weighted sagittal images were used to construct a whole-brain (WB) mask, subdivided here into GM and WM masks, using a threshold halfway between their respective signal intensities. Our partial volume technique enables better, subpixel, precision. CSF masks were created from T2-weighted MR imaging.
GM and WM Volumes.
Each subject's whole-brain mask was further segmented into GM and WM (VGM and VWM) using a partial volume technique to facilitate subpixel precision.29 First, the signal intensities of cortical GM (SGM) and periventricular WM (SWM) were measured. Then, each pixel in the brain mask was classified as GM only (SI ≤ 0.8 × SGM + 0.2 × SWM), WM only (SI ≥ 0.2 × SGM + 0.8 × SWM), or their admixture (0.8 × SGM + 0.2 × SWM ≤ SI ≤ 0.2 × SGM + 0.8 × SWM). Each mixed pixel was then subdivided into GM and WM fractions based on its relative SI in the GM-WM continuum: GM fraction = (SWM − SI)/(SWM − SGM) and WM fraction = (SI − SGM)/(SWM − SGM). Last, VGM was the product of the pixel volume and sum of “GM only” pixels plus “partial GM fractions.” VWM was calculated similarly. An example of the performance of this process is given in Fig 1.
CSF Volume.
Each subject's CSF volume (VCSF) was obtained from T2-weighted axial fast spin-echo (TE, 119 ms; TR, 7900 ms; 50 sections; 3-mm section thickness; matrix, 256 × 256; FOV, 210 × 210 mm2) MR imaging. This sequence was selected over MPRAGE for superior contrast/noise between CSF and brain. The MPRAGE also does not facilitate good differentiation of CSF from the dura and air-filled sinuses. First, parenchymal (GM-WM junction) and ventricular CSF (avoiding choroid plexus) SIs were averaged. All pixels above this average were highlighted, and those outside the CSF (eg, paranasal sinusitis and vitreous and aqueous humor, which were inappropriately included) were manually deleted. The resultant CSF mask was truncated at the foramen magnum, and VCSF was calculated as the product of the number of pixels in the mask by their volume. An example of the outcome of this process is shown in Fig 1.
MR Spectroscopy—WBNAA Quantification
The amount of whole-brain NAA, QNAA, was measured in a 1.5T imager (Siemens, Erlangen, Germany) using a standard quadrature head coil. Shimming to a 15 ± 4-Hz whole-head water linewidth was followed by nonlocalizing 1H-MR spectroscopy (TE, 0 ms; TI, 940 ms; TR, 10,000 ms).26 Quantification was done against a reference 3-L sphere of 1.5 × 10⁻² moles of NAA in water. Subject and reference NAA peaks, SS and SR, were integrated, as shown in Fig 2, and QNAA was obtained as,
 |
VR180° and VS180° are the transmitter voltages for nonselective 1-ms 180° inversion pulses on the reference and subject, reflecting relative coil loading and, by reciprocity, sensitivity.
Fig 2.

Whole-head 1H spectra, left patient 9, right (matched) control subject 5 in Tables 1 and 2. The hatched regions indicate the peak-areas used to obtain QNAA of Eq 1. Note the excellent lipid suppression. Also note that localization relies on knowledge that NAA, unlike the other metabolites (eg, choline, creatine, etc), is exclusive to neuronal cells.
Normalizations
To normalize for differences in head size among subjects, VB, VGM, and VWM were divided by total intracranial volume (VB + VCSF) and multiplied by 100, yielding the volume percentage of these compartments: PBV, PGM, and PWM. Cross-sectional comparison of these metrics can detect global brain atrophy as well as GM and WM losses.30 For the same reason, QNAA was expressed as the specific, brain size-independent, whole-brain concentration, WBNAA = QNAA/VB mmol/L. Intersubject variability of WBNAA in control subjects was shown to be better than ± 6%.26
Statistical Analyses
Least-squares regression was used to compare patients with mTBI and control subjects with respect to WBNAA, PBV, PGM, and PWM with and without adjusting for the effects of age and sex. A separate univariate analysis was conducted for WBNAA and each of the volumetric assessments. In each case, the MR imaging/MR spectroscopy metrics constituted the dependent variable, whereas the model included subject group (mTBI versus control) as a classification factor and considered subject age and sex as covariates. The model examined the interactions of subject group with each covariate to assess whether differences between patients and control subjects were dependent on age or sex. Least-squares regression was also used to determine whether WBNAA, PBV, PGM, and PWM are associated with age or sex in the study group as a whole (patients with mTBI and control subjects combined) or with elapsed time since injury among the patients.
Finally, the association of PBV, PGM, PWM, and WBNAA with MR imaging findings was evaluated using logistic regression. The binary variable identifying patients with visible MR imaging lesions constituted the dependent variable, and subject sex, age at imaging, and elapsed time from injury to imaging were considered covariates. The association of each volumetric and spectroscopic assessment with MR imaging findings was assessed both with and without adjustment for the covariates. A Mann-Whitney test and least-squares regression were used to compare subjects with and without visible MR imaging findings in terms of PBV, PGM, PWM, and WBNAA with and without adjustment for the covariates, respectively.
Results from the statistical tests to compare patients with control subjects and to assess age-related changes in each metric were declared significant at the 1-sided 5% significance level because patients were hypothesized to exhibit parenchymal and WBNAA losses as well as age-related decline. All other statistical tests were conducted at the 2-sided 5% significance level.
Results
The WBNAA and volumetric measures for patients with mTBI and control subjects are shown in Fig 3 and compiled in Tables 1 and 2. WBNAA (mean ± SD) among patients was 11.34 ± 2.59 mmol/L whereas PBV, PGM, and PWM were 89.3 ± 4.7%, 54.1 ± 4.1%, and 35.2 ± 3.5%, respectively. For the control subjects, WBNAA was 12.87 ± 2.49 mmol/L, and PBV, PGM, and PWM measured 89.2 ± 3.1%, 54.7 ± 2.9%, and 34.6 ± 3.2%, respectively. All patients with mTBI, who each had a GCS score of 15, suffered blunt head trauma (eg, motor vehicle crash, bicycle accident, fall, assault) as described in Table 1. Some of these patients experienced residual headaches, neck stiffness, nausea, dizziness, poor balance, photophobia, as well as memory and sleep disturbances. MR imaging-visible lesions were seen in 30% of patients, also summarized in Table 1. These lesions were most commonly punctate foci of suspected axonal injury, seen as hemorrhage in the acute/subacute setting and gliosis for distant trauma in regions known to be susceptible to shearing. All MR imaging examinations were normal for the control subjects.
Fig 3.
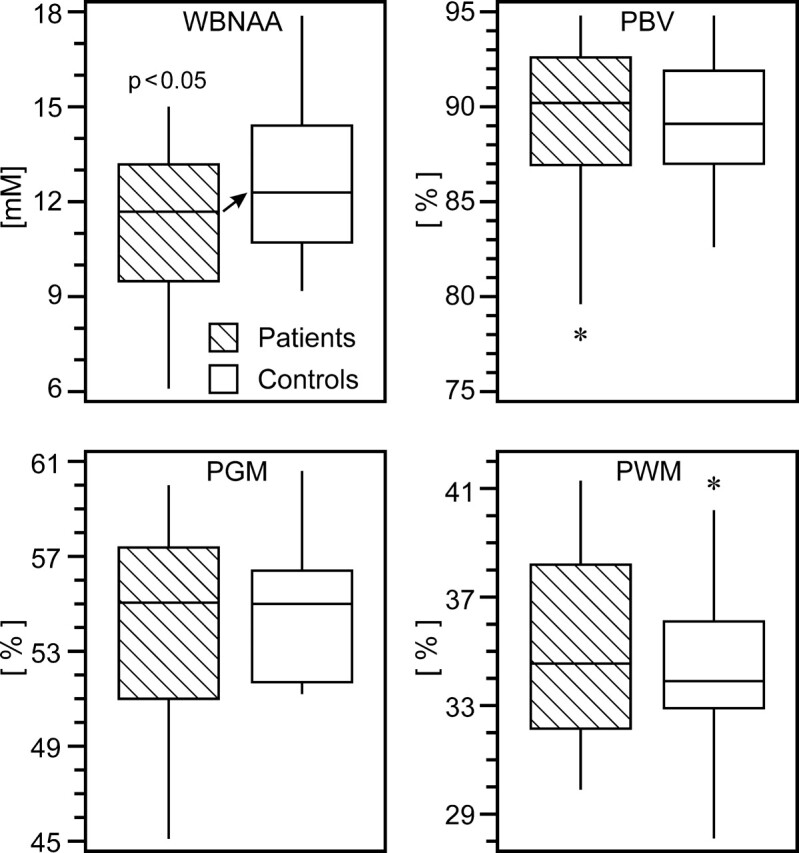
Box plots of 1st, 2nd (median), 3rd quartiles (box), ± 95% (whiskers) and outliers (*) for WBNAA, PBV, PGM, and PWM in patients (hatched) and control subjects. Note the significant WBNAA deficit in patients (arrow), reflecting diffuse neuronal injury. Although PBV and PGM did not significantly differ between patients and control subjects, the wide range of the lower half of the patient distributions suggests a subset suffered global and GM atrophy.
Patients exhibited significant WBNAA deficits relative to control subjects both with (P = .037) and without (P = .034) adjusting for age and sex (Fig 3). These deficits increased with age, a trend that approached significance (P = .052), as shown in Fig 4. Considered alone, patients showed significant age-related WBNAA decline (P = .035), whereas the control subjects did not (P = .307). This analysis was repeated, excluding patient 20 from Table 1 because of 1) potential susceptibility effects on the WBNAA measurement introduced by the right frontal hemorrhage and 2) as the oldest patient, any age-related statistical analysis would possibly be influenced. WBNAA deficits relative to control subjects showed trends toward significance both with (P = .067) and without (P = .059) adjusting for age and sex. These deficits, however, did not increase with age (P = .164) as patients did not demonstrate age-related WBNAA decline (P = .175).
Fig 4.

Scatter plot of WBNAA versus age for mild TBI patients and their matched control subjects. Note that WBNAA deficits increased with age, indicating greater neuronal injury after mild trauma, which may help explain part of their generally worse prognosis.
On the other hand, patients and control subjects were indistinguishable (p > 0.292) with respect to each of the 3 volumetric measures (Fig 3), with 95% confidence intervals for the mean difference between the 2 cohorts ranging from −2.1% to 2.0% for PBV, −1.3% to 2.5% for PGM, and −2.4% to 1.2% for PWM. In addition, there was no significant interaction between subject group (mTBI versus control) and subject age in terms of their effect on each MR imaging metric.
Across all subjects, a significant age-related effect was noted in PBV (P = .013) along with a trend approaching significance for PGM (P = .053), which was observed neither in PWM nor WBNAA (p > 0.174). In contrast, sex exhibited no significant effects (p > 0.323).
Adjusted for the effects of age above, PBV and PGM exhibited significant cross-sectional declines with time elapsed since TBI (P = .029 and P = .042), as shown in Fig 5. PWM and WBNAA remained stable over time (p > 0.292). One patient, 11 in Table 1, was excluded from this analysis because the time elapsed since her injury was extremely long relative to the others (31.5 years) and would potentially exert disproportionate influence.
Fig 5.

Scatter plots of WBNAA, PBV, and PGM versus time from TBI. Although WBNAA remained statistically stable, volumetric measures revealed global atrophy, localized mostly to GM, suggesting that the eventual pathologic outcome of mild TBI is loss of cortical neurons. Stable WBNAA suggests that this loss, measured by QNAA, continued well after the initial traumatic insult but at the same pace as global atrophy.
Finally, the spectroscopic and volumetric assessments were not associated with the presence of MR imaging-visible lesions, both with (p > 0.169) and without (p > 0.265) adjusting for the effects of age, sex, and elapsed time from injury to imaging.
Discussion
The patients with mTBI in this study experienced a significant, ∼12%, average WBNAA reduction relative to their control subjects (Figure 3). This deficit is consistent with diffuse neuronal and axonal damage because these patients were not known to have suffered any other neurologic insult; focal MR imaging-visible lesions were seen in only 6 of 20 patients. Any NAA loss within or susceptibility effects introduced by these lesions, which are typically punctate foci of suspected shearing injuries, would be far too small to account for the global decline across all patients. Furthermore, there was no significant difference in either atrophy or WBNAA loss between the 6 patients who had MR imaging visible pathology and the 14 who did not. This finding indicates that 1) the damage is diffuse throughout the brain and not restricted to the foci of evident MR imaging pathology, and 2) detectable WBNAA deficits exist even in patients with mTBI and no MR imaging findings. When comparing atrophy, however, no significant differences were found between patients and control subjects (Fig 3). Therefore, WBNAA seems to be more sensitive to the consequences of mTBI − widespread neuronal injury.
Despite similar trauma severity in this cohort (the mildest, GCS = 15, for all patients), larger WBNAA deficits were found in older patients than in their younger counterparts (Fig 4) when including patient 20 from Table 1, suggesting that advanced age increases vulnerability to TBI. Prior studies have shown that elderly patients have worse functional outcome scores, increased mortality, and greater need for inpatient rehabilitation after isolated TBI that is often less severe than in younger persons.31–33 Although none of the patients in this cohort were elderly per se, WBNAA analysis suggests that their poorer prognosis may be due to more extensive neuronal injury. Perhaps neuronal accumulation of β-amyloid precursor protein after TBI has a synergistic effect with age and disease (eg, Alzheimer) related deposition.34–36 Thus, the interaction between the noninvasive WBNAA measurement and age may provide an early window into this phenomenon. However, when excluding patient 20, whose WBNAA measurement may have been influenced by susceptibility effects from parenchymal hemorrhage, there was no age-related WBNAA effect. As the oldest patient in the study, patient 20 also heavily influences any age-related statistical analysis. Therefore, additional older patients with mTBI need to be analyzed to further assess any possible age-related phenomenon.
Volumetric measures of atrophy, specifically PBV and PGM, were more informative in patients at longer time intervals after injury (Fig 5). Whereas the WBNAA deficits remained constant after TBI, the patients experienced progressive cross-sectional global atrophy (−1.09% per year), reflected mostly in GM loss (−0.89% per year), after adjusting for age. Whole-brain atrophy after TBI has previously been reported,37,38 but to our knowledge, this is the first time the relative contributions of the GM and WM have been quantified. Not coincidentally, GM loss and NAA deficits are complementary findings because NAA is more concentrated in GM than in WM.39 Stable post-TBI WBNAA, normalized to a gradually decreasing brain volume, indicates that QNAA (ie, neuronal loss [WBNAA = QNAA/VB mmol/L]) progresses at the same pace as atrophy well after the initial insult. This finding is consistent with animal models, which have shown continued neuronal loss extending over several months to a year.16,18
GM atrophy suggests that the eventual pathologic end point of mTBI is loss of cortical neuronal somata. Two possible mechanisms can be responsible. First, the injury could affect cortical structures as the brain impacts the cranial vault in a coup-contrecoup manner.40 Second, diffuse shearing injuries could cause axonal damage, leading to retrograde degeneration and neuronal somatic loss. Postsynaptive cortical atrophy may also result from diminished anterograde transmission. Singleton et al41 has shown in a rat TBI model that neuronal cell bodies continuous with traumatized axons do not show acute degenerative changes. However, these animals were only followed for 7 days. In other animal studies, cortical neuronal loss has been seen up to a year after TBI,16 with chromatolysis and somatic accumulation of β-amyloid precursor protein soon after injury.34–36,42 The underlying mechanisms that lead to neuronal loss are complex, more than simple axonal crush or transection, and determining which is predominant in humans is difficult because of the nonfatal nature of mTBI, precluding immediate postmortem analysis. However, based on the relative preservation of PWM, there likely is gliotic replacement of any WM tissue destruction.
The 3 metrics that exhibited significant reduction between patients and control subjects (WBNAA) or with time elapsed since mTBI (PBV, PGM) showed considerable overlap of the middle half of their distributions (Fig 3). This is not surprising considering the mild nature of their trauma, which could be insufficient for detectable neuronal injury by either WBNAA or volumetric imaging. The power of these global measures, however, is in detecting and quantifying diffuse neuronal injury across a population of mildly affected persons.
The main limitation of our WBNAA and volumetric approach is its lack of spatial specificity. Atrophy after TBI has already been reported in specific structures (eg, the hippocampus, thalamus, fornix, corpus callosum, and cingulate gyrus),43–47 and local NAA deficits have been shown in the splenium of the corpus callosum, basal ganglia, medial temporal lobe, and thalamus.20,23,48,49 With growing evidence that TBI is a diffuse disorder, however, such analyses may provide only a partial picture of the true extent of the pathology. Furthermore, most of the patients examined in the previous studies suffered moderate-to-severe TBI, not the much more common mild injury, which accounts for more than 85% of traumas.50 Conventional MR imaging, in contrast, is too often unremarkable after mTBI, despite residual neurocognitive deficits.51,52 Sacrificing localization for sensitivity and coverage, therefore, may be a reasonable trade-off. Other limitations of this study are the relatively small sample size and lack of follow-up spectroscopic and volumetric data. As more data are collected, these measures will be compared longitudinally and correlated with neurocognitive testing to determine their predictive value.
In summary, WBNAA seems to be sensitive enough for detecting the neuronal/axonal injury of mTBI. Greater neuronal injury in the older patients, reflected by larger WBNAA deficits, could perhaps explain their generally worse outcome. MR imaging volumetry, on the other hand, may be useful to monitor subsequent atrophy, which seems to be localized mostly to GM. By quantifying microstructural disruption of WM tracts, diffusion tensor imaging may also yield valuable diagnostic information.53,54 In the future, these techniques may be used to grade TBI severity in patients with similar clinical and mental status and monitor the efficacy of prospective pharmaceuticals designed to slow or even stop the neurodegenerative cascades.9
Footnotes
This work was supported by National Institutes of Health grants EB01015 and NS39135
References
- 1.Collins JG. Types of injuries by selected characteristics: United States. Vital Health Stat 1990;10:175. [PubMed] [Google Scholar]
- 2.Fakhry SM, Trask AL, Waller MA, et al. Management of brain-injured patients by an evidence-based medicine protocol improves outcomes and decreases hospital charges. J Trauma 2004;56:492–99; discussion 499–500 [DOI] [PubMed] [Google Scholar]
- 3.Sorenson S, Kraus J. Occurrence, severity and outcomes of brain injury. J Head Trauma Rehabil 1991;6:1–10 [Google Scholar]
- 4.Kraus JF, McArthur DL, Silberman TA. Epidemiology of mild brain injury. Semin Neurol 1994;14:1–7 [DOI] [PubMed] [Google Scholar]
- 5.Sosin DM, Sacks JJ, Smith SM. Head injury-associated deaths in the United States from1979 to 1986. JAMA 1989;262:2251–55 [PubMed] [Google Scholar]
- 6.Barth JT, Macciocchi SN, Giordani B, et al. Neuropsychological sequelae of minor head injury. Neurosurgery 1983;13:529–33 [DOI] [PubMed] [Google Scholar]
- 7.McAllister TW. Neuropsychiatric sequelae of head injuries. Psychiatr Clin North Am 1992;15:395–413 [PubMed] [Google Scholar]
- 8.Arciniegas DB, Held K, Wagner P. Cognitive impairment following traumatic brain injury. Curr Treat Options Neurol 2002;4:43–57 [DOI] [PubMed] [Google Scholar]
- 9.Gaetz M. The neurophysiology of brain injury. Clin Neurophysiol 2004;115:4–18 [DOI] [PubMed] [Google Scholar]
- 10.Adams JH, Doyle D, Ford I, et al. Diffuse axonal injury in head injury: definition, diagnosis and grading. Histopathology 1989;15:49–59 [DOI] [PubMed] [Google Scholar]
- 11.Hurley RA, McGowan JC, Arfanakis K, et al. Traumatic axonal injury: novel insights into evolution and identification. J Neuropsychiatry Clin Neurosci 2004;16:1–7 [DOI] [PubMed] [Google Scholar]
- 12.Gennarelli TA. Animate models of human head injury. J Neurotrauma 1994;11:357–68 [DOI] [PubMed] [Google Scholar]
- 13.McIntosh TK, Vink R, Noble L, et al. Traumatic brain injury in the rat: characterization of a lateral fluid-percussion model. Neuroscience 1989;28:233–44 [DOI] [PubMed] [Google Scholar]
- 14.Pierce JE, Trojanowski JQ, Graham DI, et al. Immunohistochemical characterization of alterations in the distribution of amyloid precursor proteins and beta-amyloid peptide after experimental brain injury in the rat. J Neurosci 1996;16:1083–90 [DOI] [PMC free article] [PubMed] [Google Scholar]
- 15.Smith DH, Okiyama K, Thomas MJ, et al. Evaluation of memory dysfunction following experimental brain injury using the Morris water maze. J Neurotrauma 1991;8:259–69 [DOI] [PubMed] [Google Scholar]
- 16.Smith DH, Chen XH, Pierce JE, et al. Progressive atrophy and neuron death for one year following brain trauma in the rat. J Neurotrauma 1997;14:715–27 [DOI] [PubMed] [Google Scholar]
- 17.Rink A, Fung KM, Trojanowski JQ, et al. Evidence of apoptotic cell death after experimental traumatic brain injury in the rat. Am J Pathol 1995;147:1575–83 [PMC free article] [PubMed] [Google Scholar]
- 18.Conti AC, Raghupathi R, Trojanowski JQ, et al. Experimental brain injury induces regionally distinct apoptosis during the acute and delayed post-traumatic period. J Neurosci 1998;18:5663–72 [DOI] [PMC free article] [PubMed] [Google Scholar]
- 19.Holmin S, Soderlund J, Biberfeld P, et al. Intracerebral inflammation after human brain contusion. Neurosurgery 1998;42:291–98; discussion 298–299 [DOI] [PubMed] [Google Scholar]
- 20.Sinson G, Bagley LJ, Cecil KM, et al. Magnetization transfer imaging and proton MR spectroscopy in the evaluation of axonal injury: correlation with clinical outcome after traumatic brain injury. AJNR Am J Neuroradiol 2001;22:143–51 [PMC free article] [PubMed] [Google Scholar]
- 21.Ross BD, Ernst T, Kreis R, et al. 1H MRS in acute traumatic brain injury. J Magn Reson Imaging 1998;8:829–40 [DOI] [PubMed] [Google Scholar]
- 22.McGowan JC, Yang JH, Plotkin RC, et al. Magnetization transfer imaging in the detection of injury associated with mild head trauma. AJNR Am J Neuroradiol 2000;21:875–80 [PMC free article] [PubMed] [Google Scholar]
- 23.Cecil KM, Hills EC, Sandel ME, et al. Proton magnetic resonance spectroscopy for detection of axonal injury in the splenium of the corpus callosum of brain-injured patients. J Neurosurg 1998;88:795–801 [DOI] [PubMed] [Google Scholar]
- 24.Simmons ML, Frondoza CG, Coyle JT. Immunocytochemical localization of N-acetyl-aspartate with monoclonal antibodies. Neuroscience 1991;45:37–45 [DOI] [PubMed] [Google Scholar]
- 25.Tsai G, Coyle JT. N-acetylaspartate in neuropsychiatric disorders. Prog Neurobiol 1995;46:531–40 [DOI] [PubMed] [Google Scholar]
- 26.Gonen O, Viswanathan AK, Catalaa I, et al. Total brain N-acetylaspartate concentration in normal, age-grouped females: quantitation with non-echo proton NMR spectroscopy. Magn Reson Med 1998;40:684–89 [DOI] [PubMed] [Google Scholar]
- 27.Gonen O, Catalaa I, Babb JS, et al. Total brain N-acetylaspartate: a new measure of disease load in MS. Neurology 2000;54:15–19 [DOI] [PubMed] [Google Scholar]
- 28.De Santi S, de Leon MJ, Rusinek H, et al. Hippocampal formation glucose metabolism and volume losses in MCI and AD. Neurobiol Aging 2001;22:529–39 [DOI] [PubMed] [Google Scholar]
- 29.Rusinek H, de Leon MJ, George AE, et al. Alzheimer disease: measuring loss of cerebral gray matter with MR imaging. Radiology 1991;178:109–14 [DOI] [PubMed] [Google Scholar]
- 30.Ge Y, Grossman RI, Babb JS, et al. Age-related total gray matter and white matter changes in normal adult brain. Part I: volumetric MR imaging analysis. AJNR Am J Neuroradiol 2002;23:1327–33 [PMC free article] [PubMed] [Google Scholar]
- 31.Susman M, DiRusso SM, Sullivan T, et al. Traumatic brain injury in the elderly: increased mortality and worse functional outcome at discharge despite lower injury severity. J Trauma 2002;53:219–23; discussion 223–214 [DOI] [PubMed] [Google Scholar]
- 32.Mosenthal AC, Lavery RF, Addis M, et al. Isolated traumatic brain injury: age is an independent predictor of mortality and early outcome. J Trauma 2002;52:907–11 [DOI] [PubMed] [Google Scholar]
- 33.Mosenthal AC, Livingston DH, Lavery RF, et al. The effect of age on functional outcome in mild traumatic brain injury: 6-month report of a prospective multicenter trial. J Trauma 2004;56:1042–48 [DOI] [PubMed] [Google Scholar]
- 34.Gentleman SM, Nash MJ, Sweeting CJ, et al. Beta-amyloid precursor protein (beta APP) as a marker for axonal injury after head injury. Neurosci Lett 1993;160:139–44 [DOI] [PubMed] [Google Scholar]
- 35.Bramlett HM, Kraydieh S, Green EJ, et al. Temporal and regional patterns of axonal damage following traumatic brain injury: a beta-amyloid precursor protein immunocytochemical study in rats. J Neuropathol Exp Neurol 1997;56:1132–41 [DOI] [PubMed] [Google Scholar]
- 36.Van Den Heuvel C, Lewis S, Wong M, et al. Diffuse neuronal perikaryon amyloid precursor protein immunoreactivity in a focal head impact model. Acta Neurochir Suppl (Wien) 1998;71:209–11 [DOI] [PubMed] [Google Scholar]
- 37.Blatter DD, Bigler ED, Gale SD, et al. MR-based brain and cerebrospinal fluid measurement after traumatic brain injury: correlation with neuropsychological outcome. AJNR Am J Neuroradiol 1997;18:1–10 [PMC free article] [PubMed] [Google Scholar]
- 38.MacKenzie JD, Siddiqi F, Babb JS, et al. Brain atrophy in mild or moderate traumatic brain injury: a longitudinal quantitative analysis. AJNR Am J Neuroradiol 2002;23:1509–15 [PMC free article] [PubMed] [Google Scholar]
- 39.Wang Y, Li SJ. Differentiation of metabolic concentrations between gray matter and white matter of human brain by in vivo 1H magnetic resonance spectroscopy. Magn Reson Med 1998;39:28–33 [DOI] [PubMed] [Google Scholar]
- 40.Hardman JM, Manoukian A. Pathology of head trauma. Neuroimaging Clin N Am 2002;12:175–87 [DOI] [PubMed] [Google Scholar]
- 41.Singleton RH, Zhu J, Stone JR, et al. Traumatically induced axotomy adjacent to the soma does not result in acute neuronal death. J Neurosci 2002;22:791–802 [DOI] [PMC free article] [PubMed] [Google Scholar]
- 42.Maxwell WL, Islam MN, Graham DI, et al. A qualitative and quantitative analysis of the response of the retinal ganglion cell soma after stretch injury to the adult guinea-pig optic nerve. J Neurocytol 1994;23:379–92 [DOI] [PubMed] [Google Scholar]
- 43.Bigler ED, Blatter DD, Anderson CV, et al. Hippocampal volume in normal aging and traumatic brain injury. AJNR Am J Neuroradiol 1997;18:11–23 [PMC free article] [PubMed] [Google Scholar]
- 44.Anderson CV, Wood DM, Bigler ED, et al. Lesion volume, injury severity, and thalamic integrity following head injury. J Neurotrauma 1996;13:35–40 [DOI] [PubMed] [Google Scholar]
- 45.Gale SD, Burr RB, Bigler ED, et al. Fornix degeneration and memory in traumatic brain injury. Brain Res Bull 1993;32:345–49 [DOI] [PubMed] [Google Scholar]
- 46.Anderson CV, Bigler ED. The role of caudate nucleus and corpus callosum atrophy in trauma-induced anterior horn dilation. Brain Inj 1994;8:565–69 [DOI] [PubMed] [Google Scholar]
- 47.Yount R, Raschke KA, Biru M, et al. Traumatic brain injury and atrophy of the cingulate gyrus. J Neuropsychiatry Clin Neurosci 2002;14:416–23 [DOI] [PubMed] [Google Scholar]
- 48.Ariza M, Junque C, Mataro M, et al. Neuropsychological correlates of basal ganglia and medial temporal lobe NAA/Cho reductions in traumatic brain injury. Arch Neurol 2004;61:541–44 [DOI] [PubMed] [Google Scholar]
- 49.Uzan M, Albayram S, Dashti SG, et al. Thalamic proton magnetic resonance spectroscopy in vegetative state induced by traumatic brain injury. J Neurol Neurosurg Psychiatry 2003;74:33–38 [DOI] [PMC free article] [PubMed] [Google Scholar]
- 50.Bazarian JJ, McClung J, Shah MN, et al. Mild traumatic brain injury in the United States, 1998–2000. Brain Inj 2005;19:85–91 [DOI] [PubMed] [Google Scholar]
- 51.Rapoport MJ, McCullagh S, Streiner D, et al. The clinical significance of major depression following mild traumatic brain injury. Psychosomatics 2003;44:31–37 [DOI] [PubMed] [Google Scholar]
- 52.Levin HS, Brown SA, Song JX, et al. Depression and posttraumatic stress disorder at three months after mild to moderate traumatic brain injury. J Clin Exp Neuropsychol 2001;23:754–69 [DOI] [PubMed] [Google Scholar]
- 53.Huisman TA, Schwamm LH, Schaefer PW, et al. Diffusion tensor imaging as potential biomarker of white matter injury in diffuse axonal injury. AJNR Am J Neuroradiol 2004;25:370–76 [PMC free article] [PubMed] [Google Scholar]
- 54.Arfanakis K, Haughton VM, Carew JD, et al. Diffusion tensor MR imaging in diffuse axonal injury. AJNR Am J Neuroradiol 2002;23:794–802 [PMC free article] [PubMed] [Google Scholar]