

Abstract
BACKGROUND AND PURPOSE: Impaired cortical venous outflow and abnormal deep venous collaterals are common in Sturge-Weber syndrome (SWS), but their relation to brain metabolism and function is poorly understood. In this study, advanced MR imaging techniques, such as susceptibility-weighted imaging (SWI) and diffusion tensor imaging (DTI), were applied in conjunction with positron-emission tomography (PET), to assess cortical and white matter structural abnormalities and their relation to cortical glucose metabolism and cognitive functions in children with unilateral SWS.
MATERIALS AND METHODS: Thirteen children (age, 1.5–10.3 years) with unilateral SWS underwent MR imaging with SWI and DTI, glucose metabolism PET, and comprehensive neuropsychologic assessment prospectively. The MR imaging and PET images were coregistered and cortical regions showing decreased glucose metabolism were compared with locations of SWI signal intensity abnormalities, changes in white matter water diffusion, and cognitive functions.
RESULTS: SWI detected both cortical abnormalities (n = 8) and deep transmedullary veins (n = 9), including those in young children with no cortical SWI signal intensity changes. These veins were often located under cortex adjacent to hypometabolic regions. DTI showed abnormal water diffusion both under hypometabolic cortex and in adjacent white matter with collateral veins. Cognitive dysfunction was associated with abnormal water diffusion in the posterior white matter.
CONCLUSIONS: Transmedullary venous collaterals can be detected early by SWI and persist in white matter adjacent to damaged cortex in children with SWS. Microstructural white matter damage extends beyond cortical abnormalities and may contribute to cognitive impairment. SWI and DTI can be incorporated into clinical MR imaging acquisitions to objectively assess microstructural abnormalities at different stages of SWS.
Sturge-Weber syndrome (SWS) is a neurocutaneous disorder characterized by facial port wine stain, glaucoma, and pial angiomatosis involving one cerebral hemisphere in 85% of the cases.1 The anomalous venous plexus over the cerebral surface leads to abnormal cortical drainage and venous stasis. Neurologic symptoms include seizures, visual field defect, and hemiparesis, depending on the location and size of the leptomeningeal angioma, which can be detected by contrast-enhanced MR imaging. In addition, abnormal deep veins are also often visualized.2,3 These are thought to provide collateral drainage for venous blood toward the deep cerebral venous system and can become increasingly prominent as surface veins occlude progressively.4 However, it remains unclear whether this collateral venous system provides sufficient drainage to support normal function in the overlying or adjacent cortex. Functional neuroimaging with fluorodeoxyglucose–positron-emission tomography (FDG-PET) often demonstrates cortical hypometabolism extending beyond the apparent structural abnormalities in SWS.5,6 However, the relation between cortical hypometabolism and collateral venous circulation in SWS is not known. One puzzling observation is that children with unilateral SWS may show profound cognitive impairment despite relatively limited unilateral cortical involvement.6 This suggests that additional structural and/or functional cerebral abnormalities, perhaps involving white matter, may also contribute to cognitive decline in children with SWS. Early white matter involvement has been also demonstrated by reports of accelerated myelination in the affected hemisphere.7,8
New MR imaging techniques allow assessment of microstructural brain abnormalities that cannot be appreciated on conventional MR imaging. Susceptibility-weighted imaging (SWI), which is exquisitely sensitive to the venous vasculature by detecting deoxygenated blood in small veins without administration of a contrast medium,9–12 can detect fine deep venous abnormalities in children with SWS, even if conventional MR imaging shows no definite structural changes.13 In addition, SWI is sensitive to cerebral calcium and iron deposits,12 which may contribute to neuropsychologic complications in children with SWS. Another emerging MR imaging technique, diffusion tensor imaging (DTI), allows quantitative assessment of white matter structural integrity.14–16 White matter shows abnormalities early in the course of SWS on conventional MR imaging, and abnormal water diffusivity in the white matter underlying the angioma was reported in an adult with unilateral SWS.17 However, it is not clear whether DTI can detect early microstructural changes in children affected by SWS and whether such abnormalities are related to neurocognitive functions.
In the present study, we combined SWI and DTI with FDG-PET to assess structural-functional relationships in cortex and white matter in a prospectively recruited group of children with unilateral SWS. We were particularly interested in detection of deep collateral veins by SWI and their relation to structural and functional abnormalities in white matter and cortex. We also evaluated whether microstructural abnormalities in white matter, as assessed by DTI, are related to cognitive functions in these children.
Subjects and Methods
Patients
Thirteen children (7 girls; age, 1.5–10.3 years; mean age, 5.5 years; Table 1) with the diagnosis of SWS were recruited prospectively using the following inclusion criteria: 1) SWS characterized by a facial port wine stain and unilateral brain involvement, including (but not necessarily confined to) the posterior brain regions; 2) age 6 months to 12 years at the time of enrollment. Eleven of the 13 children had a history of seizures, and 10 patients were on antiepileptic drug(s). Eight patients had undergone CT scanning in the past, and 7 of these showed intracerebral calcifications (Table 2). As part of the present study, all patients underwent brain MR imaging and an FDG-PET scan performed on consecutive days. All imaging and clinical studies were performed in compliance with the regulations of Wayne State University Human Investigation Committee, and written informed consent of the parent or legal guardian was obtained.
Table 1:
Clinical data of the 13 patients
| Patient | Gender | Age at Onset (years) | Age at Epilepsy (years) | Seizure Frequency | Drug | IQ |
|---|---|---|---|---|---|---|
| 1 | F | 1.5 | 1.1 | 1/month | OXC, VPA, PHB | 86 |
| 2 | M | 1.9 | 0.5 | Free for 1 year | CBZ | 70 |
| 3 | F | 2.5 | No epilepsy | Aspirin | 102 | |
| 4 | F | 2.8 | 1.5 | Free for 8 months | LEV | 76 |
| 5 | F | 8.9 | 0.6 | Free for 8 years | None | 82 |
| 6 | M | 10.3 | No epilepsy | None | 69 | |
| 7 | M | 2.7 | 0.2 | 2/day | OXC | 60 |
| 8 | M | 4.3 | 0.4 | A few per year | OXC | 71 |
| 9 | F | 6.0 | 0.3 | A few per year | OXC | 60 |
| 10 | M | 6.0 | 0.5 | 10–30/day | LEV, VPA | 35 |
| 11 | M | 6.3 | 0.8 | Free for 2 years | CBZ, LEV | 55 |
| 12 | F | 8.1 | 0.3 | Free for 3 years | CBZ | 87 |
| 13 | F | 9.5 | 0.7 | A few per year | CBZ | 60 |
Note:—F indicates female; M, male; OXC, oxcarbamazepine; VPA, valproate; PHB, phenobarbital; LEV, levetiracetam; CBZ, carbamazepine.
Table 2:
Imaging findings of the 13 patients, showing locations of conventional MR imaging, SWI (cortex and white matter), and PET abnormalities; for FDG-PET, areas with severe (>20% decrease) and mild (10–20% decrease) hypometabolism are indicated
| Patient | Past CT Scan | Conventional MRI | SWI Abnormality |
FDG-PET Hypometabolism |
||
|---|---|---|---|---|---|---|
| Cortex | White Matter | Severe | Mild | |||
| 1 | NA | L P angioma (small) | L F-P | L P | ||
| 2 | R calc | R P angioma (small), plexus | R P, F | R O | ||
| 3 | L P calc (very small) | L sP angioma (small) | ||||
| 4 | Normal (age 1.5 years) | R P angioma R pP atrophy | R F-P | R P | R T | |
| 5 | NA | L p plexus L T angioma | L T | L TO, iF | ||
| 6 | NA | R P, pT angioma, atrophy, R p plexus | R T | R P, pT | R T | |
| 7 | NA | R F, P, pT-O angioma R hemisphere atrophy R p plexus | R F-P, pT-O L iF | [R F*] | R sT, sO R P-F | R O |
| 8 | L hem calc | L hemisphere angioma L p plexus | L P-O, F, T | [L F*] | L T-P-O, iF | L sF |
| 9 | NA | L P angioma, plexus | L P, T | L F, cerebellum | L P-T-O | L F |
| 10 | L P calc | L P, pT, iF angioma | L P-T-O, F | L F | L P-T-O | L F |
| 11 | R P calc | R sP, mT angioma | R sP-F, mT R mO | R aT | R pT-O R sP | |
| 12 | L hem calc | L P-T-O, F angioma L posterior plexus | L P-T, m-i F | L F | L T-P-O | L T-P-O |
| 13 | R F-P calc (age 8 months) | R F-P angioma R F, T, P atrophy | P p-i F | R F-P R med T | R T-P-O, F | R F R T-P-O |
Note:—SWI, susceptibility-weighted imaging; FDG, fluorodeoxyglucose; L, left; R, right; T, temporal; F, frontal; P, parietal; O, occipital; i, inferior; p, posterior; a, anterior; s, superior; m, middle; med, medial; WM, white matter; adj, adjacent; calc, calcification, NA, not available; hem, hemisphere.
Only short streaks in the centrum semiovale.
Assessment of Cognitive Functions
All children received a comprehensive neuropsychologic assessment within 1 day of the imaging studies, administered by a pediatric neuropsychologist. Neuropsychologic testing was performed in the morning, before sedation for imaging. Intellectual function was assessed using age-appropriate tests, including the Bayley Scales of Infant Development (BSID, age 18–36 months),18 Wechsler Preschool and Primary Scales of Intelligence, Third Edition (WPPSI-3; age 3–6 years), and the Wechsler Intelligence Scales for Children, Third Edition (WISC-III; >6 years of age).19 Global intellectual functioning (IQ) was characterized by the Mental Development Index (BSID) or full scale IQ (WPPSI-3 and/or WISC-III). Both of these scales are standardized with a theoretic mean of 100 and a standard deviation of 15.
MR Imaging Data Acquisition and Processing
All MR studies were carried out on a Sonata 1.5T MR instrument (Siemens, Erlangen, Germany) using a standard head coil. During the scanning phase of both MR imaging and PET studies, children younger than 7 years of age were sedated with pentobarbital (3 mg/kg) followed by fentanyl (1 μg/kg). The protocol included an axial 3D gradient-echo T1-weighted (TR, 20 ms; TE, 5.6 ms; flip angle: 25°; voxel size, 1 × 0.5 × 2 mm3), axial T2-weighted turbo spin-echo (TR, 5020 ms; TE, 106 ms; voxel size, 1 × 1 × 6 mm3), DTI, SWI, followed by a postgadolinium (0.1 mmol/kg) T1-weighted (see parameters above) acquisition. Turbo SWI acquisition was performed with a 3D fully balanced gradient-echo sequence with flip angle = 20°; TR, 89 ms; TE, 40 ms; echo-planar imaging factor, 5; acquisition matrix, 512 × 256 × 48; FOV, 256 × 256 × 96 mm3; bandwidth, 160 Hz/pixel. First-order flow compensation was applied in all 3 orthogonal directions. Both magnitude and phase images were saved. DTI acquisition was performed using single-shot, diffusion-weighted, echo-planar imaging. The acquisition parameters included: TR, 6600; TE, 97 ms; NEX, 8; acquisition matrix, 128 × 128; bandwidth, 95 KHz; FOV, 230 × 230 × 3 mm3, with 2 b values (0, 1000 s/mm2) applied sequentially in 6 noncollinear directions. The image datasets were transferred from the scanner to a PC workstation for postprocessing. The postprocessing of SWI images using custom software has been described previously in detail.9,12
PET Data Acquisition
The details of FDG-PET acquisition and data analysis have been described elsewhere.6 In brief, PET data were acquired using an EXACT HR PET scanner (CTI/Siemens, Hoffman Estates, Ill) that allows simultaneous acquisition of 47 contiguous transaxial images with a section thickness of 3.125 mm. The reconstructed image resolution obtained was 5.5 ± 0.35 mm at full width at half-maximum in-plane and 6.0 ± 0.49 mm full width at half-maximum in the axial direction (reconstruction parameters: Hanning filter with 1.20 cycles/cm cutoff frequency). Scalp electrodes were placed in all children according to the International 10–20 system to monitor EEG activity during the tracer uptake period. Initially, venous access was established for injection of FDG (5.3 MBq/kg). Forty minutes after injection, a static 20-minute emission scan in 2D-mode was initiated collecting approximately 1 million net true counts per plane. Calculated attenuation correction was performed on all images using the ECAT 7.2 reconstruction software (CTI-Siemens, Knoxville, Tenn.). The outline of the head was derived directly from the raw data by threshold fits to the sinograms according to the method of Bergstroem et al.20
Image Analysis
SWI.
Two major types of SWI abnormalities were identified: 1) cortical magnetic susceptibility effects (signal intensity loss) assessed on the SWI magnitude images, where they were better visualized, and 2) white matter abnormalities corresponding to transmedullary and deep venous structures, not seen in the opposite hemisphere. These abnormalities were visualized and assessed on both magnitude and phase images.
DTI.
DTI data processing and analysis was performed as described previously.21 Fractional anisotropy (FA; characterizing the degree of directionality of the diffusional motion) and apparent diffusion coefficient (ADC; a measure of the average magnitude of diffusional motion in water molecules) maps were created, and a region of interest (ROI) analysis was performed using the DTI-Studio software (http://lbam.med.jhmi.edu/DTIuser/DTIuser.asp). ROIs were placed in 3 different white matter regions, based on the abnormalities identified on coregistered SWI/PET image datasets (see further details in the Results section). All ROIs were manually placed on DTI color maps to ensure that the ROIs were confined to white matter tracts displayed according to the direction of the tracts. The ROI size ranged from 2 to 4 cm2 in 3 consecutive axial planes, depending on the size of the brain and the extent of overlying cortical abnormalities (if present). ROIs with a similar size from contralateral homotopic white matter regions were also obtained, and all ROIs were then superimposed on FA and ADC maps to calculate FA and ADC values for each region. Subsequently, an ipsilateral/contralateral (to the angioma) ratio was created from each set of FA and ADC values. These ratios, instead of absolute values, were used to characterize abnormal FA and ADC in the white matter of the affected hemisphere, because the ratios, unlike absolute values, are largely independent of developmental changes of water diffusion described previously.22–24
FDG-PET.
All PET images were evaluated first visually by 2 of the authors, to make sure that there were no bilateral metabolic abnormalities or increased cortical metabolism present, both of which could confound the subsequent objective analysis of focal hypometabolic cortical areas. In the next step, cortical areas with abnormally decreased FDG uptake on the side of the angioma were objectively defined using an in-house software package.25 This program allows definition of abnormal cortical areas of glucose metabolism based on an asymmetry index derived from contralateral homotopic cortical sectors (with 60 sectors in each hemisphere and image plane) according to a predefined cutoff threshold. This approach is advantageous in the objective analysis of pediatric PET scans because it eliminates the confounding effect of absolute glucose metabolic rates, which show profound dynamic changes during brain development.26 Our previous studies indicated that cortical areas with more than 10% asymmetry (ie, 2 SDs above normal mean asymmetry), occurring in at least 2 adjacent planes, often encompass epileptogenic regions (although typically extending beyond the seizure onset zone) in children with intractable epilepsy.27,28 It has been shown also that cortical areas with severe (>20%) asymmetry are likely to be atrophic as visualized on conventional MR imaging.6 Therefore, hypometabolic cortex was identified at thresholds of 10%–20% (mild hypometabolism) and >20% (severe hypometabolism) decrease on each PET scan. Finally, MR imagings, of each patient were co-registered to the PET image volumes in Analyze format obtained from the same patient, using SPM2 (Wellcome Department of Imaging Neuroscience, Institute of Neurology, London, UK), operating in Matlab (MathWorks, Natick, Mass). As a result, MR imaging/PET fusion images were created to directly compare the location and extent of areas with abnormal MR imaging (SWI) and cortical glucose metabolic abnormalities as marked on PET.
Results
Conventional MR Imaging and FDG-PET.
Conventional MR imaging showed structural abnormalities consistent with unilateral SWS, including focal cerebral atrophy, leptomeningeal angioma and/or venous plexus on the side of the port wine stain, and gadolinium enhancement of some deep venous structures (Table 2). FDG-PET showed cortical hypometabolism in 12 of 13 patients. In 3 patients (numbers 1, 2, 5), only mild (10%–20% decrease) hypometabolism was found, whereas in the other 9 patients, cortical areas with both severe (>20% decrease) and mild hypometabolism were marked (Table 2).
SWI Abnormalities.
SWI showed signal intensity abnormalities in all but one patient (patient 3, with a very small parietal angioma). Cortical signal intensity loss on magnitude images (seen in patients 7–13, Table 2) occurred typically in a gyriform pattern (Figs 1 and 2) or, in some cases, an area of signal intensity loss was located at the border of the gray and white matter (Fig 1).
Fig 1.

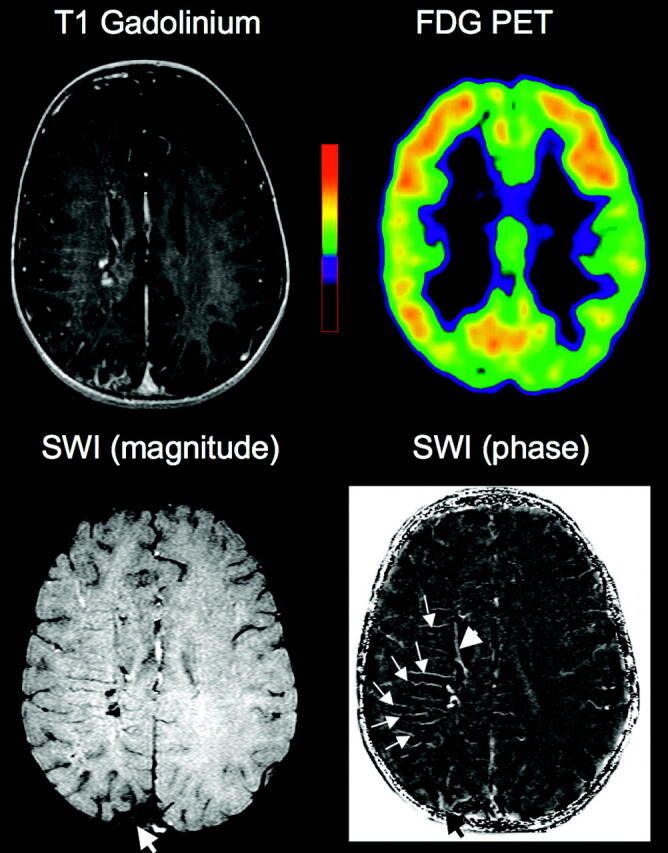
Images of a 8.1-year-old girl (patient 12) with Sturge-Weber syndrome affecting the left hemisphere. Postgadolinium T1-weighted MR images show an extensive left hemispheric angioma. SWI shows gyriform cortical signal intensity abnormalities in the left posterior region (arrowheads). A separate area of abnormal SWI is also seen in the left frontal region, located at the gray/white matter junction (thick arrows). Severe hypometabolism on PET is confined to the posterior region, matching well with the cortical SWI changes. In addition to cortical MR imaging abnormalities, abnormal transmedullary deep veins in white matter and periventricular veins are seen on both gadolinium-enhanced T1 and SWI images (thin arrows).
Fig 2.

Co-registered SWI and PET images of a 6-year-old girl (patient 9) with Sturge-Weber syndrome affecting the left hemisphere. SWI shows gyriform cortical signal intensity abnormalities in the left posterior region in atrophic cortex with severe (>20% decrease) hypometabolism on PET. In front of this area, deep veins are seen in the white matter, connecting mildly hypometabolic (10%–20% decrease) cortex to deep, periventricular veins.
Abnormalities in the white matter were apparent in 11 patients (85%), including 5 of the 6 children who showed no cortical SWI abnormalities (Table 2, Figs 3 and 4). The configuration of these white matter abnormalities was consistent with transmedullary veins connecting the cerebral cortex to periventricular veins in 9 cases, most frequently located in the frontal-central white matter (Figs 3 and 4), but seen in the temporal lobe white matter in 2 patients (5 and 6). Although some of these veins were seen on gadolinium-enhanced T1-weighted images, these venous abnormalities were visualized in finer detail on SWI images, particularly on the phase images (Fig 3), because of a better contrast between white matter and the vascular structures. In patients with both cortical and white matter SWI signal intensity abnormalities, the cortical area reached by the transmedullary veins was adjacent to cortex with SWI signal intensity changes (and concomitant hypometabolism, see below). In 2 patients (7 and 8) with widespread hemispheric MR imaging and FDG-PET abnormalities, only short streaks of SWI signal intensity loss were seen in the central subcortical white matter, not reaching the deep white matter regions. No gadolinium enhancement was seen in these regions on postcontrast T1 images.
Fig 3.
Co-registered MR imaging and PET images of a 1.9-year-old boy (patient 2) with Sturge-Weber syndrome and right hemispheric involvement. Contrast-enhanced T1-weighted MR images show a small posterior angioma as well as subtle enhancement in some transmedullary veins. FDG-PET shows no hypometabolism in the right hemisphere. In contrast, SWI demonstrates a number of prominent transmedullary veins in the right frontoparietal region (arrows on phase image); these are joining to a deep periventricular vein (arrowhead). These venous abnormalities are well visualized on the SWI phase images. Magnetic susceptibility effects are also seen in the region of the posterior angioma overlying atrophic right parietal cortex (thick arrow).
Fig 4.

T1-weighted and SWI MR imaging fused with PET images of a 2.8 year-old girl (patient 4) with Sturge-Weber syndrome affecting the right hemisphere. T1-weighted images show focal posterior parietal atrophy with leptomeningeal gadolinium enhancement and subtle enhancement in the white matter, consistent with transmedullary veins. The same deep veins are well visualized on SWI (thick arrows), apparently connected to enlarged periventricular veins (thin arrows on the enlarged fused SWI/PET image). FDG-PET shows severe hypometabolism in the area of focal atrophy, while the transmedullary veins reach adjacent cortical regions with mild or no hypometabolism. The SWI/PET fusion image shows well the configuration of multiple draining veins (arrows) originating from the edge of the hypometabolic area.
Metabolic Correlates of SWI Abnormalities.
FDG-PET in all 7 patients (7–13) with cortical SWI signal intensity changes showed areas of severe cortical hypometabolism, involving cortex with abnormal signal intensity on SWI (Table 2 and Figs 1 and 2). In contrast, abnormal transmedullary veins visualized by SWI were located under cortex directly adjacent to severe or mild hypometabolic regions (Figs 1, 2, and 4). No severe (>20% decrease) hypometabolism was objectively identified in the 3 youngest patients (1–3) and patient 5, despite deep veins visualized on SWI in 3 of them (Fig 3). In addition, SWI abnormalities (either in cortex or in white matter) were seen in areas with normal glucose metabolism in 6 other patients (6, 7, 9–12), involving frontal regions in 5 (Table 2). On the other hand, cortical glucose hypometabolism extended beyond the region of SWI abnormalities in 6 patients (2, 4, 5, 7, 11, 13).
DTI Abnormalities and Cognitive Functions in the White Matter.
DTI analysis was not performed in 1 patient (6) because of poor quality of the acquired images. In the remaining 12 children, FA and ADC were measured in 3 different regions1: in the posterior (parietal/occipital) white matter, abnormal on MR imaging and/or PET (n = 11; no PET abnormality was seen in patient 3);2 in adjacent regions showing transmedullary veins on SWI (n = 8; no such veins were seen in patients 3, 7, 8 and 11); these regions were located under mildly hypometabolic cortex or directly adjacent to hypometabolic cortex3; and in control white matter regions normal on SWI and with normal metabolism in overlying cortex (n = 9; no such regions could be identified in the 3 patients [7, 8, and 10] with extensive hemispheric involvement); these control regions were placed in frontal (n = 6) and temporal lobe (n = 3) white matter.
Posterior white matter showed the highest mean DTI asymmetries (ipsilateral/contralateral: FA = 0.76 ± 0.10, ADC = 1.11 ± 0.07), indicating decreased FA and increased ADC in the affected hemisphere. Adjacent regions of deep transmedullary veins showed only slightly less asymmetries (ipsilateral/contralateral: FA = 0.84 ± 0.06, ADC = 1.09 ± 0.05). Water diffusion was symmetric in the control regions (ipsilateral/contralateral: FA = 1.0 ± 0.02, ADC = 1.02 ± 0.02) (Fig 5). In the 7 patients where DTI values were available for all 3 regions, FA was lower both under the hypometabolic posterior region (0.77 ± 0.09; P < .001; repeated measures ANOVA) and in adjacent regions with deep veins (0.83 ± 0.05; P = .001) than in normal regions (1.0 ± 0.02). Similar differences were found in ADC values (posterior region, 1.09 ± 0.03, P = .002; adjacent, 1.09 ± 0.05, P = .01; control region, 1.0 ± 0.02).
Fig 5.

Representative DTI fractional anisotropy (FA) and color vector map images of patient 9 with a left parietal angioma. FDG-PET showed severe hypometabolism in the parietal lobe (Fig 2), whereas SWI visualized deep frontocentral transmedullary veins (see affected area in the SWI panel on the right) apparently draining from mildly hypometabolic cortex. FA map demonstrates decreased FA values extending into the frontal lobe. On the color map, fiber directions are color-coded based on the main eigenvector (red, left-right, green, anteroposterior, blue, superior-inferior). Note that in the central white matter region encompassing the deep veins, red and dark purple-coded voxels dominate, indicating an increased number of voxels with transverse (left-right) as well as oblique direction of water diffusion as opposed to the right (normal) side containing more fibers with superior-inferior direction. Both FA and color maps show severe loss and disorganization of white matter in the left parietal area under the angioma (arrows).
IQ showed a positive correlation with FA asymmetry values measured in the parieto-occipital white matter (r = 0.69, P = .013; Pearson's correlation), and a negative correlation with ADC values of the same regions (r = −0.60, P = .050), indicating lower FA and higher ADC values in children with lower IQ.
Discussion
In this study of children with unilateral SWS, SWI demonstrates fine details of transmedullary veins, which are typically located adjacent to functionally abnormal cortex as assessed by PET. These veins are present in some of the youngest patients with SWS, who had not yet developed cortical hypometabolism. Despite normal cortical metabolism in overlying cortex, white matter encompassing abnormal veins shows abnormal water diffusion on DTI, suggesting impaired structural integrity of the white matter tracts passing though these regions. Together, these findings indicate that although collateral venous drainage via penetrating transmedullary veins may be adequate for normal or close to normal metabolism adjacent to severely damaged brain regions, the structural integrity of white matter encompassing these veins is compromised. Abnormal white matter integrity may contribute to cognitive impairment of children with SWS.
Deep Venous Collaterals in SWS
The location of medullary veins in relation to cortical hypometabolism provides new insights in the significance of venous collaterals in SWS. Under normal circumstances, the cerebral cortex and underlying layer of white matter are drained by superficial veins,29 whereas venous outflow from the periventricular white matter takes place via a deep venous system served by the great vein of Galen and the basal veins.30 The ventricular group of the deep veins converges on the walls of the lateral ventricles.30 The superficial and deep venous systems are connected by anastomotic veins running through the centrum semiovale. In normal brain the significance of these anastomoses is marginal; thus, a venous watershed exists between the deep and superficial venous systems.31–33 In SWS, these medullary veins are often enlarged and thought to be draining venous blood into the deep (galenic) venous system from cortex with insufficient superficial venous drainage. The presence of such transmedullary collaterals in SWS has been demonstrated by various imaging modalities in the past.2,3,34 MR imaging with SWI provides fine anatomic details of these collateral veins, including small veins that cannot be visualized by MR venography and that are often quite subtle even on gadolinium-enhanced MR imaging (Fig 3). SWI consistently showed that such transmedullary veins reached cortical regions with no major structural or functional abnormalities, located at the border or directly adjacent to cortex showing low intensity on SWI and hypometabolism on PET. In patients with neocortical epilepsy, such metabolic borderzones have been shown to be particularly epileptogenic.35 Seizures in these border zones can lead to increased energy demand, causing hypoxia in the affected gray and white matter. Therefore, such regions in SWS can likewise be vulnerable to pathologic deterioration during the course of the disease.
Deep medullary veins were visualized in some patients with no cortical SWI signal intensity changes, including 2 children with no or minimal hypometabolism on FDG. This suggests that collateral drainage via medullary veins develops early and, in some cases, may remain sufficient for an extended period, thus preventing damage (as evidenced by hypometabolism) in the affected cortex. As the brain grows and its energy demand increases during the first years of life, these draining routes may become insufficient, leading to metabolic changes in the affected gray and white matter structures. In 2 children with extensive hemispheric MR imaging and PET abnormalities (patients 7 and 8), no draining veins could be visualized, except for some short streaky abnormalities in the subcortical white matter, perhaps representing remnants of occluded deep veins.
White Matter Damage and Cognitive Functions
Unilateral brain lesions acquired early in life are associated with impaired cognitive functions, even if the lesion is not progressive in nature. The impact of early brain damage depends on the time of acquisition: in general, extent of lesions correlates better with IQ and language impairment in children who acquired lesions later.36–40 In SWS, unilateral brain damage starts at an early, though poorly defined, age; however, unlike many other lesions, the underlying process is often progressive in SWS. The observed cognitive deficit may be more severe than expected from the relatively limited extent of cortical involvement seen on conventional MR imaging studies. Presence of uncontrolled seizures and their nociferous effect on cortical functions may account for some of the discrepancy between MR imaging and cognitive findings.6 The present study suggests that white matter damage may contribute to the cognitive impairment. Abnormalities in water diffusion were almost as severe in white matter regions with deep veins adjacent to hypometabolic cortex, as in regions underlying cortical hypometabolism. The colocalization of these diffusion changes with deep venous abnormalities on SWI suggests that these collaterals may somehow interfere with normal white matter development. Whether this is a direct mechanical effect of enlarged venous structures passing through fiber tracts or is due to impaired venous outflow and hypoxia, or other mechanisms, remains unclear. Nevertheless, intact white matter integrity is important for optimal information processing and cognitive functions. Recent DTI studies demonstrated a correlation between centrum semiovale diffusion variables and cognitive function in elderly subjects.41–43 Our present study shows that DTI can identify clinically relevant microstructural changes in children with SWS and probably also in other conditions affecting the structural integrity of the white matter.
Cortical SWI Changes
In addition to venous abnormalities, SWI detected cortical changes that were not visualized or poorly visualized on conventional MR imaging. Cortical pathology in SWS includes gliosis, atrophy, and cerebral perivascular calcifications.44,45 SWI magnitude images show areas of signal intensity loss often in a gyriform pattern, mostly localized to severely hypometabolic cortical regions shown by PET. The configuration of these gyriform susceptibility changes closely resembles gyriform calcification. Calcium is diamagnetic and deposits of significant amounts of calcium can lead to measurable susceptibility changes in the brain.12,46 Cerebral calcium deposits have been visualized by SWI in Fahr disease.47 In addition, abnormal SWI signals in hypometabolic cortex may be due to iron deposits from hemoglobin breakdown products as a result of chronic congestion or microhemorrhages.12 Regardless of the nature of cortical susceptibility changes, cortical SWI signal intensity changes seem to be an excellent indicator of severely hypometabolic cortex in SWS.
Conclusion
SWI and DTI can detect microstructural changes in cortex and white matter in children with SWS. Deep venous collaterals can be detected by SWI and they are often located directly adjacent to severely damaged cortical regions (as suggested by both MR imaging and PET). Diffusion abnormalities in white matter extend beyond cortical involvement, encompassing white matter with venous collaterals, and degree of diffusion changes correlates with cognitive deficits. SWI and DTI can be easily incorporated into clinical MR imaging acquisitions and may be useful to objectively assess microstructural abnormalities at an early stage of SWS when interventions have the best chance to prevent irreversible neurocognitive sequelae.
Footnotes
Supported by grants NS041922 from the National Institutes of Health (to C.J.) and 085P5200251 from the Michigan Technology Tri-Corridor (to E.M.H.).
References
- 1.Roach ES, Bodensteiner JB. Neurologic manifestations of Sturge-Weber syndrome. In: Bodensteiner JB, Roach ES, eds. Sturge-Weber Syndrome. Mt Freedom, NJ: The Sturge-Weber Foundation;1999. :27–38
- 2.Benedikt RA, Brown DC, Walker R, et al. Sturge-Weber syndrome: cranial MR imaging with Gd-DTPA. AJNR Am J Neuroradiol 1993;14:409–15 [PMC free article] [PubMed] [Google Scholar]
- 3.Vogl TJ, Stemmler J, Bergman C, et al. MR and MR angiography of Sturge-Weber syndrome. AJNR Am J Neuroradiol 1993;14:417–25 [PMC free article] [PubMed] [Google Scholar]
- 4.Cure JK, Holden KR, Van Tassel P. Progressive venous occlusion in a neonate with Sturge-Weber syndrome: demonstration with MR venography. AJNR Am J Neuroradiol 1995;16:1539–42 [PMC free article] [PubMed] [Google Scholar]
- 5.Chugani HT, Mazziotta JC, Phelps ME. Sturge-Weber syndrome: a study of cerebral glucose utilization with positron emission tomography. J Pediatr 1989;114:244–53 [DOI] [PubMed] [Google Scholar]
- 6.Lee JS, Asano E, Muzik O, et al. Sturge-Weber syndrome: correlation between clinical course and FDG PET findings. Neurology 2001;57:189–95 [DOI] [PubMed] [Google Scholar]
- 7.Jacoby CG, Yuh WT, Afifi AK, et al. Accelerated myelination in early Sturge-Weber syndrome demonstrated by MR imaging. J Comput Assist Tomogr 1987;11:226–31 [DOI] [PubMed] [Google Scholar]
- 8.Adamsbaum C, Pinton F, Rolland Y, et al. Accelerated myelination in early Sturge-Weber syndrome: MRI-SPECT correlations. Pediatr Radiol 1996;26:759–62 [DOI] [PubMed] [Google Scholar]
- 9.Reichenbach JR, Venkatesan R, Schillinger DJ, et al. Small vessels in the human brain: MR venography with deoxyhemoglobin as an intrinsic contrast agent. Radiology 1997;204:272–77 [DOI] [PubMed] [Google Scholar]
- 10.Reichenbach JR, Haacke EM. High-resolution BOLD venographic imaging: a window into brain function. NMR Biomed 2001;14:453–67 [DOI] [PubMed] [Google Scholar]
- 11.Reichenbach JR, Jonetz-Mentzel L, Fitzek C, et al. High-resolution blood oxygen-level dependent MR venography (HRBV): a new technique. Neuroradiology 2001;43:364–69 [DOI] [PubMed] [Google Scholar]
- 12.Sehgal V, Delproposto Z, Haacke EM, et al. Clinical applications of neuroimaging with susceptibility-weighted imaging. J Magn Reson Imaging 2005;22:439–50 [DOI] [PubMed] [Google Scholar]
- 13.Mentzel HJ, Dieckmann A, Fitzek C, et al. Early diagnosis of cerebral involvement in Sturge-Weber syndrome using high-resolution BOLD MR venography. Pediatr Radiol 2005;35:85–90 [DOI] [PubMed] [Google Scholar]
- 14.Pierpaoli C, Jezzard P, Basser PJ, et al. Diffusion tensor MR imaging of the human brain. Radiology 1996;201:637–48 [DOI] [PubMed] [Google Scholar]
- 15.Le Bihan D, Mangin JF, Poupon C, et al. Diffusion tensor imaging: concepts and applications. J Magn Reson Imag 2001;13:534–46 [DOI] [PubMed] [Google Scholar]
- 16.Sundgren PC, Dong Q, Gomez-Hassan D, et al. Diffusion tensor imaging of the brain: review of clinical applications. Neuroradiology 2004;46:339–50 [DOI] [PubMed] [Google Scholar]
- 17.Cakirer S, Yagmurlu B, Savas MR. Sturge-Weber syndrome: diffusion magnetic resonance imaging and proton magnetic resonance spectroscopy findings. Acta Radiol 2005;46:407–10 [DOI] [PubMed] [Google Scholar]
- 18.Bayley N. Bayley Scales of Infant Development. 2nd ed. San Antonio: Psychological Corporation/Harcourt Brace & Company;1993
- 19.Wechsler D. Wechsler Intelligence Scale for Children. 3rd ed. San Antonio, Tex: The Psychological Corporation;1991
- 20.Bergstroem M, Litton J, Bohm C, et al. Determination of object contours from projection for attenuation correction in cranial positron emission tomography. J Comp Assist Tomogr 1982;6:365–72 [DOI] [PubMed] [Google Scholar]
- 21.Kimiwada T, Juhász C, Makki M, et al. Hippocampal and thalamic diffusion abnormalities in children with temporal lobe epilepsy. Epilepsia 2006;47:167–75 [DOI] [PubMed] [Google Scholar]
- 22.Morriss MC, Zimmerman RA, Bilaniuk LT, et al. Changes in brain water diffusion during childhood. Neuroradiology 1999;41:929–34 [DOI] [PubMed] [Google Scholar]
- 23.Mukherjee P, Miller JH, Shimony JS, et al. Normal brain maturation during childhood: developmental trends characterized with diffusion-tensor MR imaging. Radiology 2001;221:349–58 [DOI] [PubMed] [Google Scholar]
- 24.Schmithorst VJ, Wilke M, Dardzinski BJ, et al. Correlation of white matter diffusivity and anisotropy with age during childhood and adolescence: a cross-sectional diffusion-tensor MR imaging study. Radiology 2002;222:212–18 [DOI] [PMC free article] [PubMed] [Google Scholar]
- 25.Muzik O, Chugani DC, Shen C, et al. Objective method for localization of cortical asymmetries using positron emission tomography to aid surgical resection of epileptic foci. Comput Aided Surg 1998;3:74–82 [DOI] [PubMed] [Google Scholar]
- 26.Chugani HT, Phelps ME, Mazziotta JC. Positron emission tomography study of human brain functional development. Ann Neurol 1987;22:487–97 [DOI] [PubMed] [Google Scholar]
- 27.Muzik O, da Silva E, Juhász C, et al. Intracranial EEG vs. flumazenil and glucose PET in children with extratemporal lobe epilepsy. Neurology 2000;54:171–79 [DOI] [PubMed] [Google Scholar]
- 28.Juhász C, Chugani DC, Muzik O, et al. Relationship of flumazenil and glucose PET abnormalities to neocortical epilepsy surgery outcome. Neurology 2001;56:1650–58 [DOI] [PubMed] [Google Scholar]
- 29.Oka K, Rhoton AL Jr, Barry M, et al. Microsurgical anatomy of the superficial veins of the cerebrum. Neurosurgery 1985;17:711–48 [DOI] [PubMed] [Google Scholar]
- 30.Ono M, Rhoton AL Jr, Peace D, et al. Microsurgical anatomy of the deep venous system of the brain. Neurosurgery 1984;15:621–57 [DOI] [PubMed] [Google Scholar]
- 31.Ferner H. Anatomische and phlebographische Studien der inneren Hirnvenen des Menschen. Z Anat Entwicklungsgesch 1958;120:481–91 [PubMed] [Google Scholar]
- 32.Andeweg J. The anatomy of collateral venous flow from the brain and its value in aetiological interpretation of intracranial pathology. Neuroradiology 1996;38:621–28 [DOI] [PubMed] [Google Scholar]
- 33.Andeweg J. Consequences of the anatomy of deep venous outflow from the brain. Neuroradiology 1999;41:233–41 [DOI] [PubMed] [Google Scholar]
- 34.Terdjman P, Aicardi J, Sainte-Rose C, et al. Neuroradiological findings in Sturge-Weber syndrome (SWS) and isolated pial angiomatosis. Neuropediatrics 1991;22:115–20 [DOI] [PubMed] [Google Scholar]
- 35.Juhász C, Chugani DC, Muzik O, et al. Is epileptogenic cortex truly hypometabolic on interictal positron emission tomography? Ann Neurol 2000;48:88–96 [PubMed] [Google Scholar]
- 36.Kornhuber HH, Bechinger D, Jung H, et al. A quantitative relationship between the extent of localized cerebral lesions and the intellectual and behavioural deficiency in children. Eur Arch Psychiatry Neurol Sci 1985;235:129–33 [DOI] [PubMed] [Google Scholar]
- 37.Vargha-Khadem F, O'Gorman AM, Watters GV. Aphasia and handedness in relation to hemispheric side, age at injury and severity of cerebral lesion during childhood. Brain 1985;108:677–96 [DOI] [PubMed] [Google Scholar]
- 38.Levine SC, Huttenlocher P, Banich MT, et al. Factors affecting cognitive functioning of hemiplegic children. Dev Med Child Neurol 1987;29:27–35 [DOI] [PubMed] [Google Scholar]
- 39.Banich MT, Levine SC, Kim H, et al. The effects of developmental factors on IQ in hemiplegic children. Neuropsychologia 1990;28:35–47 [DOI] [PubMed] [Google Scholar]
- 40.Trauner DA, Nass R, Ballantyne A. Behavioural profiles of children and adolescents after pre- or perinatal unilateral brain damage. Brain 2001;124:995–1002 [DOI] [PubMed] [Google Scholar]
- 41.Shenkin SD, Bastin ME, Macgillivray TJ, et al. Cognitive correlates of cerebral white matter lesions and water diffusion tensor parameters in community-dwelling older people. Cerebrovasc Dis 2005;20:310–18 [DOI] [PubMed] [Google Scholar]
- 42.Charlton RA, Barrick TR, McIntyre DJ, et al. White matter damage on diffusion tensor imaging correlates with age-related cognitive decline. Neurology 2006;66:217–22 [DOI] [PubMed] [Google Scholar]
- 43.Deary IJ, Bastin ME, Pattie A, et al. White matter integrity and cognition in childhood and old age. Neurology 2006;66:505–12 [DOI] [PubMed] [Google Scholar]
- 44.Norman MG, Schoene WC. The ultrastructure of Sturge-Weber disease. Acta Neuropathol 1977;37:199–205 [DOI] [PubMed] [Google Scholar]
- 45.Di Trapani G, Di Rocco C, Abbamondi AL, et al. Light microscopy and ultrastructural studies of Sturge-Weber disease. Childs Brain 1982;9:23–36 [DOI] [PubMed] [Google Scholar]
- 46.Haacke EM, Xu Y, Cheng YC, et al. Susceptibility weighted imaging (SWI). Magn Res Med 2004;52:612–18 [DOI] [PubMed] [Google Scholar]
- 47.Böttcher J, Sauner D, Jentsch A, et al. Visualization of symmetric striopallidodentate calcinosis by using high-resolution susceptibility-weighted MR imaging. An account of the impact of different diagnostic methods of M. Fahr Nervenarzt 2004;75:355–61 [DOI] [PubMed] [Google Scholar]