Abstract
BACKGROUND AND PURPOSE: Our aim was to retrospectively investigate the prognostic significance of the degree of contrast enhancement in tumors and its additional value in previously considered MR imaging parameters with regard to local control of laryngeal cancer treated with radiation therapy (RT) alone.
MATERIALS AND METHODS: Pretreatment MR images of 64 consecutive patients (54 men and 10 women, 43–80 years of age) with supraglottic and glottic cancer were retrospectively reviewed on clinical and previously considered MR imaging parameters such as tumor involvement of specific laryngeal anatomic subsites, including laryngeal cartilages, tumor volume, extralaryngeal tumor spread, and, in addition, the degree of contrast enhancement. Clinical and MR imaging parameters were associated with regard to local control at 2 years by using the Cox regression model. “Local control” was defined as absence of primary tumor recurrence.
RESULTS: When using a threshold of the mean average contrast enhancement of 77%, the 2-year local control rate in the groups of patients with a degree of enhancement below and above this threshold was 57% and 70%, respectively (P=.3). Enhancement of tumor tissue in pre-epiglottic space (PES) was low, most probably due to its adipose tissue and poor vascular content, whereas tumor tissue involving paraglottic space (PGS) did enhance. Results of multivariate analysis indicated that the degree of contrast enhancement yielded the prognostic information (P=.07) with 2 independent prognostic factors: primary tumor volume (P=.007) and subglottic extension (P=.002) with regard to local control. Using these previously mentioned 3 MR imaging parameters as potential risk factors, we defined 4 categories, resulting in the following local control rates respectively: 90% for the group without risk factors, 73% for the group with 1, 60% for the group with 2, and finally 0% for the group with 3 risk factors, which was significantly lower than the rates in previous risk groups (P < .001).
CONCLUSION: PES has a lower degree of contrast enhancement than the PGS and may correlate with the worse outcome. Including a low degree of contrast enhancement as a parameter to primary tumor volume and subglottic extension may increase the predictive value of MR imaging for local outcome and may be helpful to identify a subset of patients whose tumors all recurred locally within 2 years after primary RT.
The results of several studies present tumor enhancement patterns obtained by dynamic contrast-enhanced MR imaging as a promising method to assess response to cytotoxic therapy in various malignancies.1–6 Moreover, previous studies in cancer treated with radiation therapy (RT) suggested a correlation between the dynamic enhancement pattern and tumor control that is consistent with the well-known dependence between tumor oxygenation and radiation response.2,6–8 Tumors with higher mean dynamic enhancement values showed better blood and oxygen supply.6 Clinical as well as experimental data suggested that hypoxia could influence prognosis as a result of decreased radiosensitivity.8 Therefore, decreased enhancement may be associated with worse outcome in patients treated with RT. MR imaging parameters demonstrating vascularity may enable prediction of local control more effectively and, therefore, help to select patients who may benefit more from additional or more aggressive therapies.9 We are unaware of imaging studies that investigated whether contrast enhancement in the primary lesion correlated with local control in laryngeal carcinoma. The previously considered MR imaging parameters, such as tumor involvement of specific laryngeal anatomic subsites, including laryngeal cartilages, tumor volume, and extralaryngeal tumor spread, have already been evaluated.10 The main purpose of the present study was to retrospectively investigate the prognostic significance of the degree of contrast enhancement in tumors and its additional value in previously considered MR imaging parameters, with regard to local control of laryngeal cancer treated with RT alone.
Materials and Methods
Patient Population
The hospital charts of 130 patients treated with RT alone for squamous cell carcinoma of the larynx, between December 1994 and January 2002, were retrospectively reviewed. A minimal 24 months of clinical follow-up after completion of RT was required. Of these 130 patients, 64 (49%) were eligible for this study, including 54 men (84%; mean age, 64 years; range, 43–80 years) and 10 women (16%; mean age, 60 years; range, 48–77 years). The major reasons for exclusion were <24 months follow-up after RT, patients with a previous history of laryngeal cancer or other malignant diseases in the head and neck region, and lack of qualifying MR imaging studies. Eighty-one patients were initially identified. However, contrast-enhanced images of 17 patients were omitted from the study due to the differences in pulse sequences between pregadolinium and postgadolinium axial T1-weighted MR images. All tumors were staged clinically according to the International Union Against Cancer recommendations11 and originated in the supraglottic region (n=28) or the glottic region (n=36). This retrospective study was performed with the approval of our institutional review board; patient informed consent was waived by the review board because all images were acquired for clinical purposes and were considered as existing data documents. The pretreatment tumor characteristics are listed in Table 1.
Table 1:
Pretreatment tumor characteristics (n= 64)
| Variable | No. of Patients | % of Total |
|---|---|---|
| T classification | ||
| T1 | 10 | 16 |
| T2 | 30 | 47 |
| T3 | 11 | 17 |
| T4 | 13 | 20 |
| N classification | ||
| N0 | 51 | 80 |
| N1 | 7 | 11 |
| N2 | 6 | 9 |
| Vocal cord mobility (left side) | ||
| Normal | 52 | 81 |
| Impaired | 7 | 11 |
| Fixed | 5 | 8 |
| Vocal cord mobility (right side) | ||
| Normal | 56 | 87 |
| Impaired | 7 | 11 |
| Fixed | 1 | 2 |
| Histopathology | ||
| Well-differentiated | 10 | 16 |
| Moderately differentiated | 43 | 67 |
| Poorly differentiated | 11 | 17 |
MR Imaging
All images were obtained with 1T and 1.5T MR imaging units (Impact and Vision; Siemens, Erlangen, Germany) with an anterior surface neck coil. Axial T1-weighted spin-echo images (310–800/15 ms [TR/TE]) were obtained before and after the intravenous administration of contrast material (0.1 mmol/kg of gadolinium diethylene triamine pentaacetic acid (Magnevist; Schering, Berlin, Germany) in all patients. We also generated proton-attenuation (PD)–weighted and T2-weighted MR images in the axial plane (2200–4550/16–22 ms [TR/TE] for PD-weighted and 2200–4550/90–98 ms [TR/TE] for T2-weighted MR images) at each level corresponding with T1-weighted MR images. In most cases, a 4-mm section thickness was used (varying between 3 and 5 mm) with a 0.4-mm intersection gap, and the field of view was kept as small as possible, so that with a 256 × 256 matrix, the images had a pixel resolution of 0.8 × 1.0 mm. The patients were instructed to breathe quietly and to refrain from coughing or swallowing.
All digital MR images were retrospectively reviewed and evaluated by 2 observers (in consensus) with, respectively, 13 and 4 years’ experience of head and neck MR imaging who were blinded to clinical outcome. MR imaging parameters were assessed, including the primary tumor volume; the presence of supraglottic, glottic, and/or subglottic extension; invasion of pre-epiglottic space (PES) and/or paraglottic space (PGS); and abnormal signal intensity (SI)/destruction of cartilages adjacent to tumor tissue; extralaryngeal spread; and involvement of the hypopharynx. Tumor involvement to the hypopharynx was described as invasion of the lateral wall of the piriform sinus and postcricoid area. Special attention was directed at assessing the degree of contrast enhancement of primary lesions. The semiquantitative analysis of the degree of contrast enhancement was performed by using regions of interests (ROIs). The identically sized region of interest (32 mm2) was placed within the tumor area on the level where the largest tumor mass was seen (on 1 representative level for each patient), and the mean SI was measured. In addition, the ROIs at the tumor mass were again placed on 1 or 2 locations within the tumor. In case of gross extension of the tumor mass in the PES and/or PGS, these spaces were selectively examined by placing an ROI. The degree of contrast enhancement was calculated by using the following formula:
 |
As a reference, the degree of contrast enhancement was also calculated for the sternocleidomastoideus muscle to explore if the reference tissue showed a constant level of enhancement.
From 1994, digital MR images were obtained directly. The tumor outlines were traced manually on T1-weighted MR images by 1 observer (R.L.) with the use of a computerized image-analysis tool that is available as part of the PACS of our hospital (Centricity Radiology RA 600, Version 6.1; GE Healthcare, Milwaukee, Wis). The volume of the tumor was calculated in milliliters by multiplying areas with section thickness and intersection gap, and then it was summarized over all sections in which the tumor was present.
RT and Follow-Up
The definitive RT with daily fractions ranging from 2.0 to 2.5 Gy was started within a short time (mean, 43 days) after the MR imaging examination. Typically, the total radiation dose depended on the clinical T classification and was 60 Gy for T1 lesions (2.5 Gy per fraction/5 times per week) and 70 Gy for T2-T4 lesions (2.0 Gy per fractions, 6 times per week).
The patients received regular surveillance in the outpatient clinic (ie, every 2 months in the first 2 years after completion of RT; every 3 months in the third year; and every 4–6 months thereafter, supplemented in cases of suspect recurrence by direct laryngoscopy with biopsies). Imaging was not routinely performed. Local control was defined as absence of a recurrence at the primary site. Histologically proved local recurrences during follow-up were considered as local failures, to evaluate the efficacy of RT in local control. No patient was lost to follow-up. The minimum follow-up period was the follow-up ending either at local recurrence of the primary tumor or at last patient contact in 2 years. The mean follow-up time was 28 months (range, 4–93 months).
Statistical Analysis
The end point used in the statistical analyses was local control at 2 years. Local control was estimated by using the Kaplan-Meier method. Outcome was measured from the first day of RT to the date of local recurrence or the last date of follow-up. Using the mean value of degree of contrast enhancement as the threshold, we classified the patients into 2 groups. One-way analysis of variance (ANOVA) test was used to evaluate the statistical significance of the differences in the means of degree of contrast enhancement. The degree of contrast enhancement was also correlated with location of the primary tumor (supraglottis versus glottis).
In the univariate analysis, the logrank test was used to test differences between curves. We applied the Cox step-by-step proportional hazards regression model for multivariate analysis, in which the variables were tested for its significant impact on local control after RT. In the first step, the degree of enhancement was entered in the regression model and then clinical and MR imaging-determined variables were added one by one for possible confounding. The following variables were entered into the statistical model: sex (male versus female), age (<63 years versus >63 years); T classification (T1 versus T2 versus T3 versus T4); N classification (N0 versus N+); vocal cord mobility bilaterally (normal versus impaired versus fixed); primary tumor volume (0–4 mL versus >4 mL); supraglottic extension (no versus yes); glottic extension (no versus yes); subglottic extension (no versus yes); PES invasion (no versus yes); PGS invasion (no versus yes); abnormal signal intensity of thyroid cartilage at the anterior commissure (no versus yes), of cricoid cartilage (no versus yes), and of the remaining part of thyroid cartilage (no versus yes); extralaryngeal spread (no versus yes); hypopharyngeal extension (no versus yes); and degree of contrast enhancement (low versus high). Extralaryngeal extension of cricoid, thyroid, and thyroid at the anterior commissure was statistically classified as “not present” versus “present” in at least one of these structures.
A value of P < .05 was considered a significant difference. When using the selection procedure, one should avoid rigid application of a particular significance level. The significance level should not be too small, to guide decisions on whether to include or omit a term; a level of 10% is recommended,12 which was used for multivariate analysis. All statistical calculations were performed by using software (SPSS, Version 11.0; SPSS, Chicago, Ill).
Results
MR Imaging Parameters
Pretreatment MR imaging parameters, regarding tumor location and extent, are listed in Table 2. The mean tumor volume of all cases was 7.4 mL (median, 4.0 mL; range, 0.28–47.5 mL).
Table 2:
Tumor extension and abnormal signal intensity in adjacent laryngeal cartilages
| Site | Glottic Lesion (n = 36) | Supraglottic Lesion (n = 28) | Patients* |
|---|---|---|---|
| Glottis | Primary location | 22 | 22 (34) |
| Supraglottis | 11 | Primary location | 11 (17) |
| Subglottis | 16 | 9 | 25 (39) |
| PES | 5 | 19 | 24 (37) |
| PGS | 2 | 15 | 17 (27) |
| Thyroid cartilage at anterior commissure | 14 | 6 | 20 (31) |
| Extralaryngeal extension at anterior commissure | 2 | 3 | 5 (8) |
| Thyroid cartilage | 6 | 7 | 13 (20) |
| Extralaryngeal extension at thyroid | 1 | 2 | 3 (5) |
| Cricoid cartilage | 5 | 5 | 10 (16) |
| Extralaryngeal extension at cricoid | 0 | 1 | 1 (2) |
| Hypopharynx | 2 | 10 | 12 (19) |
Data are numbers of patients affected by tumor extension at the site indicated. Numbers in parentheses are percentages of the total (n = 64 patients).
Degree of Contrast Enhancement
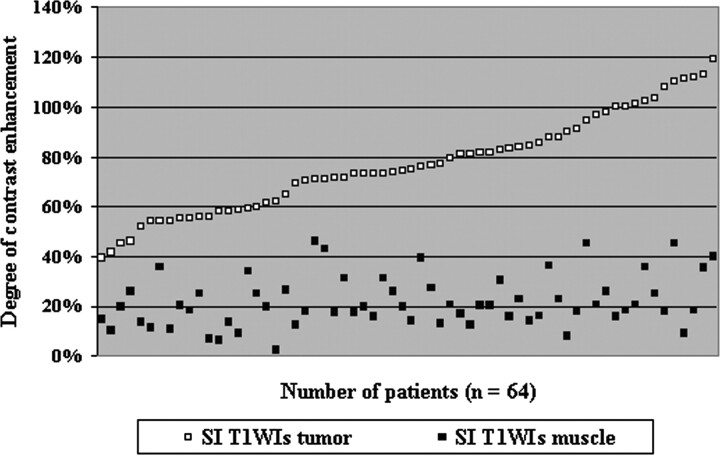
The mean degree of contrast enhancement was 77% for tumor (median, 75%; range, 39%–119%) and 22% for muscle, which served as a reference (median, 20%; range, 2%–46%) (Fig 1). The mean degree of contrast enhancement was 76% (range, 45%–119%) for supraglottic carcinoma and 77% (range, 39%–113%) for glottic carcinoma; this difference was not statistically significant. On the basis of the degree of enhancement, patients were divided into 2 groups with the mean value used as a threshold at 77%. Thirty-six patients (56%) were classified as having a low degree of enhancement (below 77%; mean, 63%; median, 62%), and 28 patients (44%) were classified as having a high degree of enhancement (equal or above of 77%; mean, 95%; median, 93%). A significant correlation was found between these 2 groups (ANOVA test, P < .001). Two representative cases of low- and high-enhancing tumors on MR images are illustrated in Figs 2 and 3.
Fig 1.
The degree of contrast enhancement was calculated by using the following formula: Degree of contrast enhancement (%) = [(SIPostcontrast − SIPrecontrast) / SIPrecontrast] × 100. Comparison of the degree of contrast enhancement measured within the tumor (range, 39%–119%) and normal tissue (range, 2%–46%) on T1-weighted MR images (T1WIs) in 64 patients with laryngeal carcinoma.
Fig 2.
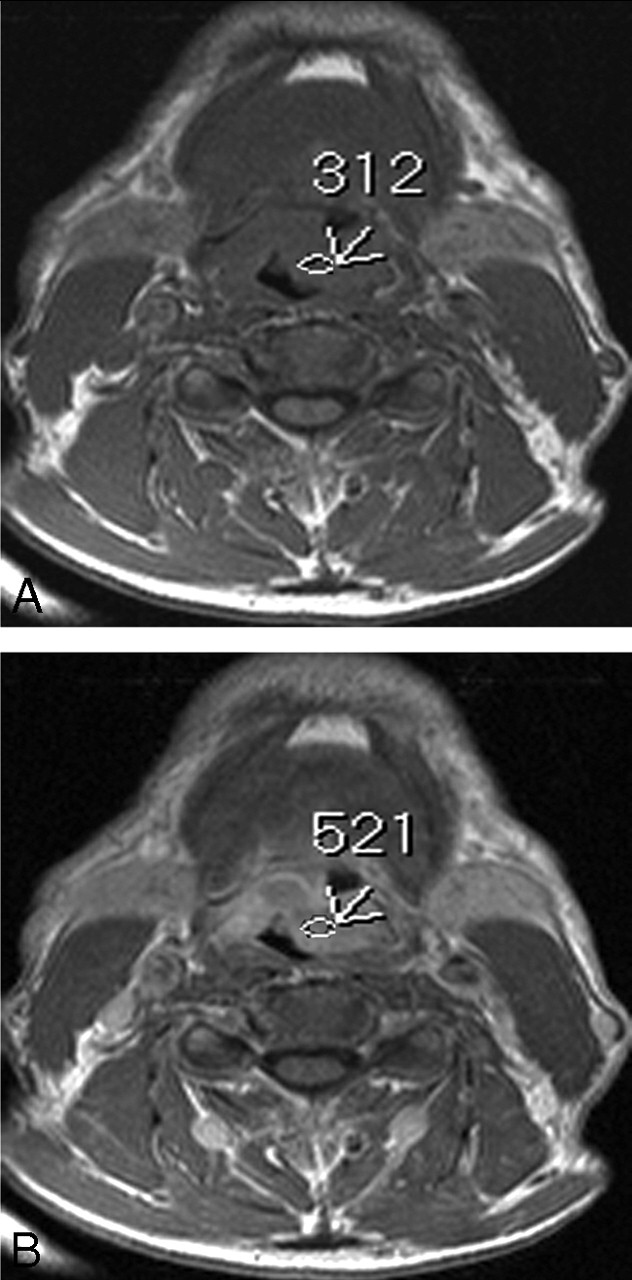
Axial T1-weighted MR images (600/15 ms [TR/TE]) before (A) and after (B) contrast administration. In this example, the SI of the supraglottic mass increases from 312 to 521 within tumor area (arrows), leading to a degree of contrast enhancement of (521–312)/ 312 = 67%. The tumor was considered as a low-enhanced tumor, which locally recurred within 11 months after RT.
Fig 3.
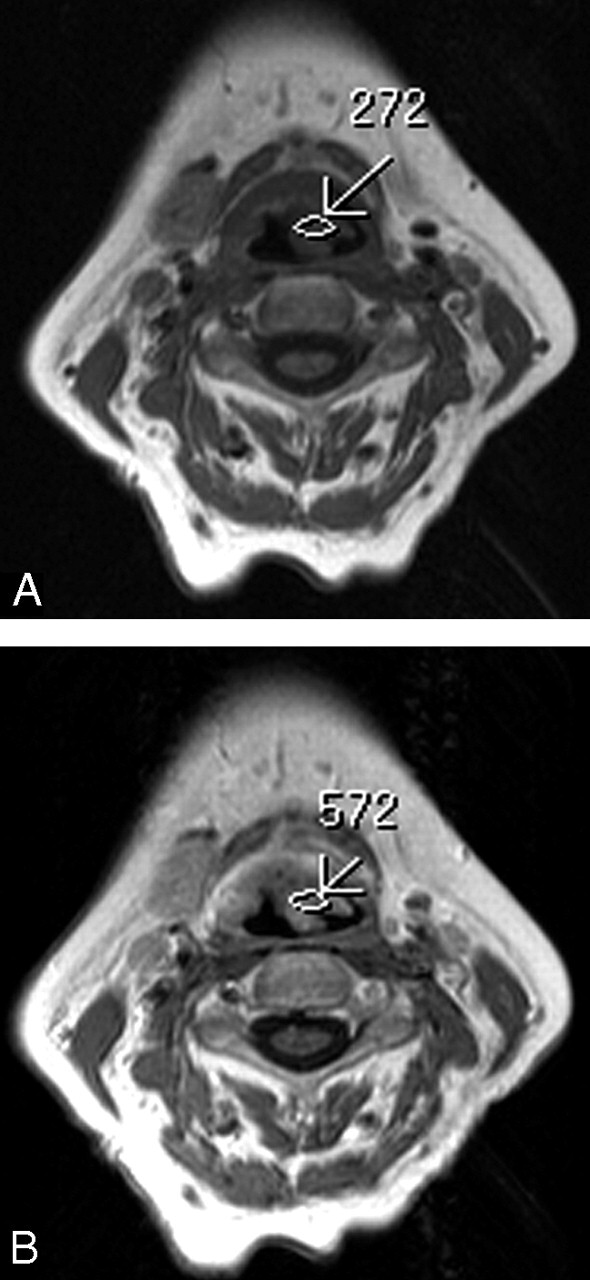
Axial T1-weighted MR images (600/15 ms [TR/TE]) before (A) and after (B) contrast administration show a supraglottic mass with the SI that increases from 246 to 513 within the tumor area (arrows). The degree of contrast enhancement was (572–272)/272 = 110%. The tumor was considered a high-enhanced tumor. Local recurrence was not documented within 24 months after RT.
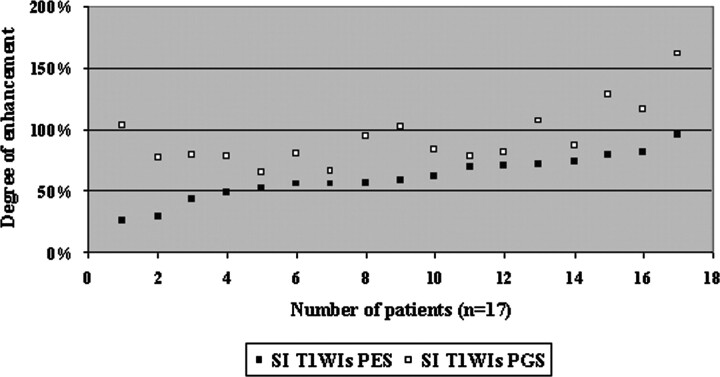
There were 24 of 64 patients (37%) with tumor invasion to the PES and 17 patients (27%) with tumor involving both the PGS and PES invasion. None of the patients had PGS invasion without PES invasion. In 17 patients with invasion both in PES and PGS, a significant difference regarding the degree of contrast enhancement was found between PES and PGS (P=.006) (Fig 4). The mean degree of contrast enhancement was 55% for tumor in the PES (n=24; median, 55%; range, 15%–95%) and 93% for tumor in PGS (n=17; median, 83%; range, 64%–161%). Areas of different signal intensities on MR images corresponded to tumor invasion to the PES or PGS as shown in Fig 5. When we used a threshold of the mean average enhancement of 77%, 17 of 24 patients (71%) with tumor in the PES and only 2 of 17 patients (12%) with tumor in PGS were sorted as patients with low-enhanced tumors.
Fig 4.
Comparison of the degree of contrast enhancement measured within the tumor in PES (range, 15%–95%) and tumor in PGS normal tissue (range, 64%–161%) on T1-weighted MR images in 17 patients with laryngeal carcinoma. A statistical difference was found between these 2 spaces (P = .006).
Fig 5.
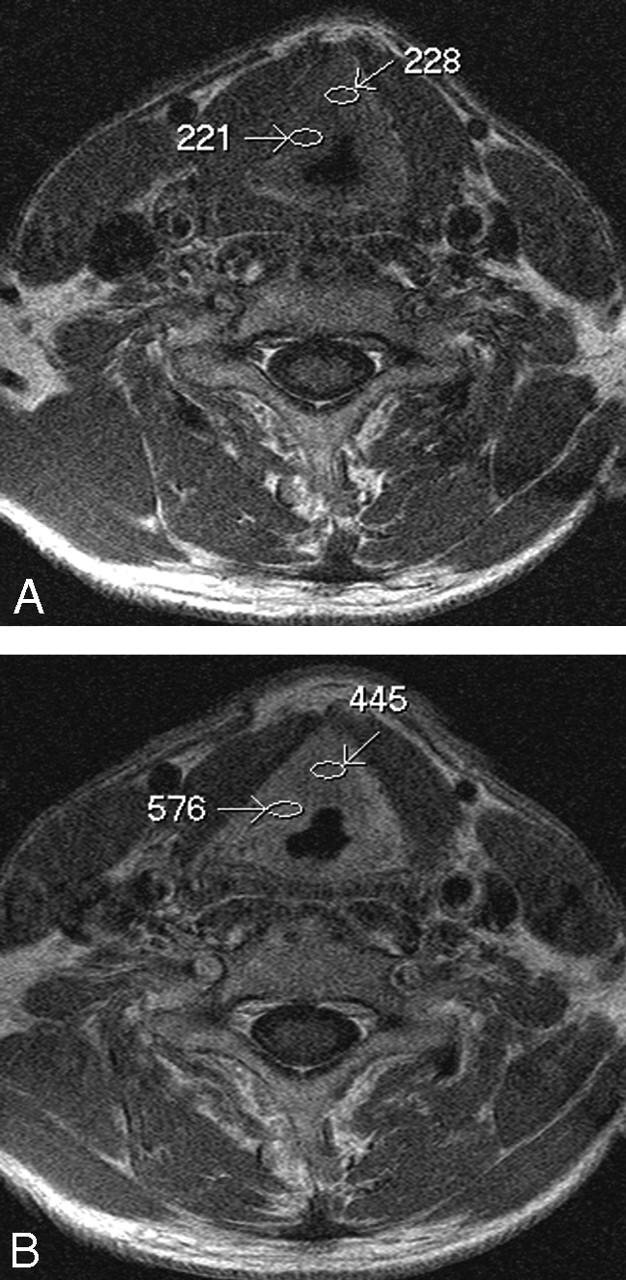
Axial T1-weighted MR images (500/15 ms [TR/TE]) before (A) and after (B) contrast administration. In this illustration, the SI of the tumor mass at the right side on the false vocal cord level, involving the PES, increases from 228 to 445 within the tumor area and, involving the PGS, from 221 to 576 (arrows). The degree of contrast enhancement was 95% for a tumor in the PES and 160% for a tumor in the PGS.
Local Control
A total number of 28 of 64 patients developed a local recurrence (44%). From these 28 patients, 18 patients had tumors with a low degree of enhancement (64%), whereas the remaining 10 patients (36%) had tumors with a high degree of enhancement. Nine of 17 patients with tumor invasion to the PES and PGS (53%) had a local recurrence. There were 7 patients with PES invasion without PGS invasion, of which 5 had a local recurrence (71%).
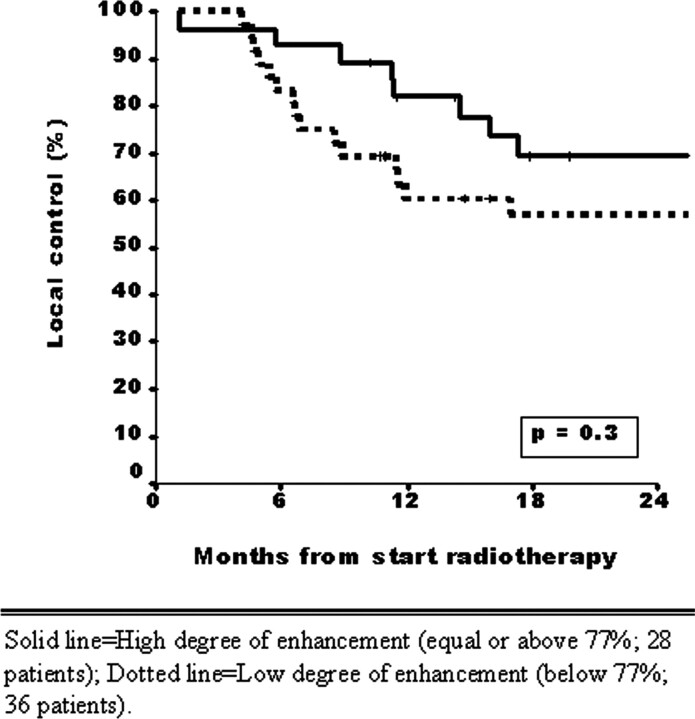
In the univariate analysis, the only MR imaging–determined tumor parameters were significantly associated with local control, including primary tumor volume (P=.002), PES invasion (P=.05), and subglottic extension (P=.001). The degree of contrast enhancement (low versus high) was not significantly associated with local control (P=.3) (Fig 6).
Fig 6.
Patients with low-enhanced laryngeal tumor tissue (below 77%, dotted line, n = 36) show poor prognosis (2-year local control rate, 57%) compared with high-enhanced laryngeal tumor tissue (equal or above 77%, solid line, n = 28) (2-year local control rate, 70%).
The multivariate analysis (a statistical level of 10% was used) with regard to local control revealed that subglottic extension, primary tumor volume, and the degree of contrast enhancement were significantly associated with local control (Table 3). For none of the clinical characteristics entered in the multivariate model was such an association found.
Table 3:
Final results of the multivariate analysis regarding local control
| Variable | Score | Regression Coefficent | Hazard Ratio | 95% CI | P value |
|---|---|---|---|---|---|
| Primary tumor volume | 0 = 0–4 cm3; 1 = >4 cm3 | 1.13 | 3.1 | 1.4–7.1 | .007 |
| Subglottic extension | 0 = no; 1 = yes | 1.27 | 3.5 | 1.6–7.9 | .002 |
Note:—CI indicates confidence interval.
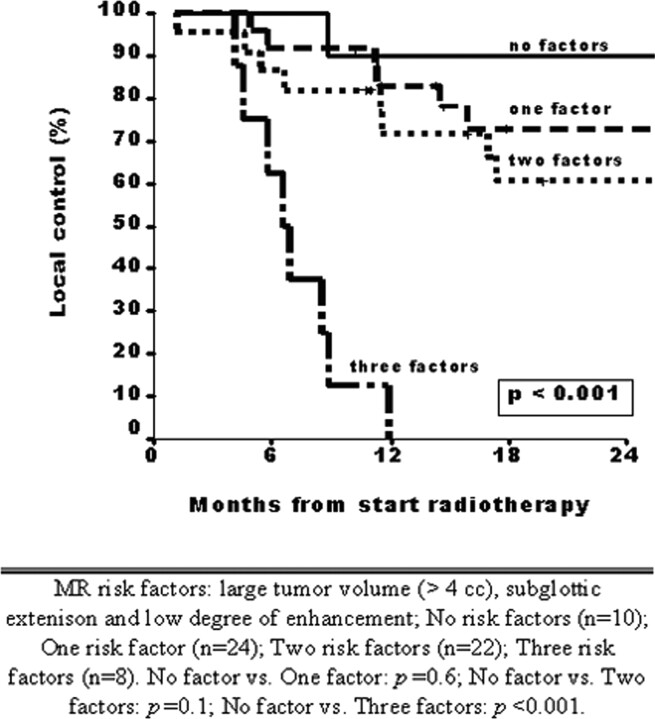
To identify which patients are likely to fail RT, we evaluated the additional value of the degree of contrast enhancement above the other MR imaging parameters. First, we estimated the local control rates at 2 years by using the 2 other independent prognostic factors, large tumor volume and subglottic extension. Among patients with neither of these 2 factors, local control at 2 years was 74% compared with 29% among those with both risk factors. When the low degree of enhancement was added to this multivariate model, 4 categories of patients could be defined by using 3 MR imaging risk factors (large tumor volume, subglottic extension, and degree of enhancement): 10 of 64 patients (16%) with no MR imaging risk factors, 24 patients (38%) with 1 MR imaging risk factor, 22 patients (34%) with 2 risk factors, and 8 patients with 3 MR factors (12%). The local control rates after 2 years in these 4 groups were respectively 90%, 73%, 60%, and 0% (P < .001) (Fig 7).
Fig 7.
Patients with 3 MR imaging–determined risk factors are at high risk for local control (1-year local control rate, 0%). MR imaging risk factors are large tumor volume (>4 mL), subglottic extension, and low degree of enhancement. No risk factors (n = 10), 1 risk factor (n = 24), 2 risk factors (n = 22), 3 risk factors (n = 8). No factors versus 1 factor (P = .6), no factors versus 2 factors (P = .1), no factors versus 3 factors (P = .001).
Discussion
This study was undertaken to investigate the additional value of the degree of contrast enhancement to predict local control among patients with laryngeal cancer treated with curative RT. The results revealed that the degree of contrast enhancement appeared to provide additional value for local control above large tumor volume and the subglottic extension. Consequently, it was possible to identify a subset of patients who all had local recurrence within 2 years after primary RT. Laryngeal tumors with higher contrast enhancement showed better local control than the tumors with lower contrast enhancement.
The prediction of local control after nonsurgical therapies is clinically relevant in the management of patients with laryngeal cancer. In patients in whom tumor control is unlikely to be achieved with RT, primary surgery could be a good alternative. All patients included in the present study were treated with RT as single technique. Forastiere et al13 reported the results of a prospective randomized study in which 547 patients with locally advanced and operable laryngeal cancer were randomly assigned to receive induction cisplatin plus fluorouracil followed by RT, RT with concurrent administration of cisplatin, or RT alone. At 2 years, the proportion of patients who had an intact larynx after RT with concurrent cisplatin (88%) differed significantly from the proportions in the groups given induction chemotherapy followed by RT (75%; P=.005) or RT alone (70%; P < .001). Moreover, locoregional control was also significantly better with RT and concurrent cisplatin than with induction cisplatin plus fluorouracil followed by RT or with RT alone. The patients included in our study received suboptimal nonsurgical treatment, and local control might have been better with the use of concomitant chemotherapy. However, the tumors of most patients included in our study were stage I and II (and not considered locally advanced) and even with the addition of concurrent chemotherapy during RT, local control in case of the presence of 3 MR imaging risk factors would probably still be very low, taking into account the local control rate of 0% with RT alone.
How can the results of this study be explained? Contrast-enhanced MR imaging causes an increase in SI of strongly vascularized tissue, such as tumor tissue, due to the reduction of the T1 relaxation time.14 In patients with poor MR imaging prognostic factors in our study, local recurrence occurred more frequently with a low degree of enhancement, suggesting poor vascular supply and resulting hypoxia, than in those with a high degree of enhancement, suggesting high vascular supply and better oxygenation and a lower tumor hypoxic fraction, which consequently results in relative radioresistance. Tumor microcirculation is believed to play an important role in the effective cytotoxic therapy of the cancer.15 The oxygenation status of tumors, presumably related to the blood supply and microcirculation of the tumor (capillary attenuation), has been a well-known factor affecting the response of tumors to radiation.7,16–18 As known, the increase in contrast enhancement in a tumor mass suggests that the vascular bed per unit of tumor volume has increased. Our data suggest that the blood supply and oxygenation may have improved in the remaining tumor cells. This hypothesis is supported by the study of Becker et al,19 who investigated the relationship between tumor oxygenation and hemoglobin level among patients with squamous cell carcinoma of the head and neck. Tumor oxygenation was analyzed by using polarographic partial pressure of oxygen measurements. The data from this study strongly suggest that a low hemoglobin level contributes to an inadequate oxygenation of the tumor. These findings support the hypothesis of a relative radioresistance due to hypoxia resulting from less tumor blood supply.
Although our results suggest that the combined analysis is potentially valuable in predicting tumor control, our study has some limitations. The methodology of SI measurements may be limited because of potential errors related to the presumed heterogeneity of the tumor. Furthermore, there was certain variability in the enhancement of the muscle used as a reference, which may be the consequence of dynamic changes of contrast enhancement and might have a bearing on our results. Changes in contrast enhancement in muscular tissue are relatively low compared with changes in tumor tissue (Fig 1). In addition, our study was retrospective, and further investigation regarding dynamic contrast-enhanced MR imaging parameters should be performed.
The critical submucosal spaces inside the larynx are the PES and the PGS.20 Tumors in PES and PGS enhance differently on T1-weighted MR images after the contrast administration. Tumor tissue within PES enhances at a low degree, whereas tumor tissue involving the PGS enhances strongly. The PES is known as a poorly vascularized area, which mostly contains fat tissue.21 The poor blood supply of the PES may cause hypoxia in tumor tissue and may explain its relative resistance to RT.22,23 In accordance with previous studies, tumor involvement to the PES in supraglottic carcinoma is a strong independent prognostic factor for the tumor recurrence.10,24–26 The low degree of contrast enhancement in this study may therefore be expected in patients with tumor involvement to the PES and may correlate with a poor prognosis (Fig 4).
Conclusion
Combined information obtained from the MR imaging–related tumor parameters including enhancement pattern analyses appears to be a useful tool to predict local control among patients with laryngeal cancer treated with RT. Moreover, with the combination of 3 MR imaging–related independent risk factors such as large tumor volume, subglottic extension, and low degree of enhancement, it was possible to identify a subset of patients who all had local recurrence within 2 years after primary RT.
References
- 1.Schuuring J, Rijpkema M, Bernsen H, et al. Effect of breathing a hyperoxic hypercapnic gas mixture on the oxygenation of meningiomas: preliminary results. J Neurooncol 2002;57:127–32 [DOI] [PubMed] [Google Scholar]
- 2.Mayr NA, Yuh WT, Arnholt JC, et al. Pixel analysis of MR perfusion imaging in predicting radiation therapy outcome in cervical cancer. J Magn Reson Imaging 2000;12:1027–33 [DOI] [PubMed] [Google Scholar]
- 3.Griebel J, Mayr NA, deVries A, et al. Assessment of tumor microcirculation: a new role of dynamic contrast MR imaging. J Magn Reson Imaging 1997;7:111–19 [DOI] [PubMed] [Google Scholar]
- 4.Wenz F, Rempp K, Hess T, et al. Effect of radiation on blood volume in low-grade astrocytoma and normal brain tissue: quantification with dynamic susceptibility contrast MR imaging. AJR Am J Roentgenol 1996;166:187–93 [DOI] [PubMed] [Google Scholar]
- 5.Reddick WE, Taylor JS, Fletcher BD. Dynamic MR imaging (DEMRI) of microcirculation in bone sarcoma. J Magn Reson Imaging 1999;10:277–85 [DOI] [PubMed] [Google Scholar]
- 6.Mayr NA, Yuh WTC, Magnotta VA, et al. Tumor perfusion studies using fast magnetic resonance imaging technique in advanced cervical cancer: a new noninvasive predictive assay. Int J Radiat Oncol Biol Phys 1996;36:623–33 [DOI] [PubMed] [Google Scholar]
- 7.Gatenby RA, Kessler HB, Rosenblum JS, et al. Oxygen distribution in squamous cell carcinoma metastases and its relationship to outcome of radiation therapy. Int J Radiat Oncol Biol Phys 1988;14:831–38 [DOI] [PubMed] [Google Scholar]
- 8.Gray LH, Conger AD, Ebert M, et al. The concentration of oxygen dissolved in tissues at the time of irradiation as a factor in radiotherapy. Br J Radiol 1953;26:638–48 [DOI] [PubMed] [Google Scholar]
- 9.Mukherji SK, Pillsbury HR, Castillo M. Imaging squamous cell carcinomas of the upper aerodigestive tract: what clinicians need to know. Radiology 1997;205:629–46 [DOI] [PubMed] [Google Scholar]
- 10.Ljumanovic R, Langendijk JA, Schenk B, et al. Supraglottic carcinoma treated with curative radiation therapy: identification of prognostic groups with MR imaging. Radiology 2004;232:440–48 [DOI] [PubMed] [Google Scholar]
- 11.Sobin LH, Wittekind Ch. TNM Classification of Malignant Tumors. 6th ed. Geneva, Switzerland: International Union Against Cancer;2002. :36–42
- 12.Collett D. Modelling Survival Data in Medical Research. 1st ed. London, UK: Chapman & Hall;1994. :81
- 13.Forastiere AA, Goepfert H, Maor M, et al. Concurrent chemotherapy and radiotherapy for organ preservation in advanced laryngeal cancer. N Engl J Med 2003;349:2091–98 [DOI] [PubMed] [Google Scholar]
- 14.Vogl T, Dresel S, Juergens M, et al. MR imaging with Gd-DTPA in lesions of the head and neck. J Otolaryngol 1993;22:220–30 [PubMed] [Google Scholar]
- 15.Taylor JS, Tofts PS, Port R, et al. MR imaging of tumor microcirculation: promise for the new millennium. J Magn Reson Imaging 1999;10:903–07 [DOI] [PubMed] [Google Scholar]
- 16.Rijpkema M, Kaanders JHAM, Joosten FBM, et al. Effects of breathing a hyperoxic hypercapnic gas mixture on blood oxygenation and vascularity of head-and-neck tumors as measured by magnetic resonance imaging. Int J Radiat Oncol Biol Phys 2002;53:1185–91 [DOI] [PubMed] [Google Scholar]
- 17.Bush RS, Jenkin RDT, Allt WEC. Definitive evidence for hypoxic cells influencing cure in cancer therapy. Br J Cancer 1978;37(suppl):302–06 [PMC free article] [PubMed] [Google Scholar]
- 18.Hockel M, Schlenger K, Aral B, et al. Association between tumor hypoxia and malignant progression in advanced cancer of the uterine cervix. Cancer Res 1996;56:4509–15 [PubMed] [Google Scholar]
- 19.Becker A, Hansgen G, Bloching M, et al. Oxygenation of squamous cell carcinoma of the head and neck: comparison of primary tumors, neck node metastases, and normal tissue. Int J Radiat Oncol Biol Phys 1998;42:35–41 [DOI] [PubMed] [Google Scholar]
- 20.Sato K, Kurita S, Hirano M. Location of the preepiglottic space and its relationship to the paraglottic space. Ann Otol Rhinol Laryngol 1993;102:930–34 [DOI] [PubMed] [Google Scholar]
- 21.Fletcher GH, Hamberger AD. Causes of failure in irradiation of squamous-cell carcinoma of the supraglottic larynx. Radiology 1974;111:697–700 [DOI] [PubMed] [Google Scholar]
- 22.Kirchner JA. What have whole organ sections contributed to the treatment of laryngeal cancer? Ann Otol Rhinol Laryngol 1989;98:661–67 [DOI] [PubMed] [Google Scholar]
- 23.Kirchner JA, Carter D. Intralaryngeal barriers to the spread of cancer. Acta Otolaryngol 1987;103:503–13 [PubMed] [Google Scholar]
- 24.Dursun G, Keser R, Akturk T, et al. The significance of pre-epiglottic space invasion in supraglottic laryngeal carcinoma. Eur Arch Otorhinolaryngol 1997;254(suppl):110–12 [DOI] [PubMed] [Google Scholar]
- 25.Gregor RT. The preepiglottic space revisited: is it significant? Am J Otolaryngol 1990;11:161–64 [DOI] [PubMed] [Google Scholar]
- 26.Loevner LA, Yousem DM, Montone KT, et al. Can radiologists accurately predict preepiglottic space invasion with MR imaging? AJR 1997;169:1681–87 [DOI] [PubMed] [Google Scholar]


