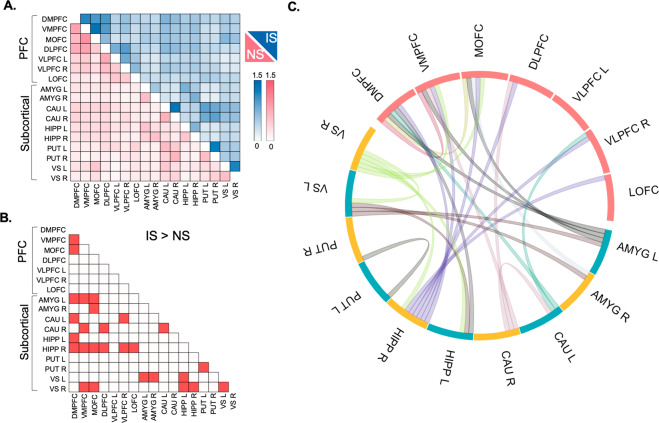
Fig. 2. PFC–subcortical functional hyper-connectivity in the IS group.
A Connectivity within and between PFC subdivisions and subcortical regions are presented separately for intermittently separated (IS) and non-separated (NS) groups with light-to-dark scale bars signifying the range of functional connectivity. B Bright red-colored squares depict links that differ significantly between IS and NS groups (FDR-corrected p < 0.05). C Links that show significant hyper-connectivity in IS monkeys are illustrated in the circular plot.

