

Abstract
Purpose:
The Surviving Sepsis Campaign guidelines recommend 30 mL/kg of fluids within three hours (30by3) of sepsis-induced hypoperfusion, but a national mandate released an allowance for dosing based on ideal instead of actual body weight (IBW/ABW) for obese patients. This study aims to determine the dose-effect of 30by3 for patients with severe sepsis or septic shock (SS/SS) with respect to body mass index (BMI) categories and secondarily, examine the clinical impact of IBW vs. ABW-based dosing.
Methods:
Retrospective cohort study of adults (≥18 years; n=1,032) with SS/SS presenting to an urban, tertiary-care emergency department. Models include MEDS score, antibiotic timing, lactate, renal and heart failure, among others.
Results:
The cohort was 10.2% underweight and 28.7% obese. Overall mortality was 17.1% with 20.4% shock mortality. An exponential increase in mortality was observed for each 5 mL/kg under 30by3 for underweight (p=0.02), but not obese patients. ABW vs IBW-30by3 dosing was reached in 80.0 vs 52.4% (underweight), 56.4 vs 56.9% (normal/overweight), and 23.3 vs 46.0% (obese). Across all BMI categories, there was increased mortality for not reaching ABW-based 30by3 dosing (OR 1.78, 95% CI 1.18–2.69) with no significant impact for IBW (OR 1.28, 95% CI 0.87–1.91). The increased mortality for failing to reach ABW-dosed 30by3 remained for underweight patients ABW (OR 5.82, 95% CI 1.32–25.57) but not obese patients. Longer ICU stays were observed for not reaching 30by3 based on ABW (β=2.40, 95% CI 0.84–3.95) and IBW dosing (β=1.58, 95% CI 0.07–3.08) overall. This effect remained for obese and underweight (except IBW dosing) patients.
Conclusions:
An exponential, dose-effect increase in mortality was observed for underweight patients not receiving 30by3. Therefore, the mortality impact of under-dosing may be amplified using ABW for underweight patients. Fluid dosing did not impact mortality for obese patients, but we caution against deviation from guidelines without further studies.
Keywords: Sepsis, Fluid Resuscitation, Obesity, Body Mass Index, Mortality
Introduction
The US Centers for Medicare and Medicaid Services (CMS) have mandated and incentivized the administration of 30 mL/kg crystalloid fluids within the first three hours of sepsis-induced hypoperfusion (30by3) based on guidelines from the Surviving Sepsis Campaign (SSC).1 The SSC fluid resuscitation guidelines are indiscriminate of comorbid conditions; therefore, this ‘one-size-fits-all’ approach to fluid resuscitation has its detractors, with some evidence to suggest a potential benefit in reduced resuscitative volumes for obese patients.2,3 However, these studies are merely descriptive and do not assess for fluid-based differences in outcomes between obese individuals. Recently, CMS released a modification allowing providers to dose 30by3 using ideal in substitute of actual body weight in obese patients.4
Overall, there is a paucity of evidence assessing the practice of lower volume, ideal body weight-based fluid dosing in the early resuscitation of obese septic patients. One study showed that dosing based on adjusted body weight (a volume less than actual body weight but more than ideal body weight) may improve outcomes for obese patients. However, adjusted body weight-based dosing showed a survival benefit compared to ideal body weight, but no significant difference when compared to actual body weight, suggesting potential harm with ideal body weight dosing.5 Further, studies show an overall survival benefit for severe sepsis or septic shock patients reaching 30by3 using standard actual body weight dosing,6,7 with one showing no differential impact of obesity.7
To our knowledge, there are no existing studies evaluating the impact of early fluid resuscitation on underweight, adult patients. Adipose tissue has significantly less blood volume relative to lean body mass, thus, underweight individuals may have up to 2.5 times the circulating blood volume per kilogram relative to obese individuals.8 Given the principal function of fluid resuscitation is to increase circulating blood volume to augment cardiac output, it stands to reason that differences may exist between underweight and obese patients.
Therefore, the effect of body mass index (BMI) with respect to alternative dosing strategies on early fluid resuscitation in sepsis remains largely unknown. The objectives of this study include: 1) determine the potential dose-effect differences of fluid resuscitation at three hours post sepsis onset per BMI-based body types; 2) assess the impact of receiving 30by3 based on ideal vs actual body weight dosing with emphasis on examining potential differences of BMI-based body types.
Materials and Methods
Study Design:
This was a retrospective analysis from January 1, 2014 to April 30, 2015 and February 1, 2016 to May 31, 2017. Data identifying positive sepsis cases were originally collected as part of a quality improvement initiative and were not available in between these dates. The cohort includes adult patients (≥18 years old) presenting to the emergency department (ED) with severe sepsis or septic shock at an urban, tertiary-care center (~70,000 ED visits per year). The majority of patients treated in this ED are African American (~73% of all visits). The study was approved by the Institutional Review Board (approval #17–1444). This study is a novel analysis from a previously published study cohort.7 We aimed to adhere to the Strengthening the Reporting of Observational Studies in Epidemiology (STROBE) guidelines.9
Patient Selection:
We evaluated the study population for the presence of severe sepsis or septic shock within eight hours of ED arrival. Cases were identified by International Classification of Disease-Revision 9 codes (ICD-9) or ICD-10 codes related to sepsis and are the same as those used for case selection by CMS (Supplementary 1). Next, to capture instances where there was clinical concern for infection, we flagged orders for blood cultures, urine cultures, or antibiotics within 12 hours of ED arrival. A physician reviewed each chart using a standardized process to determine whether infection-related organ dysfunction occurred within eight hours of ED arrival. Each case was reviewed by a physician using a standardized process and was confirmed with treating providers and a multidisciplinary group to improve quality control.
Definitions:
Definitions for sepsis classifications (per Sepsis-2 criteria10) and actual vs ideal body weight dosing,11 special populations (i.e., heart failure), and clinical outcomes are listed in Supplementary 2. BMI-based body types included underweight (BMI < 18.5 kg/m2), normal/overweight (18.5≤ BMI <30 kg/m2), and obese (BMI ≥30 kg/m2) and are consistent with World Health Organization definitions.12 Weight was measured using bed scales and height was self-reported or provided by a patient representative; these were obtained during ED intake. The Mortality in ED Sepsis (MEDS) scores were calculated to help control for disease severity.13
Data Abstraction and Accuracy:
Computational algorithms identified cases and demographic data, effectively blinding the selection process to variables of sepsis management and clinical endpoints. Notably, the physician initially identifying eligible cases was not blinded, although these cases were prospectively selected for quality improvement purposes. All sepsis-relevant interventions and clinical factors were manually collected. Abstractors were trained using strict definitions and protocols and were closely monitored by the principal investigator to ensure data accuracy. A randomly selected subset of 35 charts were reviewed, with raw agreement of 95.1% and inter-rater reliability, κ = 0.93. Abstractors were not blinded to study purpose.
Exclusion Criteria:
Patients with left ventricular assist device (unless initial lactic acid >2.0 mmol/L), made do-not-resuscitate or comfort care within 12 hours of sepsis onset, receiving IV antibiotics 24 hours prior to presentation, or transferred to the operating room within three hours of sepsis onset were excluded. For patients with multiple encounters, a single visit was randomly selected for inclusion in the dataset (Figure 1).
Figure 1. Patient Selection Diagram.

represents the selection process. The initial 1,704 patient visits were selected by discharge diagnoses and by flagging patients with orders for blood cultures, urine cultures, or broad-spectrum IV antibiotic within 12 hours of arrival. A single visit was randomly selected for patients with multiple encounters/admissions during the study time period. Abbreviations and definitions. ED = Emergency Department; DNR = Do Not Resuscitate; Cath Lab = Heart Catheterization Lab; LVAD = Left Ventricular Assist Device; LA = Lactic acid.
Statistical Analysis:
Analyses were performed using Stata 15 (StataCorp., College Station, TX). Demographics and other characteristics were summarized using means and standard deviations, medians and interquartile ranges, or frequency counts and percentages. Group differences in Table 1 were assessed using ANOVA, Chi-square, and independent-samples median tests, as appropriate. Logistic regression was used to examine the relationship between not reaching fluid goals and outcomes, and all models included MEDS score, age, sex, time to antibiotics, initial lactic acid level, BMI category, end-stage renal disease, and heart failure. ICU length of stay was analyzed using the pseudo-observation approach with a linear regression model.14 Differences in the effect of not reaching fluid goals across BMI subgroups were assessed by fitting a model including covariate by BMI group interactions. For further examination of dose effects, plots were generated based on average predicted values from models including dose and dosê2. Statistical significance was defined as p< 0.05.
Table 1.
Clinical Measurements for Selected BMI-based Categories
| Total | Underweight | Normal -Overweight | Obese | p | |
|---|---|---|---|---|---|
| Total Patients | 1,032 | 105 | 631 | 296 | |
| Demographics | |||||
| Age (years), mean±SD | 63.4 ± 17.0 | 65.1 ± 18.1 | 64.8 ± 17.5 | 59.6 ± 14.9 | <0.001 |
| Male sex, n(%) | 510 (49.4) | 57 (54.3) | 333 (52.8) | 120 (40.5) | 0.001 |
| Body Mass Index (kg/m2), mean±SD | 27.2 ± 8.8 | 16.6 ± 1.6 | 24.0 ± 3.0 | 37.9 ± 8.7 | <0.001 |
| MEDS Score, mean±SD | 10.6 ± 4.7 | 11.6 ± 4.8 | 11.0 ± 4.6 | 9.4 ± 4.5 | <0.001 |
| Time to diagnosis (hr), mean±SD | 1.7 ± 1.5 | 1.3 ± 1.3 | 1.6 ± 1.5 | 1.8 ± 1.6 | 0.015 |
| Special Populations, n(%) | |||||
| Elderly | 488 (47.3) | 55 (52.4) | 324 (51.3) | 109 (36.8) | <0.001 |
| History of End-Stage Renal Disease | 101 (9.8) | 9 (8.6) | 61 (9.7) | 31 (10.5) | 0.84 |
| History of Heart Failure | 245 (23.7) | 20 (19.0) | 137 (21.7) | 88 (29.7) | 0.014 |
| “Overload” | 208 (20.2) | 9 (8.6) | 112 (17.7) | 87 (29.4) | <0.001 |
| Septic Shock | 653 (63.3) | 71 (67.6) | 413 (65.5) | 169 (57.1) | 0.030 |
| Hospital Metrics | |||||
| Emergency Department LOS (hr) mean±SD | 9.4 ± 4.7 | 9.1 ± 4.2 | 9.4 ± 4.7 | 9.6 ± 4.8 | 0.64 |
| ICU admission, n(%) | 606 (58.7) | 60 (57.1) | 380 (60.2) | 166 (56.1) | 0.46 |
| ICU LOS (days), mean±SD | 2.6 ± 4.3 | 2.5 ± 4.5 | 2.6 ± 4.2 | 2.7 ± 4.6 | 0.89 |
| Hospital LOS (days), mean±SD | 9.9 ± 9.4 | 8.9 ± 6.9 | 9.9 ± 9.5 | 10.4 ± 9.7 | 0.35 |
| Mortality, n(%) | 176 (17.1) | 21 (20.0) | 113 (17.9) | 42 (14.2) | 0.26 |
| Severe sepsis (% of severe group) | 43 (11.3) | 2 (5.9) | 33 (15.1) | 8 (6.3) | 0.03 |
| Shock (% of shock group) | 133 (20.4) | 19 (26.8) | 80 (19.4) | 34 (20.1) | 0.36 |
| Sepsis Parameters | |||||
| ≥ SIRS, n(%) | 881 (85.4) | 91 (86.7) | 539 (85.4) | 250 (84.5) | 0.84 |
| ≥ 2 qSOFA, n(%) | 345 (33.4) | 45 (42.9) | 207 (32.8) | 93 (31.4) | 0.09 |
| Volume IVF (L) at 3 hours, median (IQR) | 2.0 (1.0–2.0) | 2.0 (1.4–3.0) | 2.0 (1.0–3.0) | 2.0 (1.0–3.0) | 0.22 |
| Volume IVF (mL) at 3 hours, mean±SD | 2089 ± 1284 | 2111 ± 1170 | 2148 ± 1284 | 1818 ± 1299 | 0.001 |
| 30by3 by Actual Body Weight, n(%) | 509 (49.3) | 84 (80.0) | 356 (56.4) | 69 (23.3) | <0.001 |
| 30by3 by Ideal Body Weight, n(%) | 550 (53.3) | 55 (52.4) | 359 (56.9) | 136 (46.0) | 0.008 |
| IVF (mL/kg) at 3 hours, median (IQR) | 28.1 (13.3–38.9) | 40.1 (30.0–54.8) | 30.0 (17.0–42.0) | 16.5 (6.9–27.9) | <0.001 |
| IVF (mL/kg) at 3 hours for 30by3 vs. 30after3, median | 41.7 vs 15.2 | 49.7 vs 20.0 | 42.0 vs 17.0 | 35.1 vs 11.9 | N/A |
| Mean arterial pressure (mmHg), median (IQR) | 79.5 (66.7–95) | 75.0 (61.7–89.7) | 79.3 (67.1–95.0) | 82.0 (67.3–99.0) | 0.17 |
| Lactate, mmol/L, mean±SD | 3.5 ± 2.7 | 3.7 ± 2.4 | 3.6 ± 2.8 | 3.1 ± 2.2 | 0.015 |
| Time to antibiotics (hr), mean±SD | 1.3 ± 3.3 | 1.5 ± 6.2 | 1.2 ± 2.8 | 1.3 ± 2.7 | 0.59 |
| Intubation, n(%) | 158 (15.3) | 10 (9.5) | 99 (15.7) | 49 (16.6) | 0.21 |
| Vasopressor, n(%) | 215 (20.8) | 24 (22.9) | 129 (20.4) | 62 (20.9) | 0.85 |
| Positive blood cultures, n(%) | 325 (31.5) | 29 (27.6) | 188 (29.8) | 108 (36.5) | 0.082 |
| Sepsis Source, n(%) | |||||
| Pneumonia | 313 (30.3) | 39 (37.1) | 208 (33.0) | 66 (22.3) | 0.001 |
| Genitourinary | 248 (24.0) | 24 (22.9) | 138 (21.9) | 86 (29.1) | 0.055 |
| Abdominal | 151 (14.6) | 14 (13.3) | 95 (15.1) | 42 (14.2) | 0.87 |
| Skin/soft tissue | 143 (13.9) | 10 (9.5) | 79 (12.5) | 54 (18.2) | 0.025 |
| Indwelling IV catheter | 53 (5.1) | 5 (4.8) | 32 (5.1) | 16 (5.4) | 0.96 |
| Other/unknown | 124 (12.0) | 13 (12.4) | 79 (12.5) | 32 (10.8) | 0.75 |
Table 1describes the study cohort, separated by body mass index (BMI). Underweight represents BMI <18.5 kg/m2. Normal represents 18.5 ≤ BMI <30.0 kg/m2. Obese represents BMI ≥30 kg/m2. Legend: MEDS = mortality in emergency department sepsis, LOS = length of stay, ICU = intensive care unit, SIRS = systemic inflammatory response syndrome (defined in Supplementary 2), qSOFA = quick sequential organ failure assessment (defined in Supplementary 2). IVF = intravenous fluids, IQR = interquartile range. Statistical significance defined as p < 0.05.
Results
Demographics and Sepsis Metric Measurements:
Of the 1,032 patient visits, 105 (10.2%) were underweight, 631 (61.1%) were of normal/overweight, and 296 (28.7%) were obese. ABW vs. IBW-30by3 dosing was reached in 80.0 vs. 52.4% (underweight), 56.4 vs. 56.9% (normal-overweight), and 23.3 vs. 46.0% (obese). The study population demographics are highlighted in Table 1 and Supplementary Table 1.
Dose-Effect Curves:
Figure 2 shows an exponential increase in mortality for each 5 mL/kg under 30by3 using both ABW and IBW-dosing of fluids for underweight patients (p=0.02 for both). The dose-effect curves for the normal/overweight and obesity groups do not reach statistical significance.
Figure 2. ABW and IBW dose-effect curves.

shows dose-effect curves for the underweight (UW), normal/overweight (NW/OW), and obese (OB) BMI-based groups for the actual body weight (ABW) dosing (left plot) and ideal body weight (IBW) dosing (right plot, For the ABW curves, p= 0.02, 0.16, and 0.64 for UW, NW/OW, and OB, respectively. For the IBW curves, p= 0.02, 0.11, and 0.44 for UW, NW/OW, and OB, respectively. Plots were generated based on average predicted values from models including dose and dosê2 in addition to adjusting for MEDS score, age, sex, time to antibiotics, initial lactic acid level, end-stage renal disease, and heart failure.
Impact IBW/ABW Dosing on Mortality:
Figure 3 shows covariate-adjusted mortality estimates for underweight, normal/overweight, and obese patients both receiving and not receiving 30by3, based on actual body weight and ideal body weight dosing. Covariate-adjusted mortality estimates (SE) presented as reaching vs. not reaching 30by3 include: underweight: ABW-dosing=16 (3) vs. 35 (8)%, IBW-dosing =16 (4) vs 25 (5)%; obese: ABW-dosing=10 (3) vs 18 (3)%, IBW-dosing=15 (3) vs 17 (3)%. Table 2 and Table 3 lists the results of all regressions, including secondary outcomes listed below. Overall, there was increased mortality for patients not reaching actual body weight-based 30by3 dosing (OR 1.78, 95% CI 1.18–2.69), with an attenuated impact that does not reach significance for ideal body weight (OR 1.28, 95% CI 0.87–1.91). The increased mortality for failing to reach actual body weight-dosed 30by3 remained for underweight patients but not obese patients.
Figure 3. Adjusted mortality estimates by BMI category.
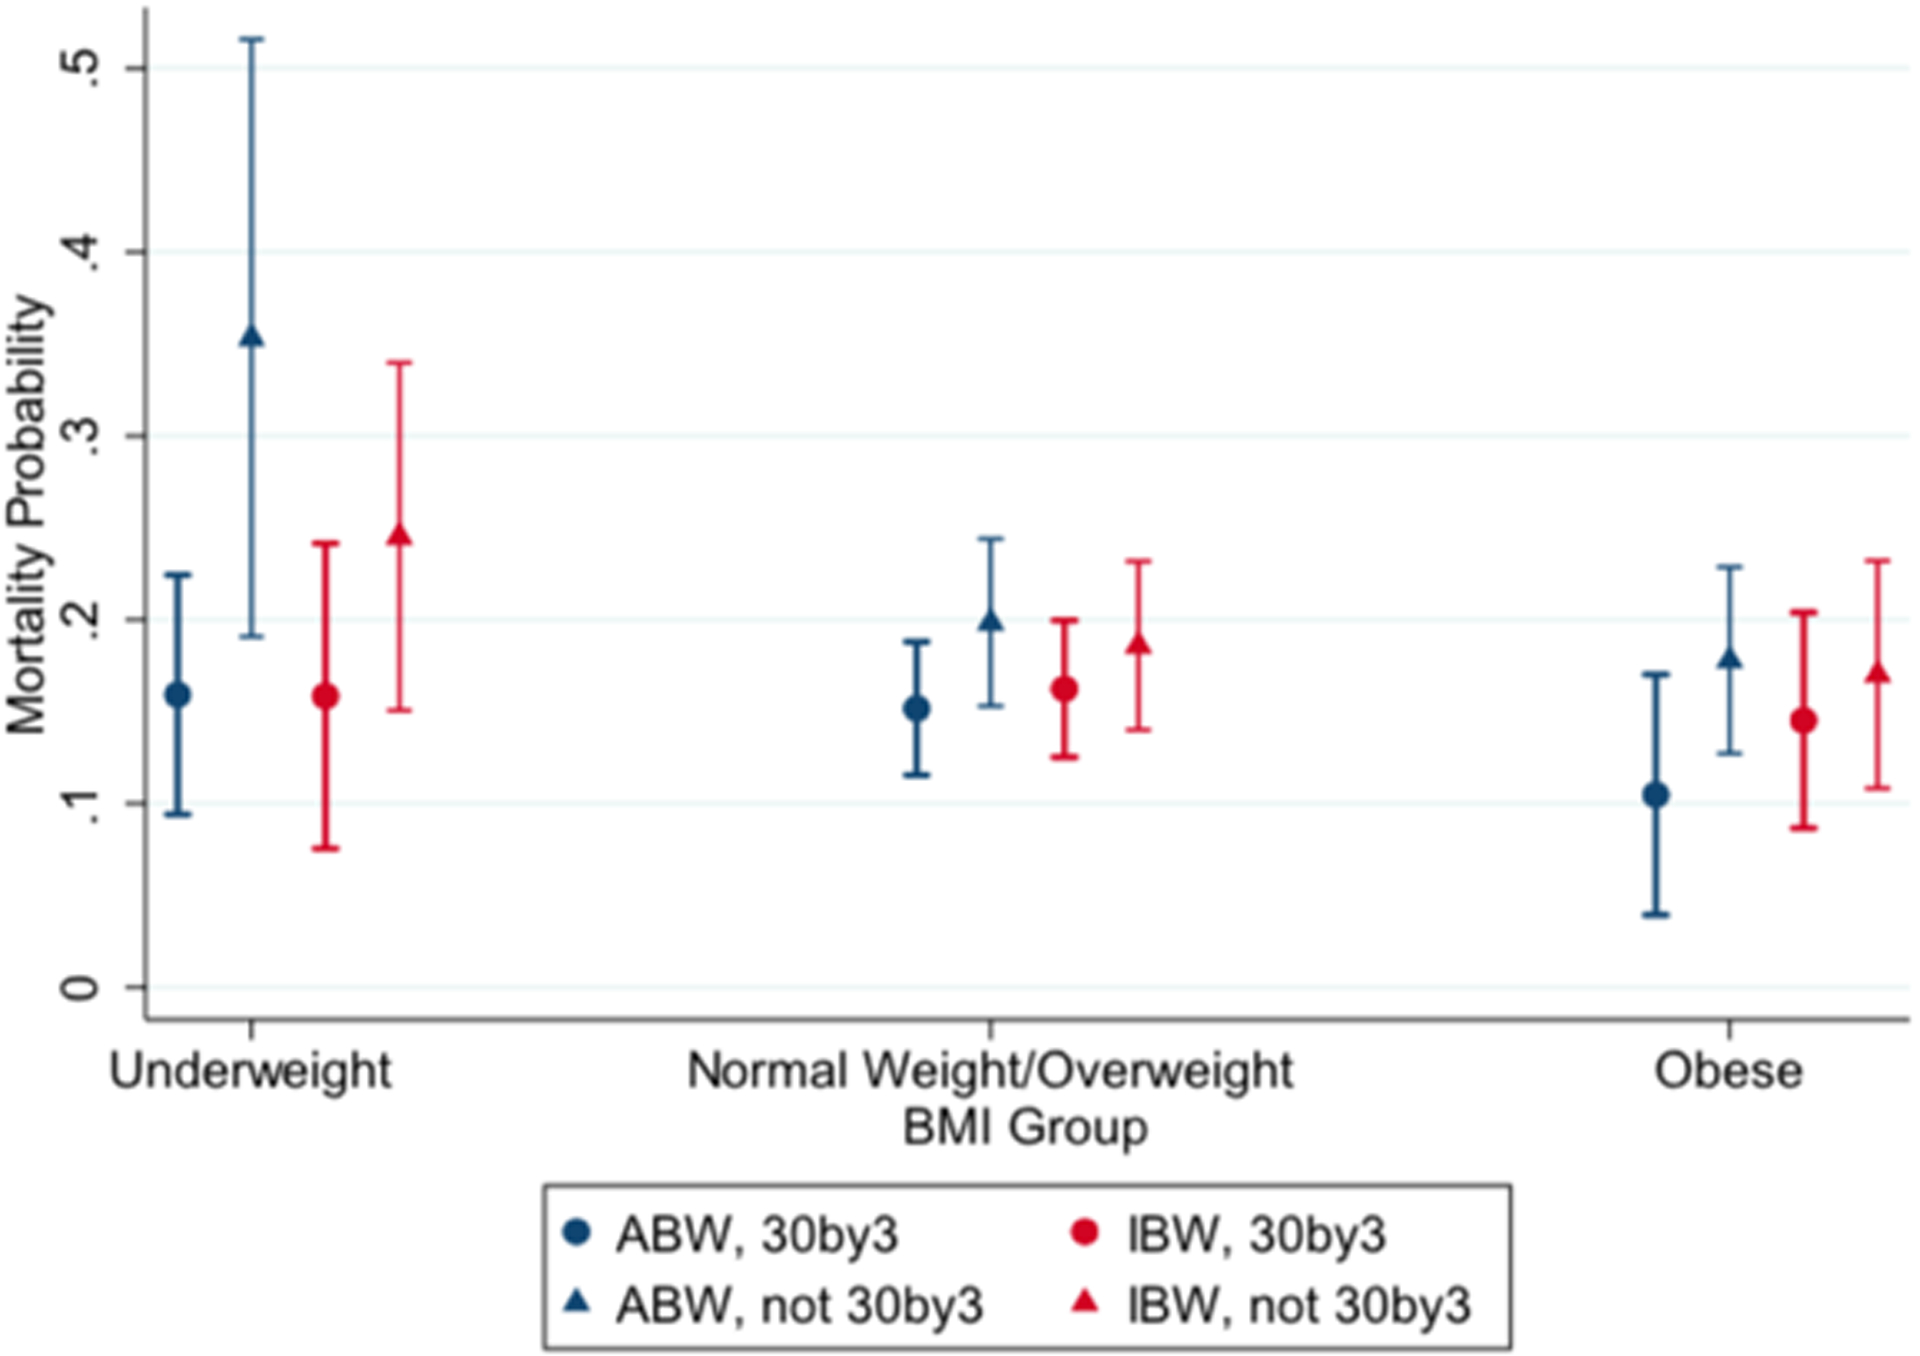
shows covariate-adjusted mortality estimates for the underweight, normal/overweight, and obese BMI-based groups. These estimates controlled for MEDS score, age, sex, time to antibiotics, initial lactic acid level, end-stage renal disease, and heart failure. Reaching vs. failing to reach 30 mL/kg within the first three hours of sepsis onset include: underweight: ABW-dosing=16 (3) vs. 35 (8)%, IBW-dosing = 16 (4) vs 25 (5)%; obese: ABW-dosing=10 (3) vs 18 (3)%, IBW-dosing=15(3) vs 17 (3)%.
Table 2.
Regression analyses evaluating impact of not receiving 30 mL/kg by three hours
| ABW | IBW | ABW | IBW | ABW | IBW | ABW | IBW | ABW | IBW | |
|---|---|---|---|---|---|---|---|---|---|---|
| OR (95% CI) | OR (95% CI) | OR (95% CI) | β (95% CI) | OR (95% CI) | ||||||
| Failed 30by3 | 1.78 (1.18–2.69) | 1.28 (0.87–1.91) | 0.94 (0.69–1.29) | 1.00 (0.74–1.35) | 0.76 (0.55–1.05) | 0.73 (0.54–0.99) | 2.40 (0.84–3.95) | 1.58 (0.07–3.08) | 1.26 (0.79–1.99) | 0.87 (0.56–1.36) |
| MEDS | 1.16 (1.12–1.21) | 1.16 (1.12–1.21) | 1.13 (1.09–1.17) | 1.13 (1.09–1.17) | 1.12 (1.08–1.16) | 1.12 (1.08–1.16) | 0.22 (0.06–0.38) | 0.22 (0.07–0.38) | 1.05 (1.00–1.10) | 1.05 (1.00–1.09) |
| Time to Abx | 1.02 (0.97–1.07) | 1.02 (0.97–1.07) | 1.02 (0.98–1.07) | 1.02 (0.98–1.07) | 1.00 (0.96–1.05) | 1.01 (0.96–1.05) | 0.02 (−0.24–0.27) | 0.05 (−0.20–0.30) | 1.00 (0.95–1.06) | 1.01 (0.96–1.07) |
| Lactate | 1.18 (1.12–1.25) | 1.17 (1.11–1.24) | 0.99 (0.94–1.04) | 0.99 (0.94–1.04) | 1.40 (1.28–1.54) | 1.40 (1.28–1.53) | 0.19 (−0.02–0.40) | 0.18 (−0.03–0.39) | 1.27 (1.19–1.36) | 1.26 (1.18–1.35) |
| Age | 1.00 (0.99–1.02) | 1.01 (0.99–1.02) | 0.99 (0.98–1.00) | 0.99 (0.98–1.00) | 0.99 (0.98–1.00) | 0.99 (0.98–1.00) | −0.03 (−0.07–0.02) | −0.03 (−0.07–0.02) | 0.99 (0.98–1.00) | 0.99 (0.98–1.00) |
| Male sex | 0.60 (0.41–0.86) | 0.60 (0.41–0.86) | 0.76 (0.58–1.00) | 0.76 (0.57–1.00) | 0.89 (0.67–1.18) | 0.92 (0.70–1.23) | −0.76 (−2.09–0.57) | −0.78 (−2.13–0.57) | 1.06 (0.71–1.58) | 1.11 (0.74–1.67) |
| UW | 1.11 (0.61–2.02) | 1.01 (0.56–1.81) | 0.72 (0.45–1.14) | 0.72 (0.46–1.15) | 0.63 (0.39–1.02) | 0.67 (0.41–1.08) | 1.41 (−0.90–3.73) | 1.00 (−1.33–3.32) | 0.62 (0.27–1.41) | 0.60 (0.26–1.36) |
| OW | 0.83 (0.52–1.33) | 0.93 (0.59–1.48) | 1.07 (0.75–1.52) | 1.05 (0.74–1.50) | 0.78 (0.54–1.12) | 0.73 (0.51–1.05) | 0.36 (−1.37–2.09) | 0.76 (−0.95–2.47) | 1.12 (0.66–1.90) | 1.17 (0.70–1.98) |
| Obese | 0.74 (0.45–1.20) | 0.89 (0.56–1.41) | 1.04 (0.73–1.50) | 1.02 (0.72–1.44) | 1.01 (0.70–1.47) | 0.94 (0.66–1.33) | −0.02 (−1.78–1.73) | 0.75 (−0.92–2.41) | 1.51 (0.90–2.55) | 1.68 (1.03–2.74) |
| ESRD | 1.30 (0.72–2.35) | 1.40 (0.77–2.55) | 1.72 (1.03–2.87) | 1.69 (1.01–2.83) | 1.45 (0.89–2.35) | 1.49 (0.92–2.43) | 0.67 (−1.53–2.87) | 0.81 (−1.42–3.03) | 0.76 (0.37–1.59) | 0.86 (0.41–1.81) |
| HF | 1.33 (0.89–1.99) | 1.40 (0.94–2.11) | 1.71 (1.21–2.43) | 1.69 (1.19–2.40) | 2.03 (1.43–2.88) | 2.08 (1.46–2.97) | 0.38 (−1.17–1.93) | 0.55 (−1.02–2.11) | 1.00 (0.61–1.62) | 1.07 (0.66–1.76) |
Table 2. Multivariate regression analyses for mortality, delayed hypotension, ICU admission, ICU LOS, and intubation. The table shows the impact of not receiving 30 mL/kg compared to receiving 30 mL/kg among of other controller variables listed. Reference group for BMI categories is normal weight.
Table 3.
Impact of not receiving 30 mL/kg by three hours based on dosing strategy
| ABW | IBW | ABW | IBW | |
|---|---|---|---|---|
| OR (95% CI) | OR (95% CI) | |||
| Mortality† | 5.82 (1.32–25.57) | 2.41 (0.64–9.09) | 2.20 (0.81–5.99) | 1.27 (0.54–2.96) |
| ICU Admit | 1.13 (0.36–3.53) | 1.24 (0.48–3.22) | 0.59 (0.31–1.12) | 0.51 (0.29–0.92) |
| ICU LOS† | 7.47 (1.85–13.1) | 0.96 (−3.86–5.79) | 3.33 (0.25–6.41) | 3.22 (0.27–6.17) |
| Intubation† | 3.23 (0.24–44.2) | 1.53 (0.16–14.4) | 2.88 (1.06–7.78) | 1.42 (0.64–3.16) |
| Delayed Hypotension | 0.76 (0.27–2.17) | 0.94 (0.38–2.32) | 0.83 (0.43–1.59) | 0.91 (0.50–1.64) |
Table 3. Multivariate regression analyses evaluating the impact of not receiving 30 mL/kg within three hours compared receiving 30 mL/kg within three hours of arrival. Italicized values represent a significant observation for p<0.05.
ICU stay was performed using a pseudo-observation approach with linear regression and thus numbers represent β instead of OR for the other rows.
ICU Admission and Length of Stay:
Not receiving 30by3 was associated with longer ICU stays for actual body weight dosing (~mean 2 days; β=2.40, 95% CI 0.84–3.95) versus ideal body weight dosing (~mean 1.5 days; β=1.58, 95% CI 0.07–3.08). Not receiving 30by3 by actual body weight dosing was associated with longer ICU stays for underweight patients (β=7.47, 95% CI 1.85–13.1), with no impact based on ideal body weight dosing. Obese patients had longer ICU stays based both on actual body weight (β=3.33, 95% CI 0.25–6.41) and ideal body weight-based fluid dosing (β=3.22, 95% CI 0.27–6.17). Actual body weight dosing was not associated with odds of ICU admission, regardless of body mass index.
Intubation and Delayed Hypotension:
Neither actual body weight nor ideal body weight-30by3 dosing were associated with intubation overall. Obese patients not receiving 30by3-actual body weight dosing had increased odds of intubation (OR 2.88, 95% CI 1.06–7.78). Delayed hypotension was not impacted by actual body weight or ideal body weight dosing nor by individual BMI-based body types.
Discussion
Our study highlights that fluid dosing may have important impacts on mortality for patients with severe sepsis or septic shock and seems to be dependent on a patient’s BMI-based category. Failure to reach 30by3 for actual body weight-based dosing was associated with increased mortality for underweight, but not obese patients, likely based on significant differences observed in our dose-effect curves. Figure 2 shows that underweight individuals have an observed exponential increase in mortality for each 5 mL/kg under the recommended 30by3. In underweight patients, fluid volumes based on actual body weight are less than ideal body weight; thus, we see an exponential, amplified, deleterious effect of not reaching 30by3, as seen in Figures 2 and 3. Additionally, we observed much longer ICU stays (~7.5 days) for underweight individuals not reaching actual body weight-based 30by3 dosing. Taken together, there may be very significant harms in failing to reach current guideline-based fluid goals in the early resuscitation of underweight patients with severe sepsis or septic shock. Adherence to current fluid resuscitation guidelines are recommended by the SSC (i.e., 30mL/kg in the first three hours of resuscitation).
If the inverse interpretation of our analyses of underweight individuals is considered, one may conclude there is only a survival benefit when receiving 30by3 based on actual body weight dosing. This interpretation may be accurate statistically but may falsely suggest harm to underweight individuals receiving higher fluid volumes based on ideal body weight dosing, as the survival benefit would no longer be observed. Therefore, we chose to present the data in terms of mortality risk in failure to receive 30by3. We believe our data highlights the risks of underdosing of fluids in underweight patients, as shown in Figures 2 and 3. We have observed a potential plateau in the dose-effect curves, beginning around 30 mL/kg, and note similar mortality estimates for reaching 30by3 for actual body weight (16 ±3%) and ideal body weight dosing (16 ±4%). Physiologically, it may be possible that underweight individuals benefit from higher weight-based fluid dosing relative to obese patients, given adipose tissue possesses significantly less blood volume relative to lean body mass.8 Figure 2 may support this concept, as it appears underweight individuals may be much more sensitive to fluid dosing. The statistical power for analyses within our underweight cohort may limit observations for potential benefits or harms of higher fluid dosing; additional studies evaluating this are needed.
Additionally, it is possible that the cohort of underweight patients is an inherently sicker population, and that the underweight body type may represent a poor nutritional status in a patient with a relatively poor reserve. The underweight patients in this cohort were older, had higher MEDS scores, lactate levels, and rates of septic shock and pneumonia when compared to obese patients. Although we attempted to control for these factors, this may make underweight patients more susceptible to the deleterious effects of receiving lower volumes of fluids.
Adequate and timely fluid resuscitation is a mainstay for the treatment of sepsis,1,15–21 but the definition of adequacy is controversial,22–24 with recent modifications by CMS allowing for ideal body weight fluid dosing for obese patients in the absence of robust evidence.4 Our study does not support, nor contradict, the allowance made by CMS for obese patients (i.e., mortality estimates for reaching 30by3 = 15 (3) vs 10 (3)% for ideal vs actual body weight dosing). Taken together with existing evidence, we are concerned that resuscitative strategies that allow for dosing of 30by3 based on ideal body weight (i.e., less fluids in obese patients), has the potential for unintended deleterious consequences in obese patients.6,7
Previous studies have shown improved survival for obese patients relative to nonobese patients, despite receiving lower amounts of weight-based fluid.2,3 However, these studies are merely descriptive and do not assess differences in outcomes between obese vs. nonobese individuals nor evaluate for potential dose effects for fluid resuscitation. Further, Taylor et. al claims a potential survival benefit with adjusted body weight-based dosing in obese patients. Adjusted body weight dosing in an obese patient would mean a lower fluid volume compared to traditional actual body weight dosing, but higher fluid volume than ideal body weight dosing, suggesting a U-shaped, dose-effect curve. They show a survival benefit with adjusted body weight based fluid dosing vs. the ideal body weight-dosing strategy (OR 0.29, 95% CI 0.11–0.79). However, when compared adjusted and actual body-weight dosing, the odds ratio does seem to favor adjusted body weight, but the benefit is attenuated and lacks statistical significance (OR 0.45, 95% CI 0.19–1.07). In fact, actual body weight was not compared to ideal body weight directly; thus, one may deduce improved survival with actual vs ideal body weight-based dosing based on these findings. Additionally, the adjusted body weight group made up only 8.8% of their cohort, which may increase the risk for sampling bias.5
We have previously observed improved survival when reaching 30by3 using actual body weight dosing, without any noted differential effects of obesity; however, this current analysis does not show an impact specifically for obese patients. The inclusion of severe sepsis may partly account for this, as we have previously observed no impact of reaching 30by3 in this group, despite attempting to control for disease severity. Further, although we did not show any mortality impact in failing to achieve 30by3 in obese patients (by either dosing strategy), there was increased odds for prolonged ICU LOS for both actual and ideal body weight-based dosing, and increased odds for intubation in obese patients who fail to achieve 30by3 when dosed by actual body weight. Obesity is a well-known risk factor for restrictive lung disease causing mechanical compression of the chest cavity, diaphragm, and lungs.25 As such, it is possible that with under-resuscitation, an obese patient may be less equipped to mount a respiratory compensation to a metabolic acidosis. How specific dosing strategies impacts these secondary findings is more difficult to interpret but does highlight the potential harmful effects of under-resuscitation. Lastly, a phenomenon exists in which the median fluid volume remains two liters across all BMI groups. This standard dosing may highlight a ‘one-size-fits-all’ mindset, in which providers do not necessarily account for different body sizes, and is reflected in the median dosing for underweight (40.1 mL/kg) and obese (16.5 mL/kg) patients. This disparity may also provide interesting differences when comparing varying fluid doses across degrees of obesity; however, a larger cohort would be required to provide more meaningful results.
Limitations
There are several important limitations of this study. First, these findings may not be generalizable given that the study was from a single, urban, academic center. Next, the retrospective nature of this study may contribute to unanticipated or unrecognized relationships and limited our ability to control for all confounders. Causal inference would require validation through prospective, randomized trials. Further, fluid timing was determined using the electronic medical chart’s Medication Administration Record (MAR). Therefore, if fluid completion time was not charted, we assumed one liter of fluid was administered over one hour. Next, neither the physician identifying sepsis cases nor abstractors were blinded to the purpose of the study which may bias the data. However, cases were selected prospectively and were initially intended for quality improvement purposes. More specifically, our population was selected prospectively as part of a CMS-driven, quality-based initiative using Sepsis-2 criteria, which may differ from more recent analyses or miss atypical presentations.7 Finally, the underweight group had higher mortality, rates of shock, MEDS score, and pneumonia (among others) relative to the obese group. While we did attempt to control for confounding variables, there are likely inherent differences between the groups we could not account for.
Conclusions
An exponential, dose-effect increase in mortality was observed for underweight patients with severe sepsis or septic shock not receiving 30by3, regardless of fluid dosing by ideal or actual body weight. However, the mortality impact of under-dosing fluids may be amplified if using the actual body weight compared to ideal body weight for underweight patients. We did not observe a dose-effect of fluids on mortality for obese patients. However, obese patients receiving less than 30by3 were associated with longer ICU stays and increased odds of intubation, specifically based on actual body weight dosing. Therefore, we caution against the CMS allowance for ideal body weight dosing for obese patients or any deviation from existing SSC guidelines without further studies.
Supplementary Material
Acknowledgements:
A special thanks to Dave P. Liedke and Chad Evans for their support with this project.
Funding:
This project was supported by the National Center for Advancing Translational Sciences (NCATS) of the National Institutes of Health (NIH) through Grant Number 5UL1TR002389–02 that funds the Institute for Translational Medicine (ITM). The content is solely the responsibility of the authors and does not necessarily represent the official views of the NIH.
Footnotes
Declaration of Conflicting Interests: The authors have no potential conflicts of interest to report.
References
- 1.Rhodes A, Evans LE, Alhazzani W, et al. Surviving Sepsis Campaign: International Guidelines for Management of Sepsis and Septic Shock: 2016. Intensive Care Med. 2017;43(3):304–377. doi: 10.1007/s00134-017-4683-6 [DOI] [PubMed] [Google Scholar]
- 2.Wacharasint P, Boyd JH, Russell JA, Walley KR. One size does not fit all in severe infection: obesity alters outcome, susceptibility, treatment, and inflammatory response. Crit Care Lond Engl. 2013;17(3):R122. doi: 10.1186/cc12794 [DOI] [PMC free article] [PubMed] [Google Scholar]
- 3.Arabi YM, Dara SI, Tamim HM, et al. Clinical characteristics, sepsis interventions and outcomes in the obese patients with septic shock: an international multicenter cohort study. Crit Care Lond Engl. 2013;17(2):R72. doi: 10.1186/cc12680 [DOI] [PMC free article] [PubMed] [Google Scholar]
- 4.National Hospital Inpatient Quality Reporting Measures Specifications Manual Release Notes. Published online June 14, 2018. Accessed February 1, 2020. National Hospital Inpatient Quality Reporting Measures Specifications Manual Release Notes
- 5.Taylor SP, Karvetski CH, Templin MA, Heffner AC, Taylor BT. Initial fluid resuscitation following adjusted body weight dosing is associated with improved mortality in obese patients with suspected septic shock. J Crit Care. 2018;43:7–12. doi: 10.1016/j.jcrc.2017.08.025 [DOI] [PubMed] [Google Scholar]
- 6.Liu VX, Morehouse JW, Marelich GP, et al. Multicenter Implementation of a Treatment Bundle for Patients with Sepsis and Intermediate Lactate Values. Am J Respir Crit Care Med. 2016;193(11):1264–1270. doi: 10.1164/rccm.201507-1489OC [DOI] [PMC free article] [PubMed] [Google Scholar]
- 7.Kuttab HI, Lykins JD, Hughes MD, et al. Evaluation and Predictors of Fluid Resuscitation in Patients With Severe Sepsis and Septic Shock. Crit Care Med. 2019;47(11):1582–1590. doi: 10.1097/CCM.0000000000003960 [DOI] [PMC free article] [PubMed] [Google Scholar]
- 8.Feldschuh J, Enson Y. Prediction of the normal blood volume. Relation of blood volume to body habitus. Circulation. 1977;56(4 Pt 1):605–612. doi: 10.1161/01.cir.56.4.605 [DOI] [PubMed] [Google Scholar]
- 9.von Elm E, Altman DG, Egger M, et al. The Strengthening the Reporting of Observational Studies in Epidemiology (STROBE) statement: guidelines for reporting observational studies. Lancet Lond Engl. 2007;370(9596):1453–1457. doi: 10.1016/S0140-6736(07)61602-X [DOI] [PubMed] [Google Scholar]
- 10.Levy MM, Fink MP, Marshall JC, et al. 2001 SCCM/ESICM/ACCP/ATS/SIS International Sepsis Definitions Conference. Crit Care Med. 2003;31(4):1250–1256. doi: 10.1097/01.CCM.0000050454.01978.3B [DOI] [PubMed] [Google Scholar]
- 11.Devine BJ Gentamicin therapy. Drug Intell Clin Pharm. 8:650–655. [Google Scholar]
- 12.Weir CB, Jan A. BMI Classification Percentile And Cut Off Points. In: StatPearls. StatPearls Publishing; 2020. Accessed April 23, 2020. http://www.ncbi.nlm.nih.gov/books/NBK541070/ [PubMed] [Google Scholar]
- 13.Shapiro NI, Wolfe RE, Moore RB, Smith E, Burdick E, Bates DW. Mortality in Emergency Department Sepsis (MEDS) score: a prospectively derived and validated clinical prediction rule. Crit Care Med. 2003;31(3):670–675. doi: 10.1097/01.CCM.0000054867.01688.D1 [DOI] [PubMed] [Google Scholar]
- 14.Andersen PK, Syriopoulou E, Parner ET. Causal inference in survival analysis using pseudo-observations. Stat Med. 2017;36(17):2669–2681. doi: 10.1002/sim.7297 [DOI] [PubMed] [Google Scholar]
- 15.Rivers E, Nguyen B, Havstad S, et al. Early goal-directed therapy in the treatment of severe sepsis and septic shock. N Engl J Med. 2001;345(19):1368–1377. doi: 10.1056/NEJMoa010307 [DOI] [PubMed] [Google Scholar]
- 16.ProCESS Investigators, Yealy DM, Kellum JA, et al. A randomized trial of protocol-based care for early septic shock. N Engl J Med. 2014;370(18):1683–1693. doi: 10.1056/NEJMoa1401602 [DOI] [PMC free article] [PubMed] [Google Scholar]
- 17.ARISE Investigators, ANZICS Clinical Trials Group, Peake SL, et al. Goal-directed resuscitation for patients with early septic shock. N Engl J Med. 2014;371(16):1496–1506. doi: 10.1056/NEJMoa1404380 [DOI] [PubMed] [Google Scholar]
- 18.Mouncey PR, Osborn TM, Power GS, et al. Trial of early, goal-directed resuscitation for septic shock. N Engl J Med. 2015;372(14):1301–1311. doi: 10.1056/NEJMoa1500896 [DOI] [PubMed] [Google Scholar]
- 19.Leisman D, Wie B, Doerfler M, et al. Association of Fluid Resuscitation Initiation Within 30 Minutes of Severe Sepsis and Septic Shock Recognition With Reduced Mortality and Length of Stay. Ann Emerg Med. 2016;68(3):298–311. doi: 10.1016/j.annemergmed.2016.02.044 [DOI] [PubMed] [Google Scholar]
- 20.Leisman DE, Doerfler ME, Schneider SM, Masick KD, D’Amore JA, D’Angelo JK. Predictors, Prevalence, and Outcomes of Early Crystalloid Responsiveness Among Initially Hypotensive Patients With Sepsis and Septic Shock. Crit Care Med. 2018;46(2):189–198. doi: 10.1097/CCM.0000000000002834 [DOI] [PubMed] [Google Scholar]
- 21.Leisman DE, Goldman C, Doerfler ME, et al. Patterns and Outcomes Associated With Timeliness of Initial Crystalloid Resuscitation in a Prospective Sepsis and Septic Shock Cohort. Crit Care Med. 2017;45(10):1596–1606. doi: 10.1097/CCM.0000000000002574 [DOI] [PubMed] [Google Scholar]
- 22.Boyd JH, Forbes J, Nakada T, Walley KR, Russell JA. Fluid resuscitation in septic shock: a positive fluid balance and elevated central venous pressure are associated with increased mortality. Crit Care Med. 2011;39(2):259–265. doi: 10.1097/CCM.0b013e3181feeb15 [DOI] [PubMed] [Google Scholar]
- 23.Marik PE, Linde-Zwirble WT, Bittner EA, Sahatjian J, Hansell D. Fluid administration in severe sepsis and septic shock, patterns and outcomes: an analysis of a large national database. Intensive Care Med. 2017;43(5):625–632. doi: 10.1007/s00134-016-4675-y [DOI] [PubMed] [Google Scholar]
- 24.Seymour CW, Gesten F, Prescott HC, et al. Time to Treatment and Mortality during Mandated Emergency Care for Sepsis. N Engl J Med. 2017;376(23):2235–2244. doi: 10.1056/NEJMoa1703058 [DOI] [PMC free article] [PubMed] [Google Scholar]
- 25.Poulain M, Doucet M, Major GC, et al. The effect of obesity on chronic respiratory diseases: pathophysiology and therapeutic strategies. CMAJ Can Med Assoc J J Assoc Medicale Can. 2006;174(9):1293–1299. doi: 10.1503/cmaj.051299 [DOI] [PMC free article] [PubMed] [Google Scholar]
Associated Data
This section collects any data citations, data availability statements, or supplementary materials included in this article.