Abstract
Pneumonia is one of the hazardous diseases that lead to life insecurity. It needs to be diagnosed at the initial stages to prevent a person from more damage and help them save their lives. Various techniques are used to identify pneumonia, including chest X-ray, blood culture, sputum culture, fluid sample, bronchoscopy, and pulse oximetry. Chest X-ray is the most widely used method to diagnose pneumonia and is considered one of the most reliable approaches. To analyse chest X-ray images accurately, an expert radiologist needs expertise and experience in the desired domain. However, human-assisted approaches have some drawbacks: expert availability, treatment cost, availability of diagnostic tools, etc. Hence, the need for an intelligent and automated system comes into place that operates on chest X-ray images and diagnoses pneumonia. The primary purpose of technology is to develop algorithms and tools that assist humans and make their lives easier. This study proposes a scalable and interpretable deep convolutional neural network (DCNN) to identify pneumonia using chest X-ray images. The proposed modified DCNN model first extracts useful features from the images and then classifies them into normal and pneumonia classes. The proposed system has been trained and tested on chest X-ray images dataset. Various performance metrics have been utilized to inspect the stability and efficacy of the proposed model. The experimental result shows that the proposed model's performance is greater compared to the other state-of-the-art methodologies used to identify pneumonia.
Keywords: Deep learning, Pneumonia diagnosis, Classification, Convolutional neural network, Intelligent model
Introduction
Pneumonia is an infectious disease caused by viruses, germs, fungi, and bacteria. It inflames the lungs' air sacs, which can be extremely hazardous and life-intimidated if not identified at the early stages [1]. The lung infection then affects the pulmonary alveoli, which rapidly deteriorates the health conditions of a person. Pneumonia has numerous types, such as viral pneumonia, bacterial pneumonia, and mycoplasma pneumonia, among others. Bacteria or fungi cause bacterial pneumonia, while viral pneumonia occurs due to different viruses such as flu and is accountable for almost one-third of all pneumonia cases. Mycoplasma pneumonia, also called atypical pneumonia, is caused by a bacterium and generally affects people of all ages and is more dangerous for smokers, alcoholics, recent surgical patients, asthma, viral infected, and people with frail immune system. Viral pneumonia is considered extremely dangerous; one is at more risk of having bacterial pneumonia than when attacked by viral pneumonia. Pneumonia has various symptoms, including cough, fever, tiredness, heavy sweating, squatness of breath, chest pain, shivering, loss of appetite, confusion, and turning of nails and lips color blue. It is considered a harmful disease that may lead to death worldwide, particularly in China [2, 3].
In South Asia and Sub-Saharan, the death ratio due to this disease is very high. According to a report, in 2017, approximately 0.9 million people died from this disease. About one million people were detected as having pneumonia, and about 50 k people die from this disease in a country like United States (US) every year. The death ratio in Pakistan, India, Ethiopia, Nigeria, and the Republic of Congo was more than half of the deaths from childhood pneumonia and was called the ultimate disease of poverty [4]. In Portugal, after lung cancer, the second leading cause of mortality is pneumonia, leading people to face a respiration problem [5]. In Japan, pneumonia is one of the top three deadliest diseases where the number of deaths due to this disease is very high, especially in old age people having age above 75 [6]. Pneumonia is a curable disease and does not spread from one country to another; its transmission is generally across local communities and controlled through basic health measures [7]. It can be controlled by washing the hands regularly, proper exercise, proper and enough sleep, avoiding smoking, using more vegetables and the right food, etc.
Pneumonia is deliberated one of the lethal diseases and the leading cause of mortality for children and older people worldwide. Different techniques are used to identify pneumonia, including pulse oximetry, bronchoscopy, sputum culture, blood culture, and chest X-ray images. Chest X-ray is an essential and most widely used technique for the identification of pneumonia across the globe. There is a need for an expert radiologist who possesses experience in the desired domain to study the X-ray images accurately and effectively. According to a report, still, two-third of the world population does not have access to the radiologist. The method of detecting pneumonia by studying X-ray images can also be timewasting and less precise. One of the reasons for this is that many other medical disorders such as lung cancer shows the same opaqueness in images. Hence, precise and reliable reading of these images is extremely necessary. The influence of computation models is recognized worldwide. Creating a diagnosis model for identifying the causes of pneumonia in clinical images can help interpret X-ray images accurately and effectively.
Medical image analysis plays a significant part in diagnosing various diseases like MERS, Covid-19, pneumonia, etc., and is considered one of the promising approaches. Therefore, to identify pneumonia, chest x-ray images are utilized by various medical consultants. Accurate and effective X-ray image examination is considered to be a critical task for radiologists. Different scientists have proposed various algorithms for the analysis of X-ray images [8, 9]. Various researchers have developed different computer-assisted diagnostic tools to provide insights into the X-ray images [10–12]. However, these tools and techniques fail to supply appropriate information about medical images to the physicians to decide. Machine Learning (ML) is playing a significant role in identifying various diseases [13]. An ample amount of work has been done to diagnose the lungs and chest disorders using these approaches. Though the ML approaches showed good performance, it fails to achieve high accuracy, low error rate, and low computation power. Deep Learning (DL) had already proved its significance in terms of higher accuracy and is being used for various purposes like text classification, image classification, object detection, segmentation, etc. Deep learning has also shown the ability for target recognition and segmentation in medical image processing, such as radiology image analysis, to analyse biological or abnormal configurations of the human body [14–16]. Besides, deep learning approaches and algorithms give higher accuracy compared to conventional state-of-the-art ML algorithms and techniques.
This study proposes a novel Deep Convolution Neural Network (DCNN) DL framework to diagnose pneumonia disease efficiently and effectively to overcome the issues mentioned above. The proposed model has been trained and tested on chest X-ray and CT image dataset [17]. The performance of the proposed DL framework has been tested with the help of various performance metrics, namely; accuracy, sensitivity, specificity, error rate, and ROC curve. It is expected that the suggested system will assist medical practitioners in efficiently diagnosing pneumonia disease.
The remaining paper is structured as follows. Section 2 demonstrates the review of literature, Sect. 3 represents the methodology, and Sect. 4 illustrates the results and discussion. At last, Sect. 5 concludes our paper.
Review of literature
It remains a big challenge for the practitioners to identify and locate the cause of diseases in a reasonable period to minimize the patients' sufferings. Medical image analysis and DL algorithms have produced promising results. Liang et al. [18] proposed a DL framework for diagnosing childhood pneumonia and attained promising results. They trained and tested their proposed model on the image dataset. Ge et al. [19] investigated the prediction of pneumonia disease using ML and DL algorithms such as Support Vector Machine (SVM), Recurrent Neural Network (RNN), K-Nearest Neighbor (KNN), and Multilayer Perceptron (MLP). They attained good results in terms of accuracy, but over-fitting in their proposed approach degrades the efficiency of their work. Behzadi et al. [20] presented a method based on DL, specifically CNN, using chest x-rays images and produced good results in terms of accuracy. To increase the model's accuracy, they used a CNN pre-trained model on the ImageNet data. Also, they proposed a three-step preprocessing method to enhance the generality of the model. Their proposed model was good in terms of accuracy, but it takes a very long time in training.
Jaiswal et al. [21] proposed a DL procedure for diagnosing pneumonia using chest x-ray images data. Their proposed model was based on Mask-RCNN and achieved an accuracy of 91.02%, showing the robustness and effectiveness of the model. Kholiavchenko et al. [22] proposed a computerized system for the forecast of pneumonia on chest x-rays using ML algorithms. They used two types of CNN, i.e., Mask R-CNN and RetinaNet, and achieved satisfactory results by attaining accuracy of 91.86%. Toğaçar et al. [23] have used x-ray images of lungs to identify pneumonia. They used CNN as a feature extractor by utilizing the existing models of CNN, such as VGG-16 and AlexNet. These models extract a large number of features from images. Further, they applied classical ML classifiers like DT, LDA, and linear regression to identify pneumonia. They achieved good results, which show the importance of DL and ML classification algorithms.
Prabhu et al. [24] proposed another healthcare framework based on DL to diagnose and detect cancer and pneumonia. They used two DL approaches, in which modified AlexNet was the first one. It was envisioned to separate and classify the chest X-ray images into normal and abnormal classes using SVM. The performance of the proposed scheme was validated on pre-trained DL transfer learning functions (VGG16 and AlexNet). On the other hand, the second approach implements a synthesis of handcrafted and learned features to increase lung cancer accuracy during the valuation. Kermany et al. [25] used a CNN model to identify pneumonia and attained the classification accuracy of 92.18%. In another study, Stephen et al. [26] used a DL model with four convolution and two dense layers to classify pneumonia using a chest X-ray image dataset and attained an accuracy of 92.37%.
Sarvaiva et al. [27] investigated the pneumonia disease using a DL model with six convolutional and three dense layers. They attained promising results in terms of accuracy by attaining accuracy of 93.25%. Liang et al. [18] proposed a CNN model having 40 convolutional and two dense layers and conquered an accuracy of 94.02%. Zhang et al. [28] developed a predictive model based on the conventional DL CNN model and ML Random Forest (RF) model. They achieved promising results in terms of accuracy by attaining accuracy of 94.34%. They used CNN for extracting useful features from the images and then present them to the RF classification algorithm to classify them into two classes, i.e., pneumonia and normal.
Goldbaum et al. [25] have used CNN to identify pneumonia disease and attained good results in terms of accuracy by achieving the classification accuracy of 92.80%. In another study, Sain et al. [26] have proposed a DL model consisting of 4 convolution layers and two dense layers and achieved a classification accuracy of 93.70%. Ferreira et al. [27] have used almost the same architecture as [26], but they used three dense layers and attained the classification accuracy of 95.24%. In another research study, Zhang et al. [18] have used DL architecture along with 42 convolutional layers and two dense layers and attained promising results in terms of classification accuracy by achieving the accuracy of 95.90%.
Methodology
This section represents the experiments accomplished and the assessment steps taken to track the efficiency and effectiveness of architecture of our proposed model. We proposed a deep convolutional neural network (DCNN) with 52 convolution layers and two dense layers for the identification of pneumonia using a chest X-ray image dataset. All the experiments were carried out on chest X-ray images utilized in [29]. Keras DL framework is deployed that uses TensorFlow at the backend for building and training our proposed deep convolutional neural network (DCNN) model. The libraries and packages used in the implementation of the work include TensorFlow, Keras, Sklearn, matplotlib, Seaborn, NumPy, etc. All the experiments were performed using the Jupyter NoteBook of the Anaconda integrated development environment (IDE).
Dataset
Problem-specific dataset has a great impact on the development of an intelligent system. In this study, chest X-ray and CT Image dataset was used which is available on the UCI Kaggle databases. The dataset consist of a total of 5856 images of two categories/classes i.e., pneumonia and normal images. The dataset contains 1583 normal and 4273 pneumonia images, all the images are in jpeg format. The dataset is distributed in two parts (train and test), where 70% data are used to train the model while the 30% data are used to test and validate the model. In the 30% data, 20% is used for testing while the rest of 10% is used for the validation of the model. Figure 1 represents a sample of normal while Fig. 2 demonstrates an example of chest X-ray images having pneumonia disease.
Fig. 1.
A sample of normal chest X-ray images
Fig. 2.
A sample of chest X-ray images having pneumonia disease
Data augmentation and preprocessing techniques
After loading the dataset, there is need of some preprocessing techniques that helps in improving the visual-information and quality of the input images (remove noise, improve quality via increasing contrast, deletion of high and low frequencies from the input image, etc.). In our work, we investigated intensity normalization and CLAHE, two well-known preprocessing techniques. Intensity normalization is considered to be one of the auspicious image processing applications. MinMax preprocessing technique is used in order to present the image data in a normalized form to the model. Equation (1) represents the mathematical representation of MinMax. In addition, CLAHE is used to increase the contrast level of the input image before giving it to the model [30, 31]. Figure 3 represents a sample of the original and images after applying the preprocessing techniques.
Fig. 3.
A samples of original image and after applying preprocessing techniques
As discussed earlier, the dataset is distributed in two parts i.e., training and validation, where the data used for training will never be used for testing and vice versa. From the dataset, we observe that it is imbalanced i.e., almost 75% images illustrates pneumonia while the rest of 25% represents normal images as shown in Fig. 4. Indeed this is a serious issue, in order to tackle this issue we used data augmentation for resampling of our dataset. Data augmentation helped in the generation of almost two images from a single image via different augmentation methods, and hence, assists in dataset balancing and avoiding over-fitting problem. Figure 5 shows the balanced dataset after applying the preprocessing and data augmentation techniques. Further, the data augmentation techniques used includes the geometric transformation are shown in Table 1.
Fig. 4.
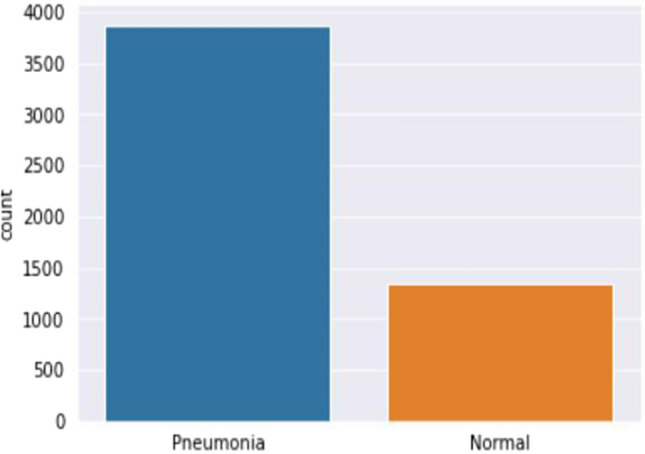
Imbalanced dataset before augmentation
Fig. 5.
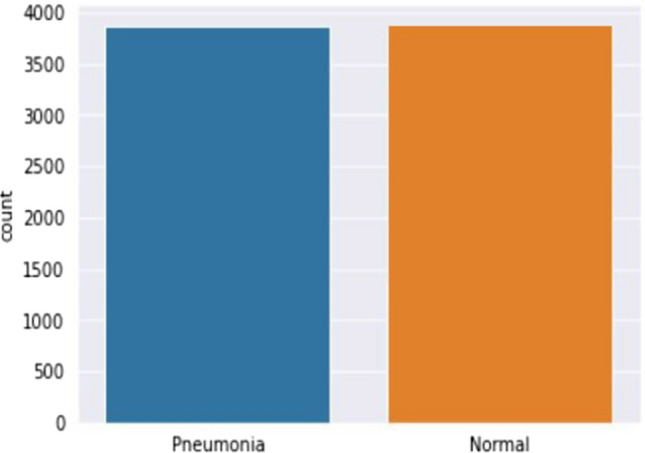
Balanced dataset after applying data augmentation techniques
Table 1.
Image augmentation settings
| Augmentation procedure | Parameter value |
|---|---|
| Rescale | 1/255 |
| Rotation-range | 45o |
| Width-shift | 0.25 |
| Height-shift | 0.25 |
| Shear-range | 0.25 |
| Zoom-range | 0.25 |
| Horizontal-flip | True |
| Fill-mode | Nearest |
Proposed deep convolutional neural network (DCNN) architecture
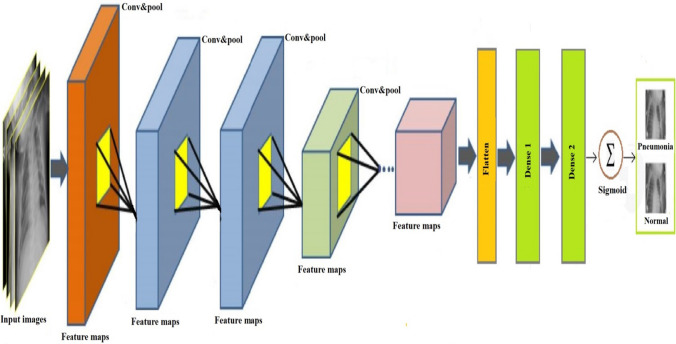
The first step for the determination and development of an optimal architecture of the model is to have knowledge about the nature of the problem. In our paper, we proposed a modified DCNN model for the diagnosis of pneumonia disease using chest X-ray images. An image has various features and the most common among those are shape, color, spatial relation, and texture. Pneumonia has several types, and the main distinction among them is due to one feature i.e., lung texture. Unlike image color features such as RGB and gray-scale, textures of an image are illustrated by the gray-scale distribution of the pixels' closest collection and the area around it. Texture can also be defined as, a constant replication of the local pixels in the image global region. Figure 6 illustrate the architecture of the proposed DCNN model. The proposed architecture mainly consists of two parts i.e., feature extractor and classification part. In the feature, extraction layers every layer takes the output of the preceding layer as an input and produces output which is then considered as input for the succeeding layer. From Fig. 6, it is obvious that the architecture of the proposed model comprises of the combination of convolutional layers, max-pooling layers, and a classification layer. The feature extraction part is composed of 52 convolution layers, along with the max-pooling having size of 2*2 and ‘Relu’ activation function at each layer. After processing, the output produced as a computation of the convolution and max-pooling operations is then accumulated into 2D planes known as feature maps. It may be noted that every plane of each layer in the network was attained by one or more planes of the preceding layers.
Fig. 6.
Proposed deep convolutional neural network (DCNN) architecture
The classifier is putted at the last of the proposed DCNN model. It works like a simple MLP algorithm and is mostly known as a dense layer. The classifier needs distinct features i.e., vectors to do operations like the other classifiers that mostly work on 1D data or vector. Hence, the output produced by the feature extractor i.e., CNN part is transformed to 1 dimensional features vector before presenting to the classifier. The result of the convolution process is converted to a long one dimensional feature vector for the dense layer to use it in the classification, this method is known as flattening. The classification layer consists of a flatten layer having dropout size of 0.5, and two dense layers where dense 1 having size of 512 and dense 2 of size 1. The two dense layers uses ‘Relu’ activation function, and finally for the classification the activation function used is sigmoid, which is considered to be a go-to method for the binary classification.
Performance measures
The last step after feature extraction and classification is to check the efficiency of the model in terms of various performance evaluation metrics that assists in tracking the performance of the model. In this study, the four most common and important performance measures such as accuracy, specificity, sensitivity, f1-measure are computed with the help of confusion matrix. ROC curve is used to measure the efficiency of the proposed system graphically. Following are the formulas through which these measures are computed:
| 1 |
| 2 |
| 3 |
| 4 |
All of the above-mentioned formulas are carried out from the confusion matrix which consists of the following basic components.
True positive (TP): TP shows that the prediction of the model is positive and in actual the individual has pneumonia. So, a pneumonia subject is diagnosed correctly by the model.
True negative (TN): TN shows that the prediction of the model is negative and in actual the individual does not have the pneumonia disease. Hence, a fit person is diagnosed appropriately by the classification model.
False positive (FP): It means that the model did wrong prediction by classifying a healthy person as pneumonia patient. This is also known as type-I error.
False negative (FN): It means that the model did wrong prediction by classifying a pneumonia patient as healthy. This is also known as type-II error.
Results and discussion
This subsection signifies the simulation outcomes attained via performing multiple experiments. To validate the efficiency and significance of the proposed methodology, we performed 15 experiments where each experiment took almost 3.5 h. To upgrade the performance of the proposed model, the parameters used in the modified DCNN were tuned frequently in order to get the highest possible validation results. By performing multiple experiments, different results were achieved but the most valid and optimum one is reported here in this section.
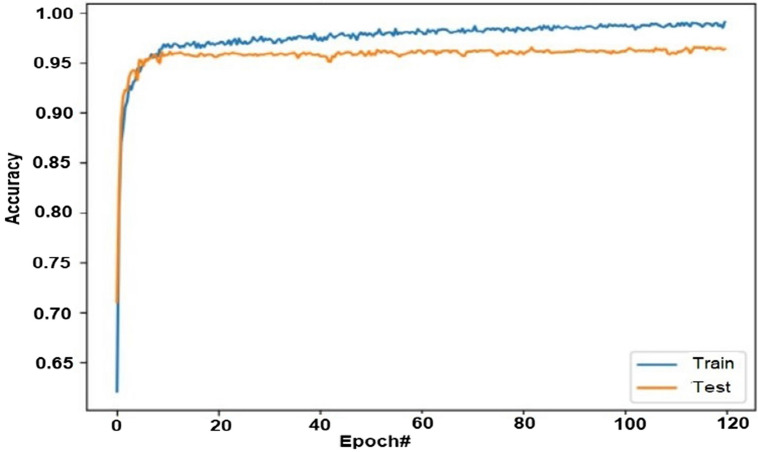
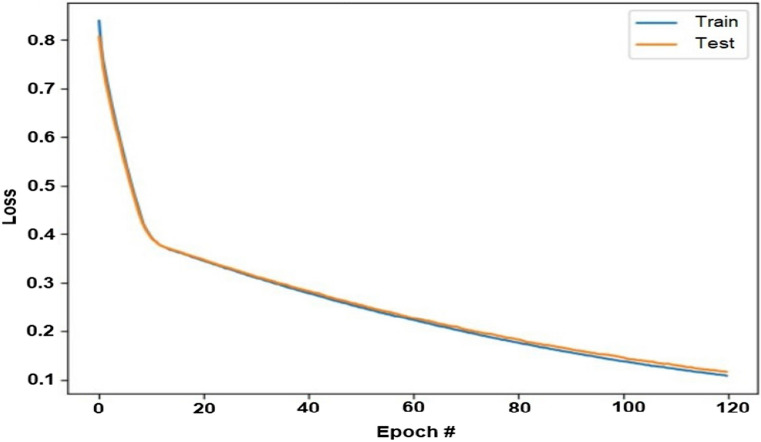
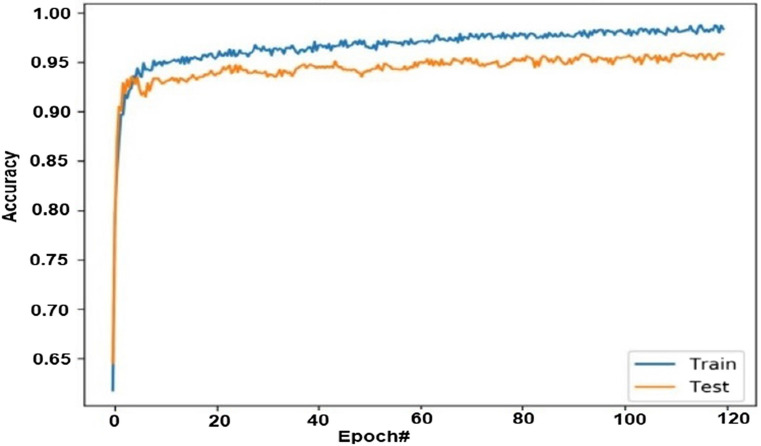
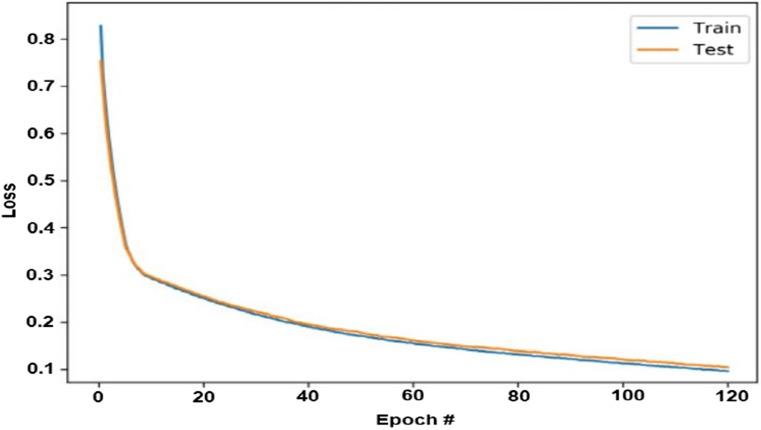
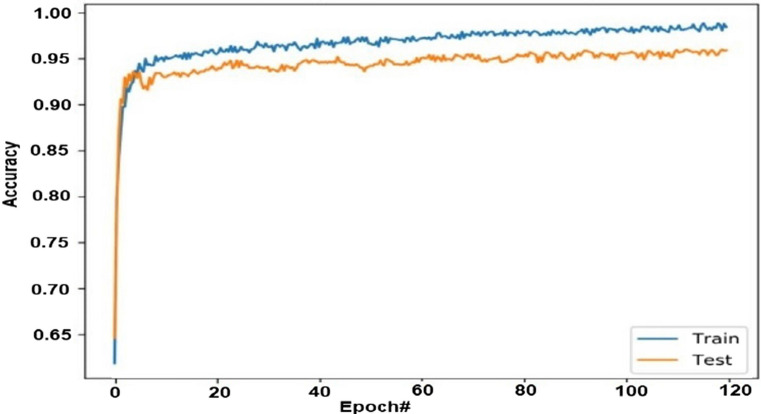
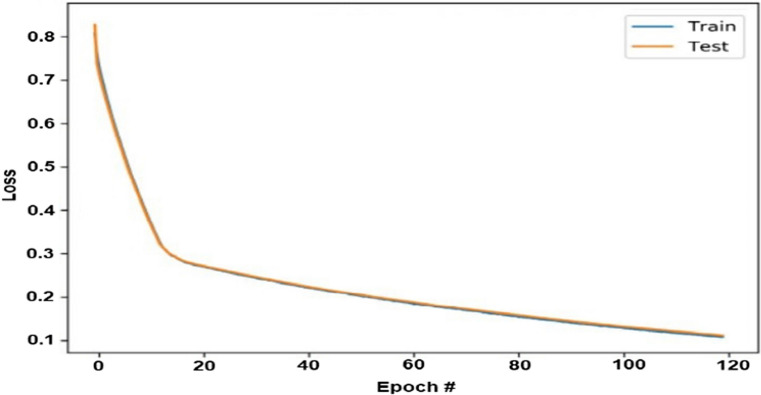
Figures 7 and 8 represent the results attained by using various techniques like data augmentation, annealing, other parameters tuning like learning rate, etc., and feeding the dataset in a well-organized manner to the proposed DCNN architecture. This helped in attaining the promising results such as the training accuracy of 98.02%, and validation accuracy of 96.09%, respectively. Figure 7 demonstrates the training and validation accuracies while Fig. 8 illustrates the training and validation loss of the proposed model.
Fig. 7.
Training and testing accuracy of the proposed model
Fig. 8.
Training and testing loss of the proposed model
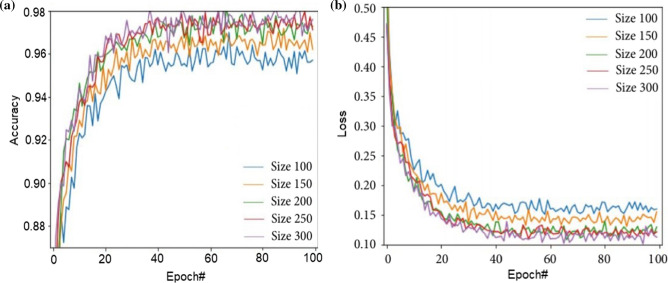
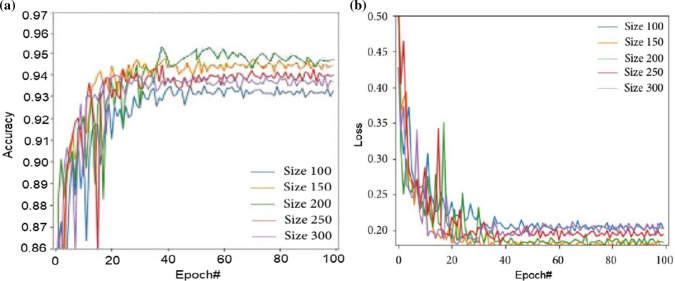
All the frameworks of convolutional neural network that we want to train on images, needs images of fixed size, i.e., all the images should be of the same size and dimension before feeding into the model for training. In order to check the training and validation accuracies and to attain the most promising results while using the proposed model multiple experiments were performed using various size of image dimensions. The images were reshaped to the sizes of 300 * 300, 250 * 250, 200 * 200, 150 * 150, and 100 * 100, respectively. All these experiments take almost 3.5 h for a single experiment. Figure 9 shows the graphical representation of the training accuracies and training loss, while Fig. 10 illustrates the validation accuracies and validation loss all the experiments performed using various image size and dimensions.
Fig. 9.
Training accuracies (a) and training loss (b) on various image dimensions
Fig. 10.
Validation accuracies (a) and Validation loss (b) on various image dimensions
From the above experiments, we observed that the validation accuracies vary with the size of the images, the good performance was observed for small sized images. But it does not mean that smaller size images will take less time for training, almost all the image size takes same time. The same accuracy results were observed for the 150*150 and 200*200 dimension images. In our study, we select the 200*200*3 image dimensions that help in attaining the better training and testing accuracies of 98.02% and 96.09%, respectively, as shown in Figs. 9 and 10.
To track the efficiency of an intelligent model, numerous performance measures are utilized. In this study, we used 4 well-known and most common performance measures for checking the efficiency of our proposed DCNN model. The performance measures include accuracy, sensitivity, specificity, and ROC curve. All the performance metrics were premeditated from the confusion matrix as illustrated in Table 2.
Table 2.
Confusion matrix
| Actual | Predicted | |
|---|---|---|
| Normal | Pneumonia | |
| Normal | 1705 | 24 |
| Pneumonia | 111 | 1618 |
Table 3 notifies all the experimental results attained using the proposed DCNN model. All the results were attained using the image dimensions of 200 * 200 * 3.
Table 3.
Performance of the proposed DCNN model
| Model | Accuracy | Sensitivity | Specificity |
|---|---|---|---|
| DCNN | 96.09 | 93.58 | 98.61 |
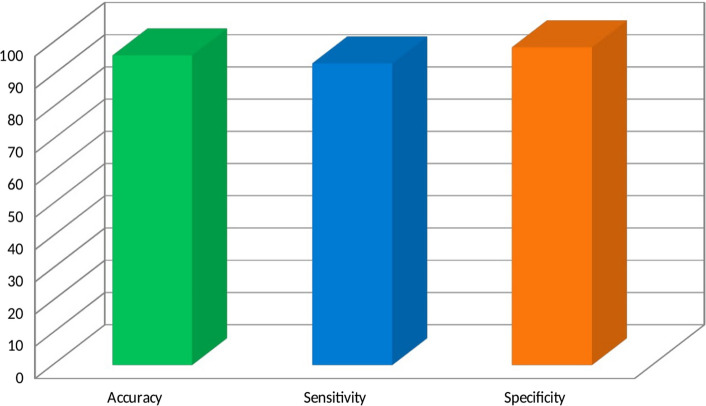
From Table 3, we observed that the proposed DCNN model performed exceptionally well in terms of all the utilized performance measures by attaining the accuracy of 96.09%, sensitivity of 93.58%, and specificity of 98.61%.
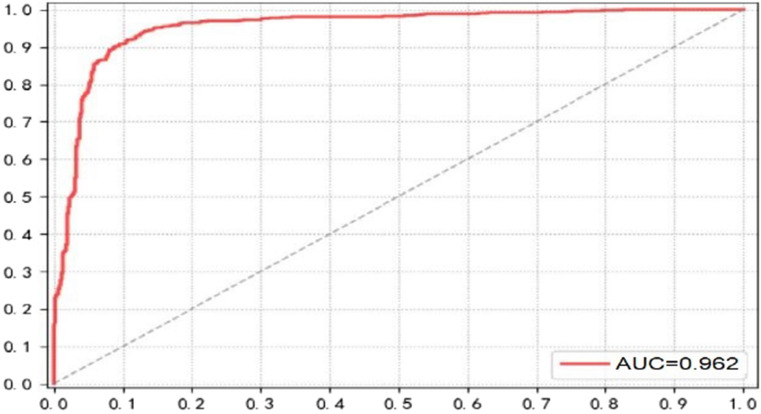
Figure 11 represents the graphical representations of all the utilized performance measures (Accuracy, sensitivity, and specificity), while Fig. 12 illustrates the ROC curve obtained via the proposed DCNN model.
Fig. 11.
Performance (Accuracy, sensitivity, and specificity) of the proposed DCNN model
Fig. 12.
ROC curve of the proposed DCNN model
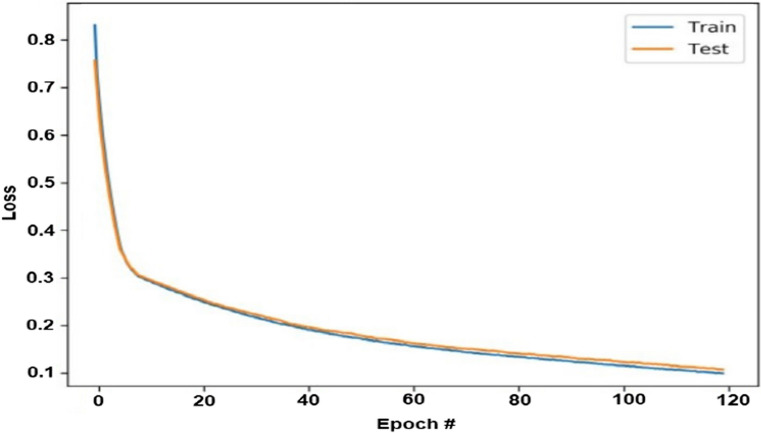
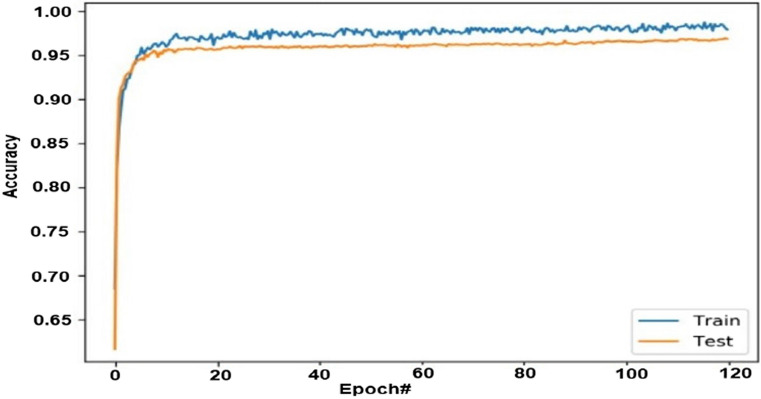
We also used the DL pre-trained models i.e., VGG16, AlexNet, and ResNet50 for the classification of pneumonia using the same dataset and attained good results in terms of accuracy and other performance indicators. Figure 13 shows the training and validation accuracy of VGG16 model. From the experimental results, we observed that VGG16 attained good performance by attaining the training accuracy of 95.12% and validation accuracy of 92.34%. Figure 14 illustrates the training and validation loss of the VGG16 model.
Fig. 13.
Training and validation accuracy of the VGG16 model
Fig. 14.
Training and validation loss of the VGG16 model
Figure 15 shows the training and validation accuracy of AlexNet model. From the experimental results, we observed that AlexNet attained good performance by attaining the training and validation accuracy of 96.80% and 93.67%, respectively. Figure 16 illustrates the training and validation loss of the AlexNet model.
Fig. 15.
Training and validation accuracy of the AlexNet model
Fig. 16.
Training and validation loss of the AlexNet model
Figure 17 demonstrates the training and validation accuracy of DL ResNet50 model. The experimental result shows that ResNet50 performed really well and attained the training and validation accuracy of 97.20% and 94.59%. Figure 18 shows the training and validation loss of the ResNet50 model.
Fig. 17.
Training and validation accuracy of the ResNet50 model
Fig. 18.
Training and validation loss of the ResNet50 model
Table 4 represents the training and validation accuracies of all the utilized DL free-trained models (VGG16, AlexNet, and ResNet50) and the proposed DCNN model.
Table 4.
Training and validation accuracies of all the utilized models
| Model | Training accuracy | Validation accuracy |
|---|---|---|
| VGG16 | 95.12 | 92.34 |
| AlexNet | 96.80 | 93.67 |
| ResNet50 | 97.20 | 94.59 |
| Proposed (DCNN) | 98.02 | 96.09 |
Further, a comparison of the proposed system is accomplished with other state-of-the-art ML and DL methods. Table 5 demonstrates a short summary of the classification accuracies of the earlier techniques.
Table 5.
Comparison with the previous approaches
| Research article | Proposed approach | Classification accuracy (%) |
|---|---|---|
| Goldbaum et al. [25] | Convolutional neural network (CNN) | 92.80 |
| Sain et al. [26] | DL model with 4 conv-layers and 2 dense layers | 93.70 |
| Ferreira et al. [27] | DL model with 4 conv-layers and 3 dense layers | 95.24 |
| Zheng et al. [18] | DL model with 42 conv-layers and 2 dense layers | 95.90 |
| Our approach | DCNN model with 42 conv-layers and 2 dense layers | 96.09 |
This study proposes a modified DCNN model for the identification of pneumonia disease using the chest X-ray and CT image dataset. At first step, the proposed model was trained on a set of chest x-ray images. The model extracts useful features from these images and trained the model on the extracted features by deciding the category of the image that whether it is normal or the person is a pneumonia patient. After training, a set of images is provided to the model in order to classify them into two classes whether the given image of the person chest x-ray is normal or the person has pneumonia. From the assessment with the previous techniques, it is founded that our model performed significantly well than the other approaches and techniques.
Conclusion
Pneumonia is an infective disease and highly hazardous to almost all age people, specifically for elders above 70-years-old and children of less than five years. The death ratio caused by this disease can be reduced if the patients are identified at the initial phases, and on-time medication and treatment are provided to them. In this study, we proposed a modified DCNN model to diagnose pneumonia. For training and testing the proposed model, a chest X-ray database has been used. To enhance the quality of visual information of input images, various preprocessing techniques such as intensity normalization, CLAHE, and Min–Max normalization have been utilized in this study. The proposed DCNN consists of 52 convolution layers (the ‘Relu’ activation function follows every convolution layer) and two dense layers. To reduce the cross-entropy loss, Adam optimizer has been used. The classification at the last layer uses the sigmoid activation function, which is considered a go-to method for binary classification problems. The performance of the proposed system has been measured with the help of 4 performance metrics which include: accuracy, sensitivity, specificity, and ROC curve. The proposed DCNN model performed exceptionally well by attaining the training accuracy of 98.02%, and the validation accuracy of 96.09%, which is much higher than the existing approaches and techniques. It is anticipated that this framework will be of great interest and value for the doctors and other caregivers.
Acknowledgements
This work is a key subject supported by Natural Science Foundation of Hunan Province (2018JJ4094).
Declarations
Conflict of interest
All authors declare that there is no conflict of interest in this paper.
Footnotes
Publisher's Note
Springer Nature remains neutral with regard to jurisdictional claims in published maps and institutional affiliations.
Contributor Information
Rong Yi, Email: 183293181@qq.com.
Lanying Tang, Email: 18007339538@189.cn.
Yuqiu Tian, Email: 371283174@qq.com.
Jie Liu, Email: 530389278@qq.com.
Zhihui Wu, Email: 1035683234@qq.com.
References
- 1.Bates JH, Campbell GD, Barton AL, et al. Microbial etiology of acute pneumonia in hospitalized patients. Chest. 1992;101(4):1005–1012. doi: 10.1378/chest.101.4.1005. [DOI] [PubMed] [Google Scholar]
- 2.Tian Y, Wu Y, Liu H, et al. The impact of ambient ozone pollution on pneumonia: a nationwide time-series analysis. Environ Int. 2020;136:105498. doi: 10.1016/j.envint.2020.105498. [DOI] [PubMed] [Google Scholar]
- 3.Prina E, Ranzani OT, Torres A. Community-acquired pneumonia. Lancet. 2015;386(9998):1097–1108. doi: 10.1016/S0140-6736(15)60733-4. [DOI] [PMC free article] [PubMed] [Google Scholar]
- 4.Watkins K, Sridhar D (2018) Pneumonia: a global cause without champions [DOI] [PubMed]
- 5.Asnaoui KE, Chawki Y, Idri A (2020) Automated methods for detection and classification pneumonia based on X-ray images using deep learning. arXiv preprint arXiv: 2003.14363
- 6.Kondo K, Suzuki K, Washio M, et al. Effectiveness of 23-valent pneumococcal polysaccharide vaccine and seasonal influenza vaccine for pneumonia among the elderly-selection of controls in a case-control study. Vaccine. 2017;35(36):4806–4810. doi: 10.1016/j.vaccine.2017.07.005. [DOI] [PubMed] [Google Scholar]
- 7.The LGH. The disgraceful neglect of childhood pneumonia. Lancet Global Health. 2018;6(12):e1253. doi: 10.1016/S2214-109X(18)30495-9. [DOI] [PubMed] [Google Scholar]
- 8.Zare MR, Mueen A, Seng WC. Automatic classification of medical X-ray images using a bag of visual words. IET Comput Vis. 2013;7(2):105–114. doi: 10.1049/iet-cvi.2012.0291. [DOI] [Google Scholar]
- 9.Khan S, Yong SP (2017) A deep learning architecture for classifying medical images of anatomy object. In: 2017 Asia-Pacific signal and information processing association annual summit and conference (APSIPA ASC). IEEE, pp 1661–1668
- 10.Katsuragawa S, Doi K. Computer-aided diagnosis in chest radiography. Comput Med Imaging Gr. 2007;31(4–5):212–223. doi: 10.1016/j.compmedimag.2007.02.003. [DOI] [PubMed] [Google Scholar]
- 11.Cao Y, Liu C, Liu B, Brunette MJ, Zhang N, Sun T, Curioso WH (2016) Improving tuberculosis diagnostics using deep learning and mobile health technologies among resource-poor and marginalized communities. In: 2016 IEEE first international conference on connected health: applications, systems and engineering technologies (CHASE). IEEE, pp 274–281
- 12.Liu C, Cao Y, Alcantara M, Liu B, Brunette M, Peinado J, Curioso W (2017) TX-CNN: detecting tuberculosis in chest X-ray images using convolutional neural network. In: 2017 IEEE international conference on image processing (ICIP). IEEE, pp 2314–2318
- 13.Muhammad Y, Tahir M, Hayat M, Chong KT. Early and accurate detection and diagnosis of heart disease using intelligent computational model. Sci Rep. 2020;10:1–17. doi: 10.1038/s41598-020-76635-9. [DOI] [PMC free article] [PubMed] [Google Scholar]
- 14.Schramek GGR, Stoevesandt D, Reising A, Kielstein JT, Hiss M, Kielstein H. Imaging in anatomy: a comparison of imaging techniques in embalmed human cadavers. BMC Med Educ. 2013;13(1):143. doi: 10.1186/1472-6920-13-143. [DOI] [PMC free article] [PubMed] [Google Scholar]
- 15.Li J, Liang Z, Wang S, Wang Z, Zhang X, Hu X, Wang K, He Q, Bai J. Study on the pathological and biomedical characteristics of spinal cord injury by confocal raman microspectral imaging, Spectrochim. Acta Part A Mol Biomol Spectrosc. 2019;210:148–158. doi: 10.1016/j.saa.2018.11.022. [DOI] [PubMed] [Google Scholar]
- 16.Winkel DJ, Heye T, Weikert TJ, Boll DT, Stieltjes B. Evaluation of an aibased detection software for acute findings in abdominal computed tomography scans: toward an automated work list prioritization of routine ct examinations. Invest Radiol. 2019;54(1):55–59. doi: 10.1097/RLI.0000000000000509. [DOI] [PubMed] [Google Scholar]
- 17.Kermany D, Zhang K, Goldbaum M. Labeled optical coherence tomography (oct) and chest X-ray images for classification. Mendeley Data. 2018;2:2. [Google Scholar]
- 18.Liang G, Zheng L. A transfer learning method with deep residual network for pediatric pneumonia diagnosis. Comput Methods Program Biomed. 2019;187:104964. doi: 10.1016/j.cmpb.2019.06.023. [DOI] [PubMed] [Google Scholar]
- 19.Ge Y, Wang Q, Wang L, et al. Predicting post-stroke pneumonia using deep neural network approaches. Int J Med Inform. 2019;132:103986. doi: 10.1016/j.ijmedinf.2019.103986. [DOI] [PubMed] [Google Scholar]
- 20.Behzadi-khormouji H, Rostami H, Salehi S, et al. Deep learning, reusable and problem-based architectures for detection of consolidation on chest X-ray images. Comput Methods Programs Biomed. 2020;185:105162. doi: 10.1016/j.cmpb.2019.105162. [DOI] [PubMed] [Google Scholar]
- 21.Jaiswal AK, Tiwari P, Kumar S, et al. Identifying pneumonia in chest X-rays: a deep learning approach. Measurement. 2019;145:511–518. doi: 10.1016/j.measurement.2019.05.076. [DOI] [Google Scholar]
- 22.Sirazitdinov I, Kholiavchenko M, Mustafaev T, et al. Deep neural network ensemble for pneumonia localization from a large-scale chest X-ray database. Comput Electr Eng. 2019;78:388–399. doi: 10.1016/j.compeleceng.2019.08.004. [DOI] [Google Scholar]
- 23.Toğaçar M, Ergen B, Cömert Z (2019) A deep feature learning model for pneumonia detection applying a combination of mRMR feature selection and machine learning models. In: IRBM
- 24.Bhandary A, Prabhu GA, Rajinikanth V, et al. Deep-learning framework to detect lung abnormality—a study with chest X-ray and lung CT scan images. Pattern Recogn Lett. 2020;129:271–278. doi: 10.1016/j.patrec.2019.11.013. [DOI] [Google Scholar]
- 25.Kermany DS, Goldbaum M, Cai W, et al. Identifying medical diagnoses and treatable diseases by image-based deep learning. Cell. 2018;172(5):1122–1131. doi: 10.1016/j.cell.2018.02.010. [DOI] [PubMed] [Google Scholar]
- 26.Stephen O, Sain M, Maduh UJ et al (2019) An efficient deep learning approach to pneumonia classification in healthcare. J Healthcare Eng 2019 [DOI] [PMC free article] [PubMed]
- 27.Saraiva A, Ferreira N, Sousa L et al (2019) Classification of images of childhood pneumonia using convolutional neural networks, pp 112–119
- 28.Wu H, Xie P, Zhang H et al (2020) Predict pneumonia with chest X-ray images based on convolutional deep neural learning networks. J Intell Fuzzy Syst 1–15 (Preprint)
- 29.Kermany DK, Goldbaum M (2018) Labeled optical coherence tomography (OCT) and chest X-ray images for classification, mendeley data, London, UK
- 30.Kharel N, Alsadoon A, Prasad PWC, Elchouemi A (2017) Early diagnosis of breast cancer using contrast limited adaptive histogram equalization (CLAHE) and morphology methods. In: 8th International conference information communication system. ICICS 2017, pp 120–124
- 31.Makandar A, Halalli B. Breast cancer image enhancement using median filter and CLAHE. Int J Sci Eng Res. 2015;6(4):462–465. [Google Scholar]


