

Abstract
The aim of the study was to assess the potential role of preoperative gadolinium ethoxybenzyl diethylenetriamine pentaacetic acid (Gd-EOB-DTPA) dynamic enhanced MR imaging for diagnosing microvascular invasion (MVI) and pathological grade of hepatocellular carcinoma (HCC).
A total of 113 consecutive HCC patients confirmed by histopathology underwent preoperative Gd-EOB-DTPA dynamic enhanced MRI were included. Signal intensity (SI) of peritumoral, normal liver tissue and tumor parenchyma during arterial phase and hepatobiliary phase (HBP) were analyzed. The receiver operating characteristic (ROC) curves were performed to assess the potential diagnostic capability for MVI and pathological grade of HCC. Kaplan–Meier method was performed to estimate the recurrence-free survival rate and compared using the log rank test.
SI ratio of peritumoral tissue to normal liver in arterial phase (SIAp/Al) was independently associated with MVI [odds ratio (OR) = 3.115, 95% confidence interval (CI): 1.867–5.198] and pathological grades (OR = 1.437, 95% CI: 1.042–1.981). The area under the curve (AUC) of SIAp/Al was equivalent to the SI of tumor parenchyma on arterial phase (SIAt) in distinguishing low and high pathological grades. However, the AUC of SIAp/Al (0.851) was larger than peritumoral hypointensity on HBP (0.668) for distinguishing MVI. The recurrence-free survival rate of HCC patients with SIAp/Al<1.1 was higher than HCC with SIAp/Al≥1.1(P = .025).
The SIAp/Al in preoperative Gd-EOB-DTPA dynamic enhanced MR imaging is a potential diagnosis marker for MVI and pathological grade of HCC noninvasively. The higher SIAp/Al may predict the poor prognosis of HCC after surgery.
Keywords: Gd-EOB-DTPA, Hepatocellular carcinoma, Microvascular Invasion, Pathological Grade
1. Introduction
Hepatocellular carcinoma (HCC) is the second leading cause of cancer-related deaths worldwide, which becomes a serious threat to human health.[1,2] Surgical resection is considered as a suitable option for HCC patients with well-preserved liver function.[3,4] However, the top rate of early recurrence and metastasis are the essential causes of postoperative death.[5] Microvascular invasion (MVI) is an important predictor of early recurrence of patients with HCC after surgical resection or liver transplantation.[6,7] HCC pathological grade is strongly associated with prognosis, the long-term survival of the high-grade HCC patients remains poor prognosis because of high-recurrence rates.[8] Unfortunately, the difficult diagnosis of MVI and pathological grade of tumor before operation limits the clinical application in decision making. Therefore, noninvasive diagnosis of MVI and pathological grade before surgery are urgent for optimal diagnosis and management of HCC, which is helpful to improve the long-term survival time of patients.
Imaging techniques including computed tomography (CT) and magnetic resonance (MR) imaging have a potential to provide reliable assessment for MVI and histopathology of HCC based on the morphologic features.[9,10] Compared with dynamic enhanced CT, preoperative gadolinium ethoxybenzyl diethylenetriamine pentaacetic acid (Gd-EOB-DTPA) enhanced MRI can provide more details for radiological features of HCC.[11–13] Several studies[14–16] have reported that peritumoral enhancement on arterial phase, peritumoral hypointensity during hepatobiliary phase (HBP), and tumor-to-liver signal intensity (SI) ratio are useful for assessment MVI of HCC on Gd-EOB-DTPA enhanced MR imaging. It is reported that[17] the diffusion kurtosis imaging-derived parameters show significance in the preoperative evaluation of MVI and the pathological grade in HCC. However, the diffusion kurtosis imaging protocol decreases signal-to-noise ratio on parameter maps because of gains under free-breathing, and it does not use this protocol as a routine sequence. The previous study[18] concluded that rim enhancement in the arterial phase and peritumoral hypointensity in the HBP using gadobenate dimeglumine were independent risk factors for MVI in patients with HCC, and the combi_nation of the two predictors had a specificity of 95.15% for predicting MVI. However, gadobenate dimeglumine is a MRI contrast agent characterized by nonspecific distribution in the extracellular space and specific uptake in hepatocytes, HBP gained within 40 to 120 min after being injected the contrast agent which takes a longer time than Gd-EOB-DTPA. The older patients and patients with severe disease could not bear long-term scanning. To our best knowledge, few studies have explored the ability of Gd-EOB-DTPA enhanced MR imaging in assessing MVI and pathological grade of HCC simultaneously.
Therefore, the purpose of this study is to evaluate the potential value of the signal intensity characteristics in Gd-EOB-DTPA dynamic enhanced MRI for preoperative assessment of MVI and the pathological grade in HCC patients. Additionally, we also explored the correlation between the signal intensity characteristics and the recurrence-free survival rate of HCC after curative resection.
2. Materials and methods
2.1. Selection of patients
A total of 177 consecutive patients with HCC imaging findings based on preoperative Gd-EOB-DTPA-dynamic enhanced MR imaging between September 2015 and December 2019. The inclusion criteria were as follows:
-
1.
Gd-EOB-DTPA dynamic enhanced MR imaging performed within 14 days before surgery, and the images were qualified for evaluation;
-
2.
(2)HCC without macrovascular invasion, or extrahepatic metastasis according to preoperative evaluation;
-
3.
primary liver lesions without prior treatment;
-
4.
HCC was confirmed by histopathology after hepatectomy.
The exclusion criteria were as follows:
-
1.
hepatic lesions diagnosed as other tumors by pathological (n = 18);
-
2.
images were unqualified for evaluation (n = 4);
-
3.
hepatectomy over 2 weeks after the MR examination (n = 19).
Finally, twenty-three patients excluded for prior treatment before surgery, and 113 patients remained in this study (Fig. 1). The study was conducted in accordance with the provisions of the Declaration of Helsinki, 1975 and met the ethical requirements of the First Hospital of Lanzhou University (LDYYLL2020-197).
Figure 1.
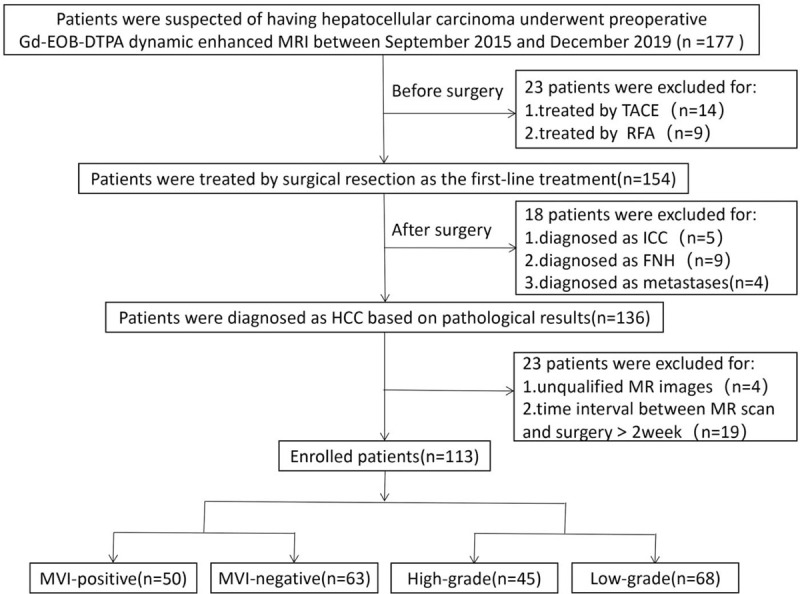
Flow chart of the enrolled patients for the study. FNH = focal nodular hyperplasia, ICC = intrahepatic cholangiocarcinoma, MVI = microvascular invasion, RFA = radiofrequency ablation, TACE = transcatheter arterial chemoembolization.
2.2. MR imaging acquisition
MRI was performed using a 3.0-T MR scanner (MAGNETOM Skyro, Siemens Healthcare, Erlangen, Germany) with an 18-channel phased-array wrap-around surface coil. All patients fasted for 8 h before the scan and received breathing training. The Gd-EOB-DTPA (Primovist; Bayer Schering Pharma, Berlin, Germany) dynamic enhanced MR imaging were obtained using fat-suppressed axial T1-weighted three-dimensional volume interpolated breath-hold examination sequence. The contrast agent was automatically administered intravenously using a power injector at a dose of 25 μmol/Kg and a flow rate of 1 ml/s, followed by a 20 ml bolus of saline. For all patients, the enhanced scan of the arterial, portal venous, equilibrium phases and HBP were performed at 20–30 s, 60–70 s, 3 min, 20 min, after the injection of Gd-EOB-DTPA, respectively. The scanning parameters were as follows: TR/TE 4/2ms; NEX 0.75, slice thickness 2 mm; matrix size 352x256; field of view (FOV) 400×290 mm2; flip angle 9°.
2.3. Imaging analysis and evaluation
Two abdominal radiologists (Y.D., J.L., with 18 and 10 years of experience in hepatic MR imaging, respectively) independently analyzed the images. They resolved any discrepancies during image analysis by consensus discussion with each other. HCC was diagnosed by Gd-EOB-DTPA dynamic enhanced MRI when dynamic CT produced atypical radiologic images of HCC, or was performed to detect HCCs not detected by liver dynamic CT. HCC was diagnosed according to the guidelines issued by the American Association for the Study of Liver Diseases (AASLD).
The following imaging features were evaluated for each HCC:
-
1.
tumor capsule referred to a peripheral rim of hyperenhancement in the portal venous or equilibrium phase, capsule was categorized to complete, incomplete, or absence;
-
2.
tumor maximum diameter and tumor number, analyzed during hepatobiliary phase; the maximum diameter of the tumor was divided into≤2 cm, >2 cm and ≤5 cm, >5 cm; and tumor number was categorized as single tumor and ≧2 tumors;
-
3.
peritumoral hypointensity in the HBP was defined as an irregular, wedge-shaped, or flame-like hypointense area of adjacent hepatic parenchyma within 1.0 cm to the tumor;
-
4.
signal intensity (SI) of tumor parenchyma, peritumoral tissue and normal liver tissue, were measured at the arterial and hepatobiliary phases as follows: SI of peritumoral tissue on arterial phase (SIAp), SI of tumor parenchyma on arterial phase (SIAt), SI of normal liver tissue on arterial phase (SIAl), SI peritumoral tissue on HBP (SIHp), SI tumor parenchyma on HBP (SIHt), SI of normal liver tissue on HBP phase (SIHl); the relative signal intensity ratio concluded SIAp/Al and SIHp/Hl which were calculated as SIAp/Al = SIAp/ SIAl, SIHp/Hl = SIHp/ SIHl.
For accurate quantitative measurement of the SI, the round-shaped region of interest (ROI) of the tumor was placed at the largest diameter in axial plane with a maximum area devoid of necrosis or hemorrhage, the ROI of the normal liver and peritumoral tissue were placed away blood vessels and bile ducts. The area of each ROI was 1.0 cm×1.0 cm. When analyzing the imaging features of patients with more than one lesion, the ROIs of the biggest lesion were selected only for further analysis. The unevenness of the MR signal intensity can lead to deviations in the results, therefore this study used multi-point signal averaging to make up for its shortcomings.
2.4. Histopathology evaluation
Histopathological data analyzed in this study including stage of liver fibrosis, presence or absence of cirrhosis, status of MVI, Ki67, and pathological grade of HCC. All histopathology analyses were performed on the largest lesion of each patient; this was the same lesion in which imaging features were assessed. MVI was divided into positive and negative, MVI-positive was defined as cancer cell nests in the vascular lumen lined by endothelial cells under the microscope which is dominated by branches of portal veins (including blood vessels inside the capsule),[19] in addition, CD31 staining was conducted to assist MVI identification. The major pathological grade of HCC (the predominant grade within tumor) was classified into I, II, III, or IV according to the Edmondson-Steiner classification.[20] Tumors with pathological grade I and II were classified into the low-grade group, and grade III and IV were classified into the high-grade group.
2.5. Follow-up
After hepatic resection, all patients underwent postoperative tumor surveillance which comprised physical examination, chest radiography, and serum alpha-fetoprotein (AFP) in one month after surgery and then every 2–3 months. In addition, Gd-EOB-DTPA dynamic enhanced MR performed every three months for evaluating recurrence and metastasis. Chest CT scans, bone scintigraphy, or positron emission tomography-computed tomography supplemented when necessary. The combination of elevating tumor markers and consistent radiological findings diagnosed tumor recurrence. It defined the interval time between surgery and the diagnosis of the first recurrence as recurrence-free survival time. The last follow-up date was December 31, 2019.
2.6. Statistical analysis
Continuous parameters were presented as mean ± standard deviation, categorical values were expressed as frequencies. The differences of normally distributed data were analyzed using a two-independent sample test, non-normally distributed data were analyzed using Mann-Whitney test. χ2 test or Fisher exact test was used for categorical variables. Variables with P = .05 in the univariate logistic regression analysis applied to a further multivariate logistic regression analysis. The receiver operating characteristic (ROC) curve with 95% confidence interval (CI) was used to analyze the diagnostic efficacy of imaging features for MVI and pathological grade of HCC. The Kaplan-Meier method was used to calculate the recurrence-free survival rates, and log-rank analysis determined differences in recurrence among subgroups. Two-sided P value of <.05 were considered statistically significant. All statistical analyses were performed using statistical package for social sciences (version 19.0, SPSS, Chicago, IL).
3. Results
3.1. Demographic and clinic-pathological characteristics
113 patients including 87 (77.0%) men (median age, 52 years; range, 40–79 years) and 26 (23.0%) women (median age, 52.50 years; range, 36–73 years) were finally included (Fig. 1). The median interval between MRI scan and surgery was 8 days for all patients, and the longest interval was 14 days. The number of MVI-positive and MVI-negative HCC patients were 50(44.3%), and 63(55.7%), respectively. There were 68(60.2%) patients in the low-grade group and 45(39.8%) patients in the high-grade group of our study. Detailed patient characteristics are summarized in Table 1.
Table 1.
Baseline characteristics of clinical and pathological findings.
| Variable | Value |
| Clinical information | |
| Age(y)∗ | 52 (36–79) |
| Mean(y)† | 54.22 ± 8.68 |
| Male sex,n(%) | 87 (77.0) |
| Age(y)∗ | 52 (40–79) |
| Mean age (y)† | 54.47 ± 8.37 |
| Female sex,n (%) | 26 (23.0) |
| Age (y)∗ | 53.38 ± 9.88 |
| Mean age (y)† | 52.50 (36–73) |
| Origin of liver disease, n (%) | |
| Hepatitis B | 97 (85.8) |
| Hepatitis C | 7 (6.2) |
| Normal | 8 (7.1) |
| Hepatic steatosis | 1 (0.9) |
| ICG-R15,%∗ | 5.45 (0.40–39.50) |
| MELD Score∗ | 5.96 (0.08–31.75) |
| Child-Pugh class, n (%) | |
| A | 101 (89.4) |
| B | 12 (10.6) |
| AFP (ng/mL), n (%) | |
| ≤20 | 63 (55.8) |
| >20 | 50 (44.2) |
| Pathological findings | |
| Cirrhosis, n (%) | |
| Present | 106 (93.8) |
| Absent | 7 (6.2) |
| MVI status, n (%) | |
| MVI positive | 50 (44.3) |
| MVI negative | 63 (55.7) |
| Ki67, n (%) | |
| ≤50 | 99 (87.6) |
| >50 | 14 (12.4) |
| Edmondson–Steiner grade, n (%) | |
| G1-G2 | 68 (60.2) |
| G3-G4 | 45 (39.8) |
| Fibrosis stage, n (%) | |
| S1-S2 | 93 (82.3) |
| S3-S4 | 20 (17.7) |
3.2. Features of MVI and pathological grade
AFP and Ki67 between the low-grade and the high-grade of HCC showed significant difference (P = .05), but no significant difference between MVI-positive group and MVI-negative group. No variables showed significant differences between the low and the high-grade HCC in other clinical characteristics (P = .05), such as age, gender, origin of liver disease, indocyanine green retention rate at 15 min (ICG-R15), model for end-stage liver disease (MELD) score, Child-Pugh class.
Among MR characteristics, high SIAp and SIAp/Al, peritumoral hypointensity on HBP were significantly related to MVI-positive group (P = .05). The maximum diameter and capsule integrity of tumor, SIAp/Al, SIAt, SIHt were significantly related between the low-grade and the high-grade of HCC (P = .05). MVI-positive and high-grade HCC have higher SIAp/Al comparing to MVI-negative and low-grade HCC (P = .05) (Table 2).
Table 2.
Comparisons of parameters between different MVI and pathological groups.
| MVI status | Edmondson-Steiner grades | |||||
| Parameters | MVI-positive(n = 50) | MVI-negative(n = 63) | P Value | Low-grade (G1–G2)(n = 68) | High-grade (G3–G4)(n = 45) | P value |
| Clinical information | ||||||
| Age (y) | 52.78 ± 8.85 | 55.37 ± 8.44 | .116 | 54.6 ± 9.25 | 53.64 ± 7.81 | .568 |
| Gender, n (%) | .824 | .872 | ||||
| Male | 38 (76.0) | 49 (77.8) | 52 (76.5) | 35 (77.8) | ||
| Female | 12 (24.0) | 14 (22.2) | 16 (23.5) | 10 (22.2) | ||
| Origin of liver disease, n (%) | .649 | .681 | ||||
| Hepatitis B | 44 (88.0) | 53 (84.1) | 58 (85.3) | 39 (86.7) | ||
| Hepatitis C | 2 (4.0) | 5 (7.9) | 5 (7.4) | 2 (4.4) | ||
| Normal | 4 (8.0) | 4 (6.3) | 5 (7.4) | 3 (6.7) | ||
| Hepatic steatosis | 0 (0.0) | 1 (1.7) | 0 (0.0) | 1 (2.2) | ||
| ICG-R15, % | 6.73 ± 5.09 | 8.15 ± 7.75 | .265 | 8.29 ± 7.40 | 6.35 ± 5.40 | .134 |
| MELD Score | 5.72 ± 2.82 | 7.14 ± 4.83 | .069 | 6.66 ± 4.67 | 6.28 ± 3.13 | .634 |
| Child-Pugh class, n (%) | .421 | .627 | ||||
| A | 46 (92.0) | 55 (87.3) | 60 (88.2) | 41 (91.1) | ||
| B | 4 (8.0) | 8 (12.7) | 8 (11.8) | 4 (8.9) | ||
| AFP (ng/mL), n (%) | .063 | .018 | ||||
| ≤20 | 23 (46.0) | 40 (63.5) | 44 (64.7) | 19 (42.2) | ||
| >20 | 27 (54.0) | 23 (36.5) | 24 (35.3) | 26 (57.8) | ||
| Pathological findings | ||||||
| Cirrhosis, n (%) | .639 | .305 | ||||
| Present | 48 (96.0) | 58 (92.1) | 62 (91.2) | 44 (97.8) | ||
| Absent | 2 (4.0) | 5 (7.9) | 6 (8.8) | 1 (2.2) | ||
| Ki67, n (%) | .299 | <.001 | ||||
| ≤50 | 42 (84.0) | 57 (90.5) | 67 (98.5) | 32 (71.1) | ||
| >50 | 8 (16.0) | 6 (9.5) | 1 (1.5) | 13 (28.9) | ||
| Fibrosis stage, n (%) | .359 | .602 | ||||
| S1-S2 | 43 (86.0) | 50 (79.4) | 57 (83.8) | 36 (80.0) | ||
| S3-S4 | 7 (14.0) | 13 (20.6) | 11 (16.2) | 9 (20.0) | ||
| MR imaging features | ||||||
| Maximum diameter (cm), n (%) | .849 | .003 | ||||
| ≤2 | 14 (28.0) | 15 (23.8) | 22 (32.4) | 7 (15.6) | ||
| >2 and ≤5 | 23 (46.0) | 32 (50.8) | 36 (52.9) | 19 (42.2) | ||
| >5 | 13 (26.0) | 16 (25.4) | 10 (14.7) | 19 (42.2) | ||
| Number, n (%) | .985 | .54 | ||||
| Solitary tumor | 42 (84.0) | 53 (84.1) | 56 (82.4) | 39 (86.7) | ||
| ≥Two tumors | 8 (16.0) | 10 (15.9) | 12 (17.6) | 6 (13.3) | ||
| Capsule integrity, n (%) | .427 | .005 | ||||
| Complete | 9 (18.0) | 16 (25.4) | 18 (26.5) | 7 (15.6) | ||
| Incomplete | 24 (48.0) | 23 (36.5) | 20 (29.4) | 27 (60.0) | ||
| Absent | 17 (34.0) | 24 (38.1) | 30 (44.1) | 11 (24.4) | ||
| SIAp | 295.58 ± 71.47 | 254.77 ± 72.33 | .003 | 273.15 ± 73.84 | 272.33 ± 76.23 | .955 |
| SIAp/Al | 1.11 ± 0.14 | 0.94 ± 0.12 | <.001 | 0.98 ± 0.14 | 1.06 ± 0.16 | .007 |
| SIAt | 280.58 ± 87.71 | 305.42 ± 84.60 | .132 | 313.88 ± 87.81 | 265.04 ± 76.38 | .003 |
| SIHp | 350.61 ± 76.22 | 371.71 ± 98.22 | .214 | 365.90 ± 97.72 | 357.06 ± 75.88 | .609 |
| SIHp/Hl | 0.90 ± 0.40 | 0.90 ± 0.20 | .995 | 0.92 ± 0.36 | 0.88 ± 0.19 | .472 |
| SIHt | 254.76 ± 65.65 | 277.56 ± 85.15 | .121 | 281.99 ± 86.96 | 245.55 ± 54.90 | .014 |
| Peritumoral hypointensity on HBP, n (%) | <.001 | .606 | ||||
| Present | 39 (78.0) | 28 (44.4) | 39 (57.4) | 28 (62.2) | ||
| Absent | 11 (22.0) | 35 (55.6) | 29 (42.6) | 17 (37.8) | ||
3.3. Radiological characteristics of MVI and pathological grade
The correlation analysis of the 113 HCC had shown that the SIAp, SIAp/Al, peritumoral hypointensity during HBP showed a significant correlation with MVI (P = .05; r: 0.332, 0.607, and -0.339, respectively) (Table 3). On the other hand, features such as the maximum diameter, number, capsule integrity, SIAt, SIHp, SIHp/Hl and SIHt did not show significant correlation with the MVI-positive (P = .05). The multiple logistic regression analysis of the significant parameters showed that three prediction factors which consisted of high SIAp and SIAp/Al, peritumoral hypointensity during HBP (P = .018) were independently related to MVI-positive HCC (Table 4). ROC showed that SIAp/Al had a higher diagnostic efficacy with the area under the curve (AUC) of 0.851 than peritumoral hypointensity during HBP with AUC of 0.668 and the optimal cutoff value of SIAp/Al was 1.005 with the sensitivity of 0.840 and specificity of 0.794, the positive predictive value (PPV) was 76.4, negative predictive value (NPV) was 86.2 (Fig. 2a, Table 6).
Table 3.
The correlation analysis between parameters and different MVI or pathological groups.
| MVI status | Edmondson–Steiner grades | |||
| Variable | R | P value | r | P value |
| AFP (ng/mL) | 0.222 | .018 | ||
| Ki67 | 0.407 | <.001 | ||
| Maximum diameter (cm) | 0.303 | .001 | ||
| Capsule integrity | −0.076 | .423 | ||
| SIAp | 0.332 | <.001 | ||
| SIAp/Al | 0.607 | <.001 | 0.257 | .006 |
| SIAt | −0.257 | .006 | ||
| SIHt | −0.177 | .061 | ||
| Peritumoral hypointensity on HBP | −0.339 | <.001 | ||
Table 4.
Univariate and multivariate logistic regression analysis between MR imaging features and MVI.
| Univariate analysis | Multivariate analysis | |||||
| Parameters | OR | 95% CI | P value | OR | 95% CI | P value |
| Maximum diameter (cm) | 1.149 | 0.409,3.226 | .85 | |||
| Number | 0.991 | 0.359,2.731 | .985 | |||
| Capsule integrity | 1.473 | 0.633,3.428 | .429 | |||
| SIAp | 1.008 | 1.002,1.014 | .006∗ | 1.003 | 0.996,1.009 | .411 |
| SIAp/Al | 3.603 | 2.106,6.162 | <.001∗ | 3.115 | 1.867,5.198 | <.001 |
| SIAt | 0.997 | 0.992,1.001 | .132 | |||
| SIHp | 0.997 | 0.993,1.002 | .214 | |||
| SIHp/Hl | 1.004 | 0.292,3.448 | .995 | |||
| SIHt | 0.996 | 0.991,1.001 | .128 | |||
| Peritumoral hypointensity on HBP | 4.432 | 1.926,10.199 | <.001∗ | 3.314 | 1.226,8.962 | .018 |
Figure 2.

The ROC curves of radiological features for MVI and pathological grade. (A), The ROC curves of SIAp/Al and peritumoral hypointensity on HBP for assessment MVI, the AUC was 0.851, 0.668. (B), The ROC curves of SIAt and SIAp/Al for differentiating pathological grade, the value of AUC was 0.652, 0.652. ROC = receiver operating characteristic, AUC = area under the receiver operating characteristic.
Table 6.
Diagnostic value of Gd-EOB-DTPA MR imaging parameters in differentiating the MVI and the pathological grade of HCC.
| Group | AUC | P value | Cutoff value | Sensitivity | Specificity | PPV | NPV |
| MVI-positive vs MVI-negative | |||||||
| SIAp/Al | 0.851 | <.001 | 1.005 | 0.840 | 0.794 | 76.400 | 86.200 |
| Peritumoral hypointensity on HBP | 0.668 | .002 | 0.50 | 0.780 | 0.556 | 58.200 | 76.100 |
| Low-grade vs High-grade | |||||||
| SIAp/Al | 0.652 | .003 | 1.089 | 0.444 | 0.882 | 71.400 | 70.600 |
| SIAt | 0.652 | .006 | 347.72 | 0.911 | 0.338 | 47.700 | 85.200 |
Correlation analysis identified the maximum diameter, capsule integrity, SIAp/Al, SIAt and SIHt as related factors for pathological grade (P = .05 for all) (Table 3). In multivariate analysis, the capsule of high-grade HCC was incomplete or absence [OR: 2.721, P = 0.045], and SIAp/Al was higher [OR: 1.437, P = .027] whereas SIAt was lower [OR: 0.993, P = 0.013] compared with low-grade HCC (Table 5). The AUC of SIAp/Al and SIAt in distinguishing high-grade HCC were 0.652(P = 0.003,) and 0.652(P = 0.006), respectively (Fig. 2b, Table 6). And the diagnostic sensitivity and specificity of SIAp/Al were 0.444 and 0.882, and the sensitivity and specificity of SIAt were 0.911 and 0.338, respectively. The optimal cutoff value of SIAp/Al was 1.089.
Table 5.
Univariate and multivariate logistic regression analysis between MR imaging features and pathological grade.
| Univariate analysis | Multivariate analysis | |||||
| Parameters | OR | 95% CI | P value | OR | 95% CI | P value |
| Maximum diameter (cm) | 0.278 | 0.108,0.715 | .005∗ | 0.231 | 0.064,0.836 | .065 |
| Number | 1.393 | 0.482,4.028 | .541 | |||
| Capsule integrity | 3.682 | 1.496,9.064 | .007∗ | 2.721 | 0.993,7.458 | .045 |
| SIAp | 1.000 | 0.995,1.005 | .954 | |||
| SIAp/Al | 1.457 | 1.094,1.941 | .01∗ | 1.437 | 1.042,1.981 | .027 |
| SIAt | 0.993 | 0.988,0.998 | .005∗ | 0.993 | 0.987,0.999 | .013 |
| SIHp | 0.999 | 0.995,1.003 | .605 | |||
| SIHp/Hl | 0.590 | 0.138,2.534 | .478 | |||
| SIHt | 0.993 | 0.986,0.999 | .018∗ | 0.994 | 0.986,1.003 | .182 |
| Peritumoral hypointensity on HBP | 1.225 | 0.567,2.647 | .606 | |||
3.4. Recurrence-free survival of patients after surgery
The 1-, 2-, and 3-year cumulative recurrence-free survival rate of HCC patients with SIAp/Al≥1.1 were 57.1%, 10.7% and 0, respectively, after surgical resection. The 1-, 2-, and 3-year cumulative recurrence-free survival rate of HCC patients with SIAp/Al<1.1 were 85.9%, 69.4%, and 57.6%, respectively, after surgical resection. Recurrence-free survival rate of HCC with SIAp/Al≥1.1 was significantly lower than those with SIAp/Al<1.1 according to the results of the Kaplan–Meier method by the log-rank test (P = .025) (Figs. 3 and 4).
Figure 3.
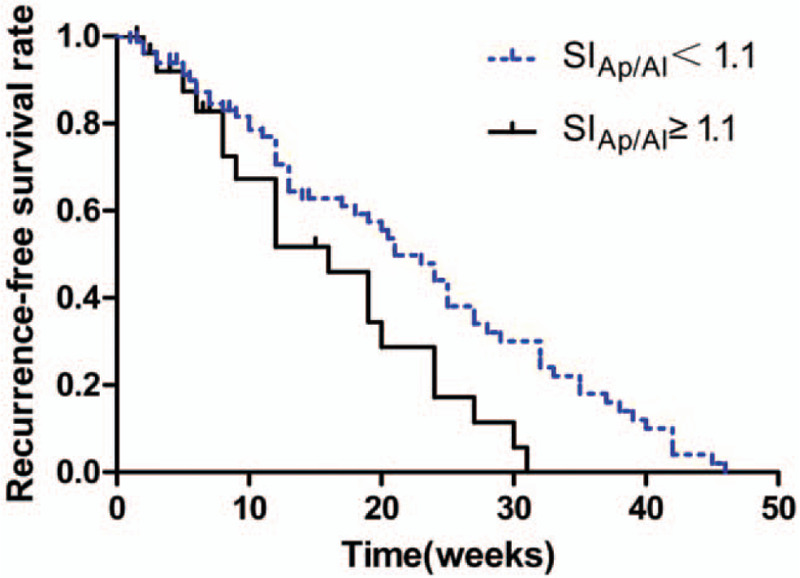
Effect of SIAp/Al ≥1.1and SIAp/Al <1.1 on the recurrence-free survival rate of patients with HCC. HCC patients with SIAp/Al ≥1.1 vs. SIAp/Al <1.1, P =.025. Statistical significance was assessed with the log-rank test.
Figure 4.
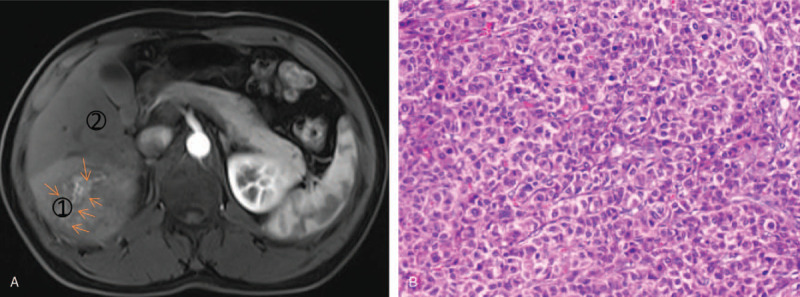
A 56-year old man had HCC recurrence 8 months after surgery. (A) Gd-EOB-DTPA dynamic enhanced MR images show a 6.7 cm hypervascular mass with peritumoral enhancement (arrow) in hepatic segment VI. SIAp/Al is signal intensity ratio of peritumoral tissue (1) to normal liver (2) on arterial phase, the value is 1.34. (B) histopathology slice reveals high-grade HCC with MVI (haematoxylin-eosin stain; original magnification, ×200).
4. Discussion
In this study, we found that SIAp/Al had a preferable ability to preoperative differentiate MVI and pathological grade of HCC noninvasively, in addition, the recurrence-free survival rate was significantly lower in patients with SIAp/Al ≥1.1 compared to those with SIAp/Al<1.1 after curative resection of HCC. Although the imaging findings, including arterial peritumoral enhancement, incomplete capsule, and peritumoral hypointensity during the HBP, were useful for predicting MVI or pathological grade of HCC, our findings for the first time used quantitative enhancement degree on Gd-EOB-DTPA dynamic enhanced MR imaging for evaluating the MVI, pathological grade and prognosis of HCC patients.
It was reported that peritumoral enhancement during the arterial phase in preoperative Gd-EOB-DTPA dynamic enhanced MRI was highly predictive of MVI,[9,16,21] however, the quantification of signal intensity was not performed in these studies. In the present study, the signal intensity was quantified to diagnose MVI or pathological grade of HCC. And the results showed that MVI-positive HCC had high SIAp. We speculated that the underlying mechanisms were that the high SIAp might relate to arterial hyperperfusion changes of peritumoral caused by abnormal proliferation and differentiation of peritumoral microvessel, it showed invasive growth in the peritumoral tissue. However, the background of liver fibrosis or cirrhosis in HCC can influence the SI of liver parenchyma by affecting liver function,[22] in view of this, to exclude the effect of liver fibrosis or cirrhosis on the degree of enhancement of the peritumoral tissue, the SIAp/Al instead of SIAp were used to evaluate the value of radiological findings of peritumoral in diagnosis of MVI. According to the ROC analysis, SIAp/Al showed the preferable AUC value in diagnosis of MVI before surgery, and its sensitivity and specificity were 0.840 and 0.794 with the cutoff value of 1.005. Based on our results, peritumoral hypointensity during HBP in Gd-EOB-DTPA dynamic enhanced MRI suggested the MVI-positive in HCC. The peritumoral hypointensity in the HBP was more frequent in the MVI-positive group might be explained by that the changes of peritumoral perfusion and hemodynamic resulting from damaged peritumoral hepatocytes and obstructed drainage veins, it could reduce the uptake of Gd-EOB-DTPA.[23–25] The results of univariate and multivariate analyses showed that the peritumoral hypointensity during HBP was an independent risk factor for MVI, which is consistent with previous reports.[10,26]
Only a few MR imaging findings were used to be noninvasive prediction of pathological grade of HCC, such as tumor size, multifocal tumors, and vascular invasion, but remains poorly explored. In our study, we found that some quantitative imaging features had a certain diagnostic value for differentiating pathological grade of HCC. In the multivariate analysis, capsule integrity, SIAp/Al, or SIAt independently related to the pathological grade. The capsule refers to the proliferating fibrous connective tissues encircling the tumor which is caused by the growth of the tumor. It shows a hyperintensity ring during the portal or equilibrium phase. Our data indicated that incomplete and absent capsules were more likely to occur in the high–grade HCC, probably because the tumors with complete capsule might help limit the growth of cancers and did not invade surrounding liver tissues,[27] showing the lower aggressiveness.[28] The results of multivariate analysis showed that capsule integrity was an independent risk factor for pathological grade (P = .045), however the diagnosis ability was not ideal (P = .05). The SIAp/Al correlated positively with the pathological grade of HCC in the present study and the reason might be that the peritumoral tissues were the area of proliferation and differentiation of abnormal blood vessels as a predilection site for micro-metastasis.[12] And the low SIAt on Gd-EOB-DTPA enhanced MR images showed the existence of the high-grade HCC, which could be explained by that the supply of arterial blood significantly decreased as the histopathology grade progress in the advanced HCC.[29] The results of the ROC analysis suggested that SIAp/Al and SIAt had a potential ability to differentiate the high-grade HCC. Although the AUC of SIAp/Al with the cutoff value of 1.089 was the same as that of SIAt, the specificity of SIAp/Al (0.882) for evaluating high-grade HCC was higher than that of SIAt (0.338). Otherwise, according to our results, AFP and Ki67 between the low and the high-grade HCC showed significant difference (P < .05), but no significant difference between MVI-positive group and MVI-negative group, it could be attributed to sample bias or sample size.
MVI and pathological grade are important prognostic factors for early recurrence after hepatic resection of HCC,[8,30–33] which significantly affect the prognosis of patients. We investigated whether the significant SI findings could assess of MVI and pathological grade, a further prediction of recurrence. The present results verified that the value of SIAp/Al in the image before operation could diagnose the MVI and pathological grade of HCC. Moreover, the cumulative recurrence-free survival rate of HCC patients with SIAp/Al≥1.1 on Gd-EOB-DTPA enhanced MR images before operation decreased year by year, and dropped to 0 in the third year. The cumulative recurrence-free survival rate of HCC patients with SIAp/Al<1.1 also declined, and the overall survival rate of HCC patients with SIAp/Al<1.1 was higher than that of the patients with SIAp/Al≥1.1. Therefore, based on the present findings, the SIAp/Al showed the diagnostic ability to differentiate both the MVI and the pathological grade of HCC noninvasively. Additionally, the SIAp/Al on Gd-EOB-DTPA enhanced MR images before operation could predict the early recurrence of HCC patients after resection, which provided the novel strategy for the optimization of treatment plan.
Peritumoral enhancement on arterial phase and peritumoral hypointensity on HBP had been reported that close associated with MVI of HCC, but few of study explored the relationship between SI of peritumoral tissue in the arterial phase or HBP and MVI, thus the present study chose SI of peritumoral tissue on arterial phase (SIAp) and HBP (SIHp) to quantitative analysis the relationship between radiological features and MVI, pathological grade of HCC.
We noted that the present study had several limitations. Firstly, our study was a single-center study, which might be possible to show selection bias. And the multi-centric cohorts should perform to validate these promising results. Secondly, the HCC patients with Child C were not included in the present study, because the patients with the severe liver dysfunction could not tolerate the surgery, and it may be difficult to evaluate the SIAp/Al in these patients. Thirdly, we only focus on 2-dimensional ROI measurements of HCC lesion, we will further analysis the radiomics features of 3-dimensional ROI of HCC lesion in the future. Therefore, further research is required to build a more accurate diagnostic model of MVI and pathological grade in HCC patients.
In conclusion, based on our findings, SIAp/Al had strong potential ability to diagnose MVI and differentiate pathological grade of HCC noninvasively, furthermore, the SIAp/Al on Gd-EOB-DTPA enhanced MR images before operation may act as an indicator to predict the prognosis of HCC after surgery.
Author contributions
Data curation: Jun-Feng Li, Jin-Kui Li.
Funding acquisition: Jun-Feng Li.
Investigation: Shun-Lin Guo.
Software: Yong-Sheng Xu, Yu Dou.
Supervision: Jun-Qiang Lei.
Writing – original draft: Li-Li Wang.
Writing – review & editing: Li-Li Wang.
Footnotes
Abbreviations: AFP = alpha-fetoprotein, AUC = area under the curve, CI = confidence interval, CT = computed tomography, Gd-EOB-DTPA = gadolinium ethoxybenzyl diethylenetriamine pentaacetic acid, HBP = hepatobiliary phase, HCC = hepatocellular carcinoma, ICG-R15 = indocyanine green retention rate at 15 min, MELD = model for end-stage liver disease, MRI = magnetic resonance imaging, MVI = microvascular invasion, OR = odds ratio, ROC = receiver operating characteristic, SI = signal intensity.
How to cite this article: Wang LL, Li JF, Lei JQ, Guo SL, Li JK, Xu YS, Dou Y. The value of the signal intensity of peritumoral tissue on Gd-EOB-DTPA dynamic enhanced MRI in assessment of microvascular invasion and pathological grade of hepatocellular carcinoma. Medicine. 2021;100:20(e25804).
This study was supported by the Health Industry Research Project in Gansu Province (GSWSKY2018-24); the National Natural Science Foundation (81800528); the National Natural Science Foundation (81960323); the Key Research and Development Project of Gansu Province(20YF2FA011); the Scientific Research Projects of the Universities in Gansu Province(2018B-009); the Hospital Fund from the First Hospital of Lanzhou University (ldyyyn2018-12).
The authors have no conflicts of interest to disclose.
The datasets generated during and/or analyzed during the present study are available from the corresponding author on reasonable request.
AFP: alpha-fetoprotein; MELD: Model for End-Stage Liver Disease.
ICG-R15: indocyanine green retention rate at 15 min; MVI: microvascular invasion
Unless otherwise indicated, data are numbers of patients, with percentages in parentheses.
Data are continuous variables, reported as medians with interquartile ranges in parentheses (25th–75th percentiles).
Data are means ± standard deviation.
SI: signal intensity; HBP: hepatobiliary phase; SIAp: SI of peritumoral tissue on arterial phase; SIAl: SI of normal liver on arterial phase; SIAp/Al: SIAp/SIAl; SIAt: SI of tumor parenchyma on arterial phase; SIHp: SI of peritumoral tissue on HBP; SIHl: SI of normal liver on HBP; SIHp/Hl: SIHp/SIHl;SIHt: SI of tumor parenchyma on HBP
AFP = alpha-fetoprotein, SI = signal intensity, SIAp = SI of peritumoral tissue on arterial phase, SIAl = SI of normal liver on arterial phase, SIAp/Al = SIAp/SIAl, SIAt = SI of tumor parenchyma on arterial phase, HBP = hepatobiliary phase, SIHt = SI of tumor parenchyma on HBP.
CI, confidence interval; HBP, hepatobiliary phase; OR, odds ratio; SI: signal intensity; SIAp: SI of peritumoral tissue on arterial phase; SIAl: SI of normal liver on arterial phase; SIAp/Al: SIAp/SIAl; SIAt: SI of tumor parenchyma on arterial phase; SIHp: SI of peritumoral tissue on HBP; SIHl: SI of normal liver on HBP; SIHp/Hl: SIHp/SIHl; SIHt: SI of tumor parenchyma on HBP.
Statistically significant results from logistic regression analysis. Variables with P < .05 in univariate logistic regression analysis were applied to a multivariate logistic regression analysis.
AUC = area under the receiver operating characteristic, PPV = positive predictive value, NPV = negative predictive value, HBP = hepatobiliary phase, SI = signal intensity, SIAp = SI of peritumoral tissue on arterial phase, SIAl = SI of normal liver on arterial phase, SIAp/Al = SIAp/SIAl, SIAt = SI of tumor parenchyma on arterial phase.
References
- [1].Collaborators GMaCoD global, regional, and national life expectancy, all-cause mortality, and cause-specific mortality for 249 causes of death, 1980-2015: a systematic analysis for the Global Burden of Disease Study 2015. Lancet (London England) 2016;388:1459–544. [DOI] [PMC free article] [PubMed] [Google Scholar]
- [2].Siegel RL, Miller KD, Jemal A. Cancer statistics, 2018. CA Cancer J Clin 2018;68:07–30. [DOI] [PubMed] [Google Scholar]
- [3].Kudo M, Trevisani F, Abou-Alfa GK, et al. Hepatocellular carcinoma: therapeutic guidelines and medical treatment. Liver Cancer 2016;6:16–26. [DOI] [PMC free article] [PubMed] [Google Scholar]
- [4].European Association for the Study of the Liver. Liver EAFTSOT clinical practice guidelines: management of hepatocellular carcinoma. Journal of Hepatol 2018;69:182–236. [DOI] [PubMed] [Google Scholar]
- [5].Yamashita YI, Imai K, Yusa T, et al. Microvascular invasion of single small hepatocellular carcinoma </=3 cm: predictors and optimal treatments. Ann Gastroenterol Surg 2018;2:197–203. [DOI] [PMC free article] [PubMed] [Google Scholar]
- [6].Rodriguez-Peralvarez M, Luong TV, Andreana L, et al. A systematic review of microvascular invasion in hepatocellular carcinoma: diagnostic and prognostic variability. Ann Surg Oncol 2013;20:325–39. [DOI] [PubMed] [Google Scholar]
- [7].Gu J, Zhang X, Wang Z, et al. Simplified nomograms based on platelet-associated models for survival prediction in Asian hepatocellular carcinoma patients after surgery. Surg Oncol 2019;30:131–8. [DOI] [PubMed] [Google Scholar]
- [8].Ren Z, He S, Fan X, et al. Survival prediction model for postoperative hepatocellular carcinoma patients. Medicine 2017;96:e7902. [DOI] [PMC free article] [PubMed] [Google Scholar]
- [9].Renzulli M, Brocchi S, Cucchetti A, et al. Can current preoperative imaging be used to detect microvascular invasion of hepatocellular carcinoma? Radiology 2016;279:432–42. [DOI] [PubMed] [Google Scholar]
- [10].Lee S, Kim SH, Lee JE, et al. Preoperative gadoxetic acid-enhanced MRI for predicting microvascular invasion in patients with single hepatocellular carcinoma. J Hepatol 2017;67:526–34. [DOI] [PubMed] [Google Scholar]
- [11].Lee JM, Yoon JH, Joo I, et al. Recent advances in CT and MR imaging for evaluation of hepatocellular carcinoma. Liver Cancer 2012;1:22–40. [DOI] [PMC free article] [PubMed] [Google Scholar]
- [12].Choi JY, Lee JM, Sirlin CB. CT and MR imaging diagnosis and staging of hepatocellular carcinoma: part II. Extracellular agents, hepatobiliary agents, and ancillary imaging features. Radiology 2014;273:30–50. [DOI] [PMC free article] [PubMed] [Google Scholar]
- [13].Kim HD, Lim YS, Han S, et al. Evaluation of early-stage hepatocellular carcinoma by magnetic resonance imaging with gadoxetic acid detects additional lesions and increases overall survival. Gastroenterology 2015;148:1371–82. [DOI] [PubMed] [Google Scholar]
- [14].Shin SK, Kim YS, Choi SJ, et al. Characterization of small (</=3 cm) hepatic lesions with atypical enhancement feature and hypointensity in hepatobiliary phase of gadoxetic acid-enhanced MRI in cirrhosis: A STARD-compliant article. Medicine 2017;96:e7278. [DOI] [PMC free article] [PubMed] [Google Scholar]
- [15].Chen J, Chen C, Xia C, et al. Quantitative free-breathing dynamic contrast-enhanced MRI in hepatocellular carcinoma using gadoxetic acid: correlations with Ki67 proliferation status, histological grades, and microvascular density. Abdom Radiol 2018;43:1393–403. [DOI] [PubMed] [Google Scholar]
- [16].Dong Z, Huang K, Liao B, et al. Prediction of sorafenib treatment-related gene expression for hepatocellular carcinoma: preoperative MRI and histopathological correlation. Eur Radiol 2019;29:2272–82. [DOI] [PubMed] [Google Scholar]
- [17].Cao L, Chen J, Duan T, et al. Diffusion kurtosis imaging (DKI) of hepatocellular carcinoma: correlation with microvascular invasion and histologic grade. Quant Imaging Med Surg 2019;9:590–602. [DOI] [PMC free article] [PubMed] [Google Scholar]
- [18].Zhang L, Yu X, Wei W, et al. Prediction of HCC microvascular invasion with gadobenate-enhanced MRI: correlation with pathology. Eur Radiol 2020. [DOI] [PubMed] [Google Scholar]
- [19].Bosman F, Carneiro F, Hruban R. WHO classification tumours of the digestive system. Lyon: IARC Press; 2010. [Google Scholar]
- [20].Edmondson HA, Steiner PE. Primary carcinoma of the liver: a study of 100 cases among 48,900 necropsies. Cancer 1954;7:462–503. [DOI] [PubMed] [Google Scholar]
- [21].Kim H, Park MS, Choi JY, et al. Can microvessel invasion of hepatocellular carcinoma be predicted by pre-operative MRI? Eur Radiol 2009;19:1744–51. [DOI] [PubMed] [Google Scholar]
- [22].Yoneyama T, Fukukura Y, Kamimura K, et al. Efficacy of liver parenchymal enhancement and liver volume to standard liver volume ratio on Gd-EOB-DTPA-enhanced MRI for estimation of liver function. Eur Radiol 2014;24:857–65. [DOI] [PubMed] [Google Scholar]
- [23].Kim KA, Kim MJ, Jeon HM, et al. Prediction of microvascular invasion of hepatocellular carcinoma: usefulness of peritumoral hypointensity seen on gadoxetate disodium-enhanced hepatobiliary phase images. J Magn Reson Imaging 2012;35:629–34. [DOI] [PubMed] [Google Scholar]
- [24].Nishie A, Asayama Y, Ishigami K, et al. Clinicopathological significance of the peritumoral decreased uptake area of gadolinium ethoxybenzyl diethylenetriamine pentaacetic acid in hepatocellular carcinoma. J Gastroenterol Hepatol 2014;29:561–7. [DOI] [PubMed] [Google Scholar]
- [25].Shin SK, Kim YS, Shim YS, et al. Peritumoral decreased uptake area of gadoxetic acid enhanced magnetic resonance imaging and tumor recurrence after surgical resection in hepatocellular carcinoma: a STROBE-compliant article. Medicine 2017;96:e7761. [DOI] [PMC free article] [PubMed] [Google Scholar]
- [26].Kim JY, Kim MJ, Kim KA, et al. Hyperintense HCC on hepatobiliary phase images of gadoxetic acid-enhanced MRI: correlation with clinical and pathological features. Eur J Radiol 2012;81:3877–82. [DOI] [PubMed] [Google Scholar]
- [27].Ng IO, Lai EC, Ng MM, et al. Tumor encapsulation in hepatocellular carcinoma. A pathologic study of 189 cases. Cancer 1992;70:45–9. [DOI] [PubMed] [Google Scholar]
- [28].Lim JH, Choi D, Park CK, et al. Encapsulated hepatocellular carcinoma: CT-pathologic correlations. Eur Radiol 2006;16:2326–33. [DOI] [PubMed] [Google Scholar]
- [29].Asayama Y, Yoshimitsu K, Nishihara Y, et al. Arterial blood supply of hepatocellular carcinoma and histologic grading: radiologic-pathologic correlation. AJR Am J Roentgenol 2008;190:W28–34. [DOI] [PubMed] [Google Scholar]
- [30].Cucchetti A, Piscaglia F, Caturelli E, et al. Comparison of recurrence of hepatocellular carcinoma after resection in patients with cirrhosis to its occurrence in a surveilled cirrhotic population. Ann Surg Oncol 2009;16:413–22. [DOI] [PubMed] [Google Scholar]
- [31].Lim KC, Chow PK, Allen JC, et al. Microvascular invasion is a better predictor of tumor recurrence and overall survival following surgical resection for hepatocellular carcinoma compared to the Milan criteria. Ann Surg 2011;254:108–13. [DOI] [PubMed] [Google Scholar]
- [32].Hirokawa F, Hayashi M, Miyamoto Y, et al. Outcomes and predictors of microvascular invasion of solitary hepatocellular carcinoma. Hepatol Res 2014;44:846–53. [DOI] [PubMed] [Google Scholar]
- [33].Lee S, Kim KW, Jeong WK, et al. Gadoxetic acid-enhanced MRI as a predictor of recurrence of HCC after liver transplantation. Eur Radiol 2020;30:987–95. [DOI] [PubMed] [Google Scholar]