. 2021 May 20;10:e63711. doi: 10.7554/eLife.63711

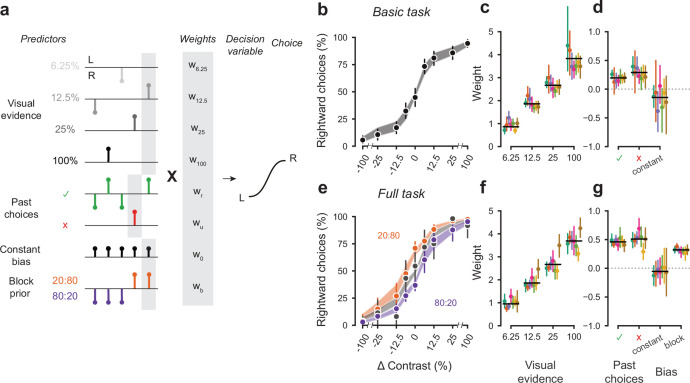
Figure 5. A probabilistic model reveals a common strategy across mice and laboratories.

(a) Schematic diagram of predictors included in the GLM. Each stimulus contrast (except for 0%) was included as a separate predictor. Past choices were included separately for rewarded and unrewarded trials. The block prior predictor was used only to model data obtained in the full task. (b) Psychometric curves from the example mouse across three sessions in the basic task. Shadow represents 95% confidence interval of the predicted choice fraction of the model. Points and error bars represent the mean and across-session confidence interval of the data. (c-d) Weights for GLM predictors across labs in the basic task, error bars represent the 95% confidence interval across mice. (e-g), as b-d but for the full task.

Figure 5.

Figure 5—figure supplement 1. History-dependent choice updating.

Figure 5—figure supplement 1.

(a) Representing each animal’s ‘history strategy’, defined as the bias shift in their psychometric function as a function of the choice made on the previous trial, separately for when this trial was rewarded or unrewarded. Each animal is shown as a dot, with lab-averages shown larger colored dots. Contours indicate a two-dimensional kernel density estimate across all animals. The red arrow shows the group average in the basic task at its origin, and in the full task at its end (replicated between the left and right panel). (b) as a, but with the strategy space corrected for slow fluctuations in decision bound (Lak et al., 2020a). When taking these slow state-changes into account, the majority of animals use a win-stay lose-switch strategy. (c) History-dependent choice updating, after removing the effect of slow fluctuations in decision bound, as a function of the previous trial’s reward and stimulus contrast. After rewarded trials, choice updating is largest when the visual stimulus was highly uncertain (i.e. had low contrast) but strongly diminished after more certain, rewarded trials. This is in line with predictions from Bayesian models, where an agent continually updates its beliefs about the upcoming stimuli with sensory evidence (Lak et al., 2020a; Mendonça et al., 2018). Appendices.
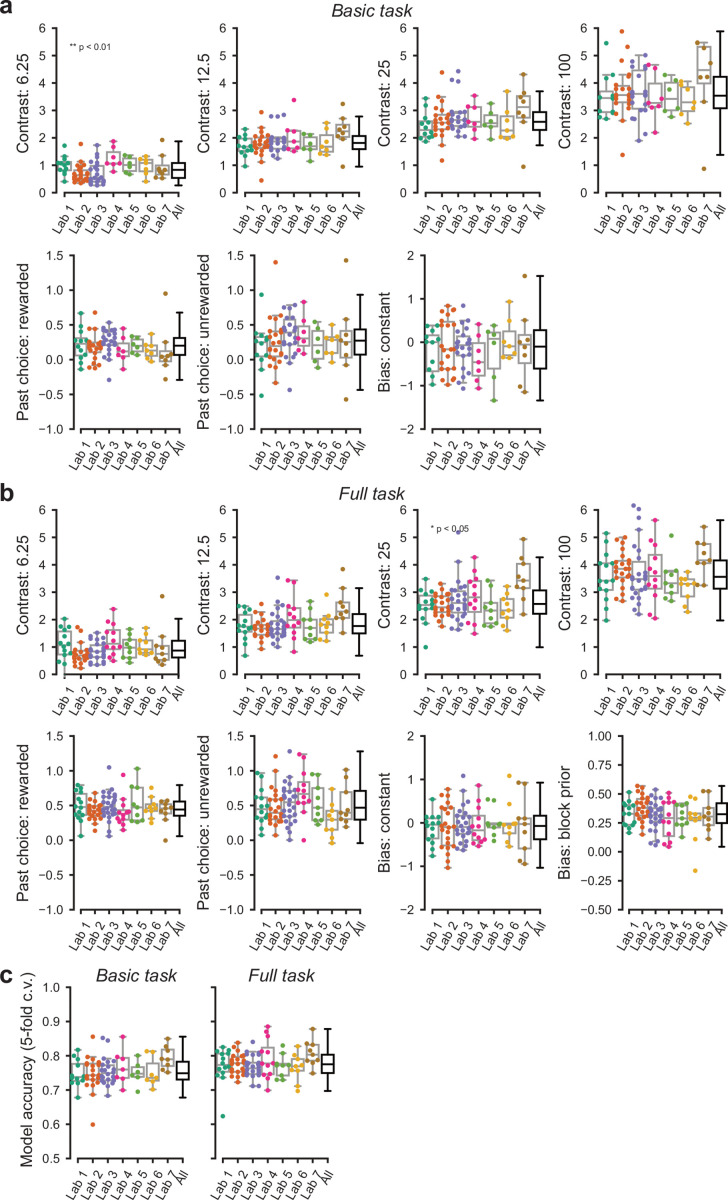
Figure 5—figure supplement 2. Parameters of the GLM model of choice across labs.
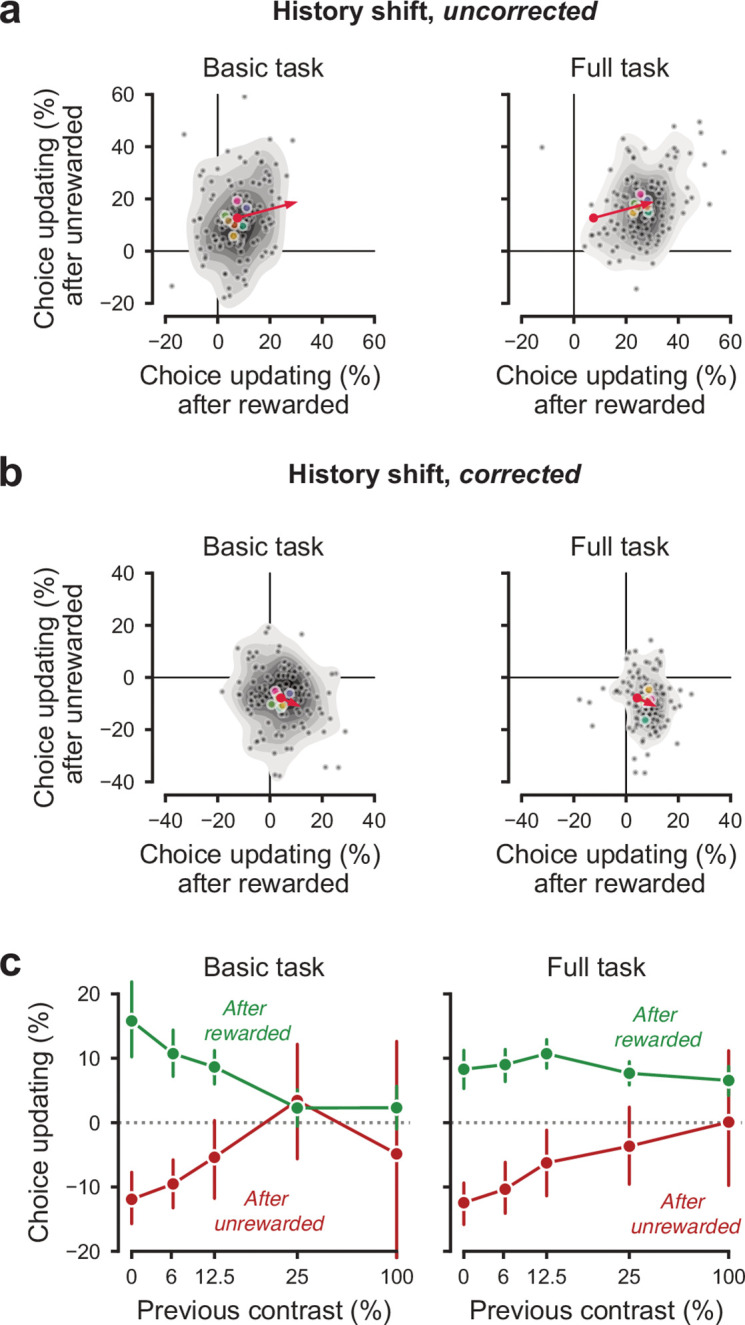
Figure 5—figure supplement 2.

(a) Parameters of the GLM model for data obtained in the basic task. (b) Same, for the full task the additional panel shows the additional parameter, that is the bias shift in the two blocks. Each point represents the average accuracy for each mouse. (c) Cross validated accuracy of the GLM model across mice and laboratories. Predictions were considered accurate if the GLM predicted the actual choice with >50% chance.