Abstract
Background & Aims:
Liver transplant priority in the US and Europe follows the ‘sickest-first ‘principle. However, for patients with hepatocellular carcinoma (HCC), priority is based on binary tumor criteria (e.g., Milan) to expedite transplant for patients with ‘acceptable’ post-transplant outcomes. Newer risk scores developed to overcome limitations of these binary criteria (e.g., Metroticket, HALT-HCC) are insufficient to be used for waitlist priority as they focus solely on HCC-related pre-transplant variables. We sought to develop a risk score to predict post-transplant survival for HCC patients using HCC- and non-HCC related variables.
Methods:
Retrospective cohort study using national registry data of adult deceased-donor liver transplant (DDLT) recipients with HCC from 2/27/02–12/31/18. We fit Cox regression models focused on 5- and 10-year survival to estimate beta coefficients for a risk score using manual variable selection and calculated absolute predicted survival time and compared it to available risk scores.
Results:
Among 6,502 adult HCC LT recipients, 11 variables were selected in the final model. The AUC’s at 5- and 10-years were: 0.62, 95% CI: 0.57–0.67 and 0.65, 95% CI: 0.58–0.72, which was not statistically significantly different than the Metroticket and HALT-HCC scores. The LiTES-HCC score was able to discriminate patients based on post-transplant survival among those meeting Milan and UCSF.
Conclusion:
We developed and validated a risk score to predict post-transplant survival for patients HCC. By including HCC- and non-HCC related variables (e.g., age, chronic kidney disease), this score could allow transplant professionals to prioritize patients with HCC in terms of predicted survival. In the future, this score could be integrated into survival benefit-based models to lead to meaningful improvements in life-years at the population-level.
Keywords: prediction, transplant, survival
Lay summary:
We created a risk score to predict how long patients with liver cancer will live if they get a liver transplant. In the future, this could be used to decide which waitlisted patients should get the next transplant.
Graphical Abstract
Introduction
Waitlist priority for a liver transplant (LT) in the US and Europe follows the ‘sickest-first’ principle. Yet the ascertainment of ‘sickest’ differs for the two main types of patients needing LT: decompensated cirrhosis and hepatocellular carcinoma (HCC). For the majority of LT candidates, waitlist priority is based on their calculated Model for End-Stage Liver Disease (MELD) score, a predictor of short-term (90-day) risk of death if not transplanted.1 However, approximately 20% of patients are transplanted despite low MELD scores, most notably patients with HCC. For these patients, the risk of waitlist death is mainly attributable to HCC progression, and those with the greatest tumor burden have the highest risk of waitlist dropout and subsequent death, but the worst post-transplant survival and highest recurrence risk.2,3 In an attempt to limit transplant to those with reasonable post-transplant outcomes, HCC waitlist priority (i.e., MELD exceptions) has relied on binary criteria (e.g., Milan, University of California-San Francisco [UCSF]) to exclude those for whom ‘unacceptable’ risks of cancer recurrence were expected.4,5 In the US, all patients within these criteria receive the same waitlist priority, and the only ‘tiebreaker’ is waiting time (e.g., a 50 year-old with hepatitis B has the same priority as a 75 year-old with non-alcoholic steatohepatitis (NASH), diabetes, and chronic kidney disease [CKD]). As a result, some transplant leaders have raised concerns that the current allocation system for HCC has led to “thousands of years of lost survival benefit.”6
Although the approach to HCC prioritization relies heavily on excluding patients with an increased risk of post-transplant recurrence, the binary criteria (within vs beyond Milan/UCSF criteria) have limitations. They cannot stratify patients based on predicted survival and lack granularity to: 1) estimate survival benefit of transplant; 2) counsel patients on expected outcomes relative to other non-transplant potentially curative options (e.g., resection); and 3) compare expected overall post-transplant survival of HCC vs non-HCC patients. There have been attempts to develop continuous HCC post-transplant risk models, notably the Metroticket and Hazard Associated with Liver Transplantation for Hepatocellular Carcinoma (HALT-HCC) scores.7–13 Although these scores provide superior prediction of post-transplant survival, they are insufficient allocation tools. First, they only include HCC-specific variables, even though the majority of post-transplant deaths in HCC recipients are not from recurrent HCC.7–12,14 Secondly, the populations in which the scores were developed and validated do not generalize to the US HCC population, especially as it relates to etiologies of liver disease (e.g., only 6.2% of the HALT-HCC validation cohort had NASH).7–13 The latter point is critical as NASH is the fastest growing indication for LT for HCC in the US, and is associated with key co-morbidities (e.g., diabetes) not accounted for in the Metroticket or HALT-HCC scores.15
To change the paradigm of transplant allocation to consider post-transplant survival (or survival benefit) necessitates the development of continuous risk scores to rank order HCC and non-HCC patients based on their predicted survival over appropriate time horizons, accounting for the full spectrum of clinical variables that impact overall survival. Therefore, our objectives were to: 1) develop and internally validate a continuous risk score to predict post-transplant survival for patients with HCC over 5- and 10-year time horizons (the Liver Transplant Expected Survival HCC [LiTES-HCC]); and 2) compare this score’s predictive accuracy and discrimination to existing models.
Methods
This retrospective cohort study included adult (≥18 years) deceased donor LT (DDLT) recipients with HCC from 2/28/2002–12/31/2018 using data obtained from the Organ Procurement and Transplantation Network (OPTN)/United Network for Organ Sharing (UNOS). We included only adults because HCC is rare in children and excluded patients with incidental HCC identified on explant. Because the current HCC exception priority paradigm requires a waiting period of ≥6 months from waitlisting to receive exception points, we excluded HCC recipients with <6 months of waiting time to restrict to patients eligible for waitlist priority in the current system.4,16 This insured all patients had ≥2 data points for evaluating tumor and alpha-fetoprotein (AFP) data. Because outcomes for LT recipients with hepatitis C virus (HCV) in the pre-direct acting antiviral era were inferior to other diagnoses, but are now similar, we excluded HCV LT recipients pre-2014.17
Outcome
The outcome was patient survival, and patients alive as of 6/31/2019 were censored. We focused on overall survival, rather than HCC-specific survival because: 1) net-benefit allocation would have to focus on overall survival to account for HCC and non-HCC patients, and 2) determination of cancer-specific survival is subject to bias,18 and requires center-level data not available in OPTN/UNOS.
Predictors
We evaluated HCC- and non-HCC related pre-transplant variables as potential predictors to include into a score at the time of an organ offer to rank patients (i.e., as is done with MELD). HCC-specific variables were obtained from the OPTN/UNOS waitlist history and exception files (data required to be submitted to OPTN/UNOS every 3 months to maintain waitlist priority) and were selected using published data: a) AFP: initial, pre-transplant, minimum, maximum, mean, median, difference between initial and pre-transplant, pre-transplant AFP relative to peak, and AFP response;11,12,19–22; b) tumor size or number: maximum tumor number, size, and total tumor diameter at any time, total tumor number and diameter pre-transplant, maximum tumor size pre-transplant, change in tumor number from listing to transplant (non-viable tumors counted as a 0), and change in total tumor diameter from listing to transplant (centers report non-viable tumors as 0 cm);5,10,11,23 and c) pre-specified interactions of maximum AFP and etiology of liver disease, and pre-transplant AFP and etiology of liver disease.24 A tumor was defined based on OPTN/UNOS coding of a radiographically (or biopsy-proven) HCC ≥1cm (OPTN/UNOS does not quantify percentage viability). These variables are all required as part of applications (and renewals) for MELD exceptions.
HCC non-specific variables included: a) waitlisting: sex, race/ethnicity, diabetes, etiology of liver disease, prior transplant; b) pre-transplant: age, bilirubin, INR, albumin, ventilation, location, body mass index (BMI) as calculated based on height/weight, and adjusted for ascites25; and c) renal function. Renal function was modeled several ways: 1) dialysis in the week pre-LT; 2) estimated glomerular filtration rate (eGFR) using the Modification of Diet in Renal Disease (MDRD)-4 equation; and 3) CKD—eGFR <60 mL/min/1.73m2 at every time point during 90-day pre-LT period.26,27 The MDRD-4 equation was used given its routine application in clinical practice and available OPTN/UNOS data, and eGFR was used, rather than creatinine, as creatinine is a poor marker of renal function in patients with cirrhosis, and a source of gender disparities in MELD-based allocation.28 We evaluated interactions of diabetes and age and CKD and NASH.
We modeled continuous variables seven ways: linear, reciprocal, natural log, square root, cube root, squared, and cubed. We determined the optimal functional form using graphical summaries while maximizing the slope (r) and chi-square statistic in LOWESS plots evaluating the relationship between the variable and the unadjusted hazard ratio for survival. We decided a priori to include a limited set of variables that predict survival without a transplant (INR and bilirubin1) to develop a survival benefit-based approach to LT.
Statistical analysis
The primary objective was to develop a clinically applicable risk score to order patients with HCC based on predicted post-LT survival. Therefore, we focused on developing predictive models that best predicted the outcome, in contrast to explanatory models that evaluate causal pathways by focusing on statistically significant associations between covariates and the outcome.29,30 We used an 80% training sample and 20% validation sample, a standard method, because the focus of model development is model training, and therefore it is necessary to dedicate more observations to that.31–33 Although a different split may have yielded narrower confidence intervals in the validation cohort, limiting the size of the training cohort negatively impacts the model/variable selection process.
We first fit Cox regression models at two time-points—5 and 10 years post-LT—to estimate the model’s beta coefficients (i.e., to identify covariates associated with survival). However, because our focus was on developing a predictive model, the results of the Cox model - with respect to p-values - did not determine which variables were selected for the model, but rather provided the beta coefficients to be used in the risk score.1,12,29,30,34,35 We sequentially added variables to time-dependent receiver operating characteristic (ROC) curves using Cox regression models and the aforementioned beta coefficients until the area under the curve (AUC) for the model increased by <0.001.36,37 We selected variables that increased the 5- and/or 10-year model’s AUC by ≥0.001 without decreasing the AUC of the model at the other time-point, to maximize AUC while developing as parsimonious a model as possible. We then estimated absolute survival time by estimating the area under the curve for the Kaplan-Meier survival function in SAS. We did not perform goodness-of-fit tests as this is used to determine how well an explanatory model accounts for the outcome, and is not intended to assess the quality of predictive models where the entire goal is accurate prediction of an outcome.29
To transform the score into a format to use in clinical practice (e.g., our online calculator: https://amantero.shinyapps.io/LiTES/), we implemented three steps: 1) multiplied XBETA by −1 in order to make higher scores ‘better’ (longer survival); 2) exponentiated the score to convert it off the log scale; and 3) multiplied this score by 50 to generate a scale that would appear familiar to users of the MELD score. To graphically present data, we categorized the validation cohort into 4 groups: a) >1 standard deviation (SD) below the mean; b) 0–1 SD’s below the mean; c) 0–1 SD’s above the mean; and d) >1 SD’s above the mean.
We compared the prediction accuracy of the LiTES-HCC score to the Metroticket and HALT-HCC scores by: 1) comparing each models’ AUC’s at 1, 3-, 5-, and 10-year timepoints; and 2) evaluating the observed survival based on Metroticket and HALT-HCC score quartiles within LiTES-HCC score categories (bottom 25%, 25%−75%, and top 25%). Lastly, we calculated observed survival, based on LiTES-HCC score categories relative to binary HCC criteria (i.e., Milan, UCSF, Metroticket 2.0).5,11,23,38
Lastly, we independently assessed the ability to develop a risk score using Random Forest methods that accounted for all possible recipient variables in OPTN/UNOS data and allowed the algorithm to select variables as needed.39
Analyses were conducted using SAS Version 9.4. The study was deemed exempt by the Institutional Review Boards at the University of Miami and the University of Pennsylvania.
Results
Among 6,502 adult HCC LT recipients in the overall cohort (training + validation dataset), the median age was 62 years (IQR: 57–66) and 4,906 (75.5%) were male. The most common etiologies of liver disease were HCV (43.0%) and NASH (18.1%). In the cohort, 6,224 (95.7%) were transplanted with Milan criteria. The unadjusted 1-, 3-, 5-, and 10-year survival was: 92.5% (95% CI: 91.8–93.2 %), 83.8% (95% CI: 82.7–84.8%), 76.2% (95% CI: 74.7–77.6%), and 60.1% (95% CI: 57.5–62.6%), respectively, and did not differ (log-rank p-value=0.31) for patients in the training vs validation cohorts.
Most of the demographic and clinical characteristics were statistically significantly different between those versus those who died during follow-up (Supplementary Table 1). Among the 1,178 post-transplant deaths (18.1% of overall cohort), 950 (80.6%) had a cause of death coded in OPTN/UNOS data, with less than one-quarter due to recurrent HCC (n=228, 24.0%), while 217 (22.8%) from a non-HCC malignancy, 142 (15.0%) from cardiovascular disease, and 110 (11.6%) infectious-related. Of the 217 who died from a non-HCC malignancy, 133 (68.1%) had free text identifying the specific tumor type: a) 42 (31.6%) primary lung; b) 33 (24.8%) pancreatico-biliary (15/33 had available explant pathology data and 15/15 had evidence of pure HCC on explant); c) 16 (12.0%) other (e.g., sarcoma); d) 12 (9.0%) luminal gastrointestinal (e.g., esophageal); e) 12 (9.0%) metastatic adenocarcinoma, small cell carcinoma, or squamous cell carcinoma of unknown primary; f) 10 (7.5%) head and neck; g) 6 (4.5%) leukemia/lymphoma; and h) 2 (1.5%) skin.
Model selection
The 11 variables (and two interaction terms) in the final model based on our pre-specified AUC criteria (Methods) were: age, bilirubin, CKD, INR, diabetes, etiology of liver disease, difference between total tumor diameter at transplant versus total tumor diameter at waitlisting, difference between pre-transplant and waitlisting AFP, pre-transplant location, pre-transplant ventilation, interaction between diabetes and age, and interaction between CKD and NASH (Table 1). Variables with a positive beta coefficient (e.g., CKD) were predictive of an increased risk of post-transplant mortality. The AUC of the model in the training cohort was: a) 1-year: 0.59 (0.55–0.62); b) 3-year: 0.60 (0.58–0.63); c) 5-year: 0.63 (0.60–0.65); and d) 10-year: 0.68 (0.65–0.72).
Table 1:
Beta coefficients and hazard ratios of variables in LiTES risk score for HCC survival
| Variable | Beta coefficient | Standard error | Hazard ratio |
|---|---|---|---|
| (Age in year)3 | 2.2 x 10⁻⁶ | 5.49 x 10⁻⁷ | 1.00 |
| Ln(bilirubin)*† | 0.037 | 0.059 | 1.04 |
| CKD pre-transplant | 0.17 | 0.13 | 1.18 |
| INR* | 0.035 | 0.067 | 1.04 |
| eGFR at transplant* | −0.0013 | 0.002 | 0.999 |
| Diabetes | −0.28 | 0.66 | 0.76 |
| Etiology of liver disease, No. (%)‡ | |||
| Other | Reference | Reference | Reference |
| HCV | −0.001 | 0.11 | 0.999 |
| NASH | −0.10 | 0.12 | 0.90 |
| Alcohol | 0.024 | 0.11 | 1.02 |
| HBV | −0.32 | 0.13 | 0.73 |
| Difference of TTD at transplant and TTD at listing** | −0.014 | 0.02 | 0.99 |
| Difference between initial and pre-transplant AFP | 2.38 x 10⁻⁴ | 3.39 x 10⁻⁵ | 1.00 |
| Ventilated prior to transplant | 0.71 | 0.37 | 2.04 |
| Pre-transplant location | |||
| Home | Reference | Reference | Reference |
| Hospital | −0.15 | 0.16 | 0.86 |
| ICU | 0.19 | 0.20 | 1.21 |
| Diabetes * age | 0.0072 | 0.01 | 1.01 |
| Pre-OLT CKD * NASH | 0.18 | 0.20 | 1.20 |
Abbreviations: CKD=chronic kidney disease; INR=international normalized ratio; eGFR=estimated glomerular filtration rate; HCV=hepatitis C virus; HBV=hepatitis B virus; NASH=non-alcoholic steatohepatitis; TTD=total tumor diameter; AFP=alpha-fetoprotein; ICU=intensive care unit; CKD=chronic kidney disease
Laboratory data signify last value in the OPTN/UNOS dataset prior to transplant
Bilirubin also included as a linear value: beta coefficient=0.00987, standard error=0.11, HR=1.01
Other diagnoses include but not limited to: autoimmune hepatitis, primary biliary cholangitis, primary sclerosing cholangitis, hereditary hemochromatosis
Tumor diameter based on viable tumor ≥1cm based on data reported to OPTN/UNOS
Model validation
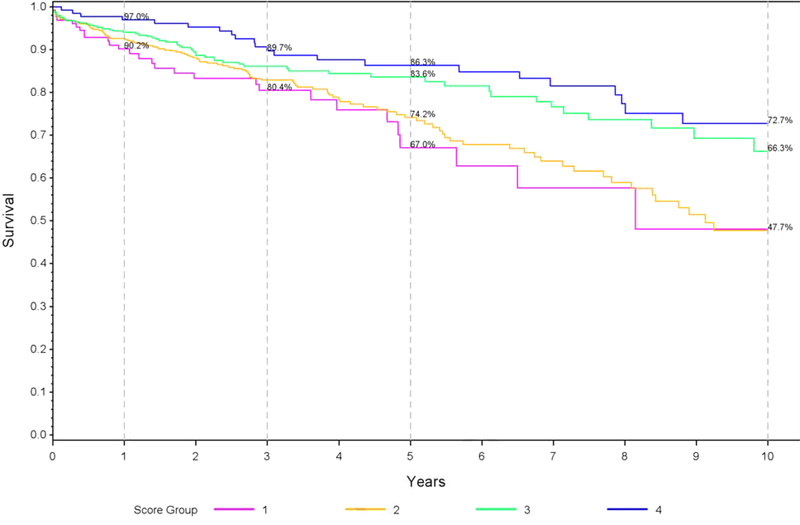
The AUC’s in the validation dataset were: a) 5-years: 0.62, 95% CI: 0.57–0.67; and b) 10-years: 0.65, 95% CI: 0.58–0.72. The group with the highest (‘best’) score had a 1-year survival of 97.0% versus 90.2% in the group with the lowest (‘worst’) score (Figure 1a). This difference was more pronounced with longer follow-up: 86.3% vs 67.0% survival at 5 years and 72.7% vs 47.73% at 10 years (Figure 1a).
Figure 1 (three panels): Observed survival probabilities and mean survival times based on LiTES-HCC score in validation cohort*.
a. Figure 1a: Observed survival probabilities
b. Figure 1b: Observed mean survival time and 95% CI over 5-year time horizon
c. Figure 1c: Observed mean survival time and 95% CI over 10-year time horizon
In absolute terms, the observed mean survival time across the 4 groups ranged from 4.17 years for the ‘worst’ group to 4.63 years for the ‘best’ group over a 5-year horizon (Figure 1b; range 3.86–4.82 years), and 6.98 years for the ‘worst’ group to 8.62 years for the ‘best’ group over a 10-year horizon (Figure 1c; range 6.03–9.16 years). Table 3 displays 5 sample patients who were transplanted with the same waitlist priority by virtus of being within Milan criteria, yet have markedly different predicted survival based on their LiTES score.
Table 3:
Comparison of predicted post-transplant survival for 5 sample patients transplanted for HCC within Milan criteria
 |
 |
 |
 |
 |
|
|---|---|---|---|---|---|
| Age at transplant | 71 | 70 | 65 | 67 | 54 |
| Pre-transplant CKD | Yes | No | No | No | No |
| Total bilirubin | 0.6 | 2.6 | 3.3 | 0.5 | 0.5 |
| INR | 1.0 | 1.8 | 1.4 | 1.3 | 1.1 |
| eGFR, mL/min/1.73m2 | 55 | 47.5 | 115 | 76 | 76.0 |
| Diabetes | Yes | Yes | No | No | No |
| Location | Home | Home | Home | Home | Home |
| Etiology of liver disease | NASH | NASH | HCV | HBV | HBV |
| Ventilated | No | No | No | No | No |
| AFP at listing | 91 | 19 | 39 | 4 | 11 |
| AFP at transplant | 224 | 20 | 11 | 7 | 14 |
| Total tumor diameter at listing | 4.5 | 4.3 | 2.9 | 2.1 | 2.9 |
| Total tumor diameter at transplant | 3.7 | 4.9 | 1.5 | 2.1 | 2.9 |
| LiTES Score† | 14.2 | 19.7 | 27.9 | 38.2 | 52.7 |
| Predicted post-transplant survival time based on LiTES | |||||
| 5-year time horizon | 4.07 | 4.17 | 4.34 | 4.50 | 4.66 |
| 10-year time horizon | 6.80 | 7.14 | 7.63 | 8.16 | 8.72 |
Abbreviations: eGFR=estimate glomerular filtration rate
Tumor size based on center to OPTN/UNOS and decreased sizes reflect changes from loco-regional therapy
LiTES score calculated based on coefficients from Table 1, with predicted survival time based on based on the survival curves developed in the validation cohort.
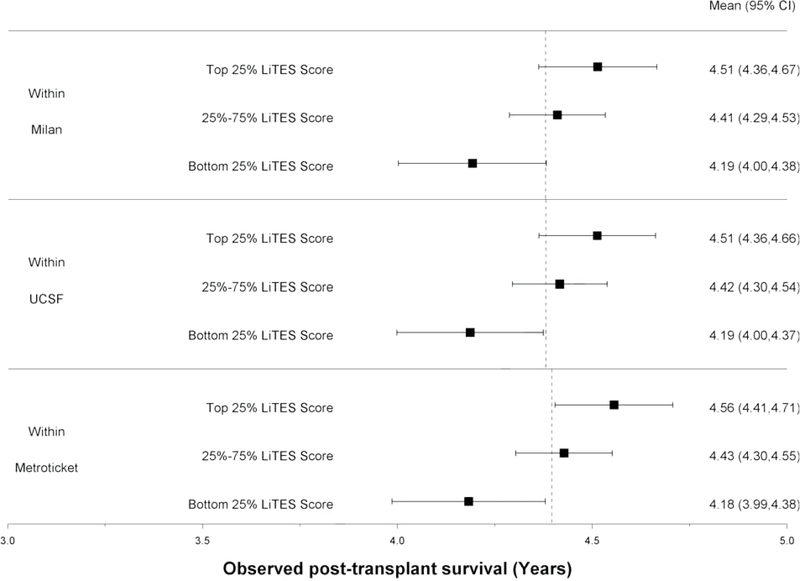
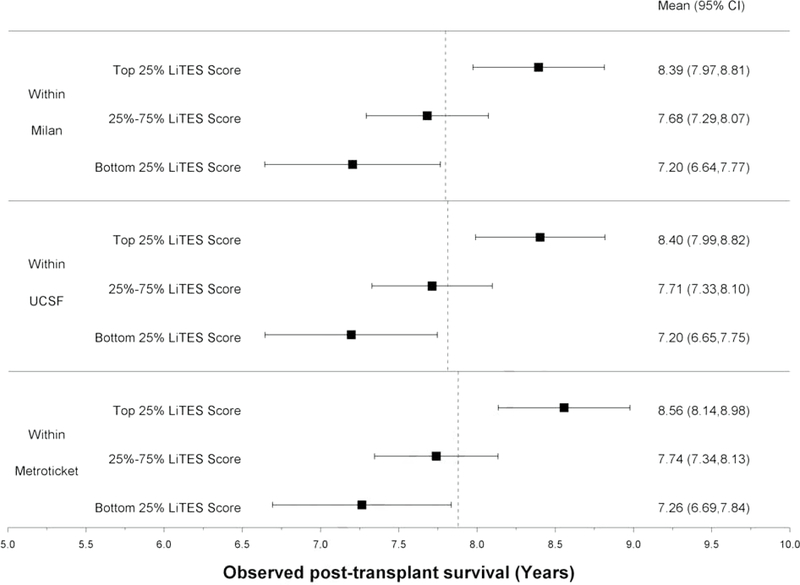
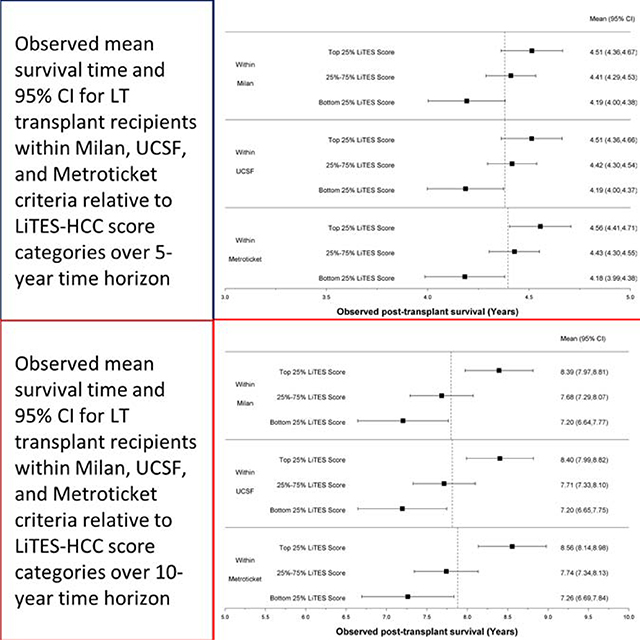
The LiTES-HCC score was able to discriminate patients based on their post-transplant survival among those meeting Milan, UCSF, and/or Metroticket criteria, with a spread in observed survival based on the LiTES-HCC score (Figures 2a and 2b). For example, over a 5-year horizon, the observed survival for patients within Milan or UCSF criteria varied as much as 0.7 years among those in the bottom versus top quartile of LiTES-HCC score values (Figure 2a; comparing maximum range in across quartiles). Over a 10-year time horizon, the range of observed survival was more than 2 years among patients in the bottom versus top quartile of LiTES-HCC score (Figure 2b).
Figure 2 (two panels): Observed survival times for patients within Milan, UCSF, and Metroticket criteria relative to LiTES-HCC score categories.
a. Figure 2a: Observed mean survival time and 95% CI over 5-year time horizon
b. Figure 2b: Observed mean survival time and 95% CI over 10-year time horizon
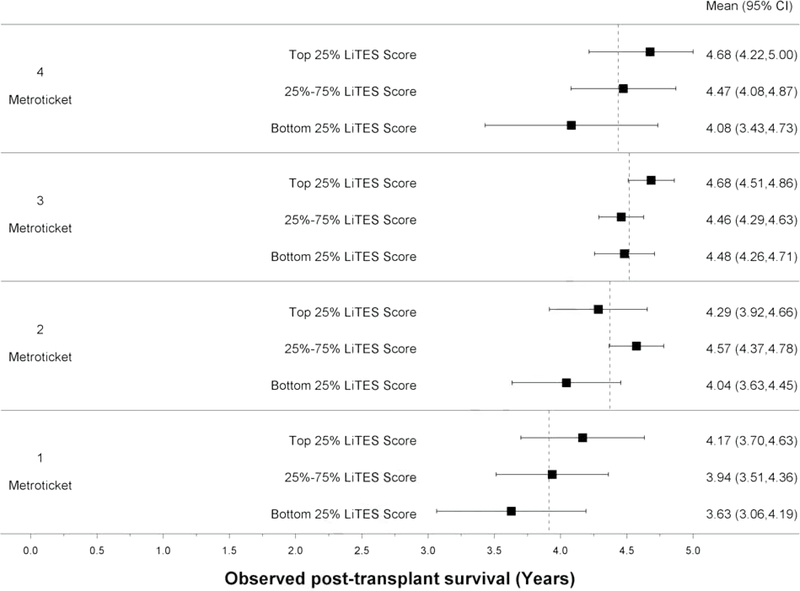
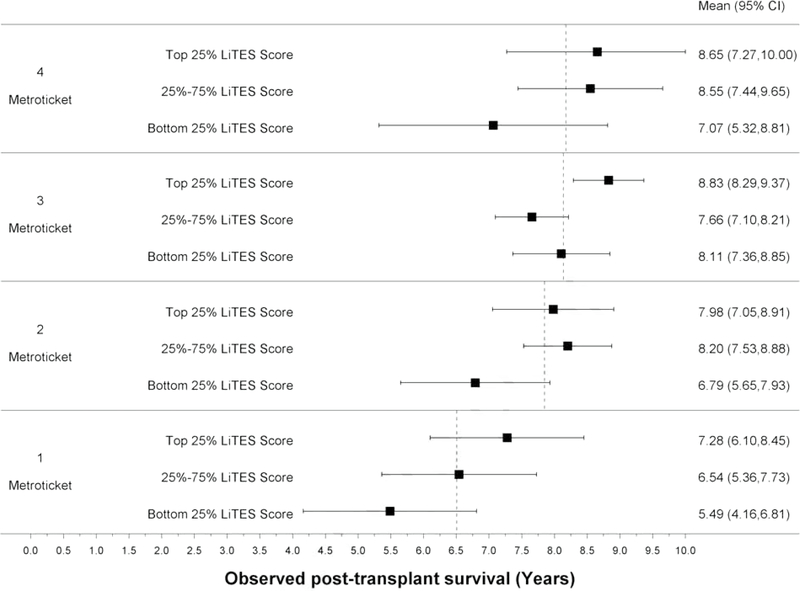
Compared to the Metroticket score (continuous and binary), the LiTES-HCC score had an AUC that was numerically (but not statistically significantly) higher at 5- and 10-years (Table 2). When the Metroticket score was divided into quartiles, there were large spreads in observed survival based on a patient’s LiTES-HCC score (Figures 3a and 3b). For example, among patients with the ‘best’ Metroticket score (labeled ‘4’ in Figure 3a), the observed survival ranged by more than 1.5 years over a 5-year horizon based on the LiTES-HCC score (Figure 3a). These differences were more pronounced over a 10-year horizon, with a range of nearly 3 years among transplant recipients in the top quartile of Metroticket scores, and a range of more than 4 years in the bottom quartile of Metroticket scores (labeled ‘1’ in Figure 3b).
Table 2:
Comparison of AUC and Harrell C for LiTES score with that of the HALT-HCC and Metroticket scores for predicting post-transplant overall survival
| 1-year AUC | 3-year AUC | 5-year AUC | 10-year AUC | Harrell C | |
|---|---|---|---|---|---|
| LiTES score | 0.60 (0.53–0.66) | 0.57 (0.52–0.62) | 0.62 (0.57–0.67) | 0.65 (0.58–0.72) | 0.58 |
| HALTHCC score | 0.59 (0.53–0.65) | 0.59 (0.54–0.64) | 0.60 (0.55–0.65) | 0.54 (0.45–0.64) | 0.59 |
| Metroticket (continuous) | 0.55 (0.49–0.61) | 0.57 (0.52–0.62) | 0.57 (0.53–0.62) | 0.52 (0.43–0.61) | 0.56 |
| Metroticket (binary) | 0.50 (0.37–0.62) | 0.51 (0.39–0.64) | 0.52 (0.39–0.64) | 0.52 (0.39–0.66) | 0.51 |
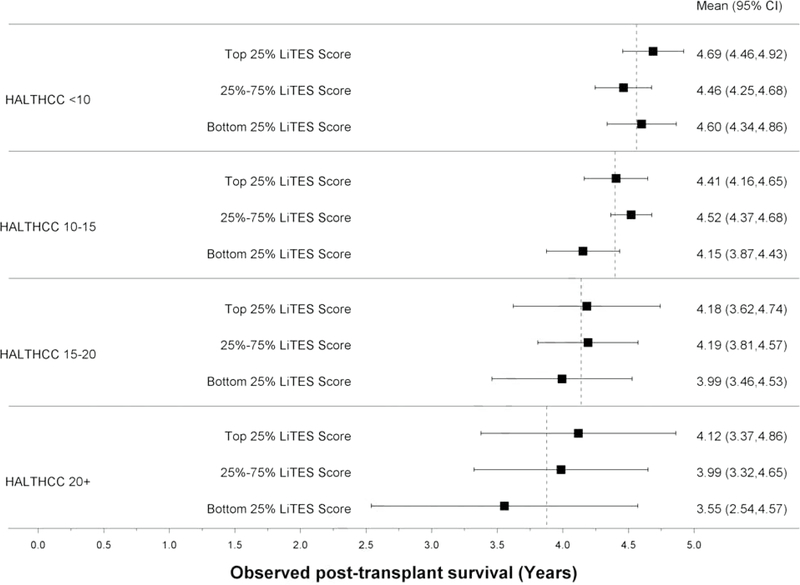
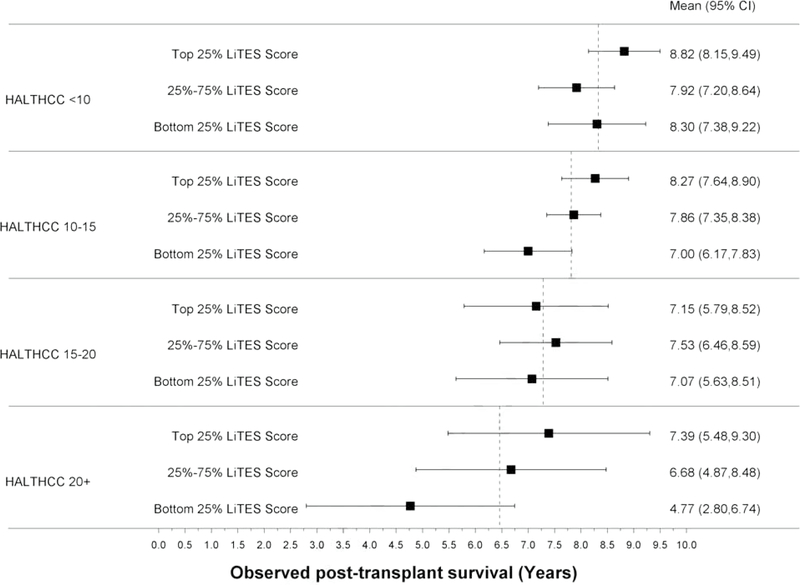
Figure 3 (four panels): Observed survival times within quartiles of Metroticket and HALT-HCC scores relative to LiTES-HCC score categories.
a. Figure 3a: Observed mean survival time and 95% CI over 5-year time horizon for continuous Metroticket
b. Figure 3b: Observed mean survival time and 95% CI over 10-year time horizon for continuous Metroticket
c. Figure 3c: Observed mean survival time and 95% CI over 5-year time horizon for continuous HALT-HCC
d. Figure 3d: Observed mean survival time and 95% CI over 10-year time horizon for continuous HALT-HCC
The LiTES-HCC score had a numerically (but not statistically significantly) higher AUC than the HALT-HCC score only at 10 years (Table 2). Similar to the Metroticket score, there were large spreads in observed survival when the HALT-HCC score was divided into categories (Figures 3c and 3d).
In the secondary analysis, there was overlap, albeit incomplete, in the variables selected in the primary model and the Random Forest model, with similar AUCs for the Random Forest models: 0.61 (5 years) and 0.63 (10 years). HCC transplant recipients with the lowest (‘worst’) LiTES scores were most likely to have “high-risk” features on explant pathology, while those with the highest (‘best’) scores were the least likely to have such features (Supplementary Table 2). The presence of these features was not associated with death from HCC.
Discussion
Pre-transplant risk stratification for patients with HCC has largely focused on binary criteria to identify patients with ‘acceptable’ recurrence-free survival. As a result, transplant candidates meeting these criteria receive the same waitlist prioritization in any given allocation area, despite the potential for substantial differences in post-transplant survival, with only waiting time as a tiebreaker. Using nearly 17 years of data, we developed and validated a risk score to rank order patients transplanted with HCC based on their projected post-transplant survival. By incorporating HCC and non-HCC related variables, this score advances our ability to predict post-transplant survival among HCC patients, which could be used to compare predicted outcomes to non-HCC patients. In the future, these models could represent an important step in a larger effort to transform the way we prioritize patients by incorporating pre- and post-transplant data into a holisitic survival benefit-based allocation system.
Waitlist priority for a LT in the US is applied differently for patients with decompensated cirrhosis and HCC. Patients with decompensated cirrhosis are prioritized based on their calculated MELD score, while patients with HCC receive extra priority via MELD exceptions. However, unlike the continuous MELD score which ranks patients using objective criteria, the only ‘tiebreaker’ for patients with HCC is waiting time (all patients with exceptions in a given allocation area receive the same score), a flawed allocation principle that favors people who are “well-off, who become informed, and travel more quickly.”40 As a result, use of these binary criteria hinder the field’s ability to select patients with HCC with the best predicted survival. As shown in Figure 2, patients within Milan criteria who receive the same waitlist priority can have survival differences of more than 8 months over a 5-year horizon, and more than 2 years over a 10-year horizon. On a population level, with more than 1,000 transplants for HCC annually in the US (and thousands more abroad), changes to HCC prioritization that incorporate post-transplant survival as a consideration could translate to thousands of more years in survival gains post-transplantation. Furthermore, in clinical practice, the use of binary cutpoints for tumor criteria has led to marked variability in practice with respect to under-reporting of HCC burden across geographic regions and individual centers.41
To overcome limitations of binary transplant criteria, other scoring systems have been developed.7–13 The recalibrated HALT-HCC score had superior prediction accuracy to other models, yet was not different than our LiTES score. However, from the perspective of a risk score for liver allocation, especially for a US population, the Metroticket and HALT-HCC scores have important limitations overcome by the LiTES score. First, the patient population in those studies differed from a US cohort of HCC transplant recipients. Most notably, few patients in the HALT-HCC studies had fatty liver disease (≈6%);7–9 in the US, NASH is the fastest growing indication for LT for HCC, present in nearly 20% of HCC LT recipients.42 Second, the Metroticket and HALT-HCC scores include only HCC-specific variables, yet the majority of deaths in transplant recipients with HCC are not from recurrent HCC.7–12,14 The prevalence of NASH (with associated high rates of diabetes and CKD) and recipient age are highly relevant to the US transplant population, and were important predictors in our model.15,43 Highlighting the limitations of the Metroticket and HALT-HCC scores as standalone tools to predict post-transplant survival are that fact that a 50 year-old with NASH would have the same predicted survival as a 75 year-old with NASH, diabetes, and CKD, provided they have identical HCC-specific variables. This lacks biologic plausibility, as these two patients have significantly different survival, is reflected in their having different LiTES scores, and therefore different priority in an allocation system that included the LiTES score. Other scores that incorporate pathologic data have been developed, but these cannot be used to risk stratify patients pre-transplant. Although there was an association between a patient’s LiTES score and “high-risk” features on explant pathology, this did not correlate with HCC-related mortality, and HCC recurrence is not captured in OPTN/UNOS data.
Our LiTES-HCC HCC score helps to overcome the limitations of the current process of prioritizing patients with HCC and existing HCC post-transplant risk models. First, it includes variables that are part of routine practice. Second, it includes non-HCC variables that impact post-transplant survival. Third, it provides an output of absolute predicted post-transplant survival time that is understandable to patients and providers. This transparent output enables LiTES-HCC to function as a tool to counsel patients better about expected outcomes, especially in relation to other potentially curative treatment options for HCC outside of LT. The benefits of the LiTES score to discriminate predicted post-transplant survival among patients with the same waitlist priority is highlighted in Table 3.
The AUC of our model (and other HCC scores) was less than the traditional 0.8 cut-off. This may be due to limitations in OPTN/UNOS data of factors that could improve prediction (e.g., frailty data, severity of co-morbidities such as diabetes). Future studies leveraging center-level data could determine whether they increase the model’s AUC. Despite the AUC, the LiTES score could still be applied to liver allocation, and potentially yield thousands of years of additional survival at the population level, as the AUC is not the sole determinant of a model’s performance.29,30,34,44 The AUC is a measure of a model’s ability to correctly classify patients with vs without an outcome, or for time-to-event outcomes, to rank order two patients based on predicted survival. It does not measure a score’s ability to rank a series of patients, to place patients into buckets (e.g., high- vs low-risk), to rank order multiple subjects, and may be biased with censored outcomes.34,44 As shown in Figures 2a and 2b, patients in the top quartile of LiTES score had a predicted mean survival that was significantly higher than those in the bottom quartile at the 5- and 10-year time horizons. For example, a patient with a LiTES score in the bottom quartile had a predicted survival over a 10-year time horizon of 6.98 years, compared to 8.6 years for a patient in the top quartile. On a patient-level, 1.5 years is sizable, and is substantial when considering the broader population allocated an organ based on binary criteria, with waiting time as the tiebreaker. Therefore in practice, while the LiTES score may not be a tool to rank order two patients with similar scores, it could be a valuable tool (e.g., a tiebreaker) for patients with very different scores for whom we have a high degree confidence have meaningful differences in expected survival. Furthermore, the AUC of the LiTES-HCC score is similar to the recipient risk model and allograft risk score used in kidney allocation in the US,45 underscoring that risk scores with AUC’s similar to ours are deemed important enough by policymakers to be incorporated into allocation policies. Additionally, LiTES-HCC builds upon work suggesting that incorporating HCC-MELD (based on MELD score and logAFP) would provide more equity in prioritizing HCC patients relative to non-HCC patients when focused on transplant benefit.35
Our study has limitations. First, although there are no upper limits of HCC (e.g., tumor size) that exclude a patient from being transplanted, only those meeting specific criteria receive MELD exceptions. As a result, our models were limited to already-selected patients. Nevertheless, the range in observed survival was more than 8 months over a 5-year time horizon, and more than 2 years over a 10-year time horizon. Second, we could not account for some potential confounders not in OPTN/UNOS data, such as cardiovascular disease or frailty. However, all centers perform cardiovascular risk stratification.46 Future iterations could incorporate center-level data on frailty were they uniformly collected in a standardized fashion (unlike Karnofsky score data in OPTN/UNOS).47 Lastly, we did not assess the impact of Modified Response Evaluation Criteria in Solid Tumors (mRECIST) criteria, because it cannot be reliably assessed in OPTN/UNOS data, and may lead to bias if incorporated into allocation without central radiological review and uniform reader training.7,13,48
In conclusion, the LiTES-HCC score can provide an assessment of expected post-transplant survival. This score would allow the transplant community to better prioritize patients with HCC by identifying those with the best predicted post-transplant survival while providing important data for patients and providers. If integrated into practice with models that account for survival without a transplant, this score could lead to major gains in public health benefit by accurately prioritizing patients with the greatest expected survival benefit from transplantation. A similar approach to allocation of livers for non-HCC patients should be considered in order to take a broader perspective of distributive justice in the context of allocation for all patients being considered for a liver transplant.
Supplementary Material
HCC patients frequently die of non-HCC cause after liver transplant.
Inclusion of non-HCC variables improve the discrimination of HCC risk score.
Allocation based on predicted survival could improve population-level outcomes.
Acknowledgments
Financial support statement: This work was funded by NIH R01 DK120561 (Dr. Goldberg: PI). Dr. Goldberg has received research grant support paid to his institution from Gilead, Abbvie and Merck, and has received consulting fees from Pfizer for topics unrelated to this manuscript. Dr. Reese receives research grant support, paid to his institution, from Abbvie and Merck. None of the authors report any relevant financial support
Footnotes
Conflict of interest statement: None of the authors have any relevant conflicts of interest as it pertains to this work
Data availability statement: The data are publicly available from OPTN/UNOS, but the authors are not able to share the data due to restrictions in the data use agreement. However, the source code used to create the final datasets and to run the models are available from the corresponding author, upon reasonable request.
Publisher's Disclaimer: This is a PDF file of an unedited manuscript that has been accepted for publication. As a service to our customers we are providing this early version of the manuscript. The manuscript will undergo copyediting, typesetting, and review of the resulting proof before it is published in its final form. Please note that during the production process errors may be discovered which could affect the content, and all legal disclaimers that apply to the journal pertain.
References
- 1.Kamath PS, Wiesner RH, Malinchoc M, Kremers W, Therneau TM, Kosberg CL, et al. A model to predict survival in patients with end-stage liver disease. Hepatology. 2001;33(2):464–470. [DOI] [PubMed] [Google Scholar]
- 2.Vitale A, Cucchetti A, Qiao GL, Cescon M, Li J, Ramirez Morales R, et al. Is resectable hepatocellular carcinoma a contraindication to liver transplantation? A novel decision model based on “number of patients needed to transplant” as measure of transplant benefit. Journal of hepatology. 2014;60(6):1165–1171. [DOI] [PubMed] [Google Scholar]
- 3.Vitale A, Huo TL, Cucchetti A, Lee YH, Volk M, Frigo AC, et al. Survival Benefit of Liver Transplantation Versus Resection for Hepatocellular Carcinoma: Impact of MELD Score. Ann Surg Oncol. 2015;22(6):1901–1907. [DOI] [PubMed] [Google Scholar]
- 4.Alver SK, Lorenz DJ, Marvin MR, Brock GN. Projected outcomes of 6-month delay in exception points versus an equivalent Model for End-Stage Liver Disease score for hepatocellular carcinoma liver transplant candidates. Liver transplantation. 2016;22(10):1343–1355. [DOI] [PubMed] [Google Scholar]
- 5.Yao FY, Hirose R, LaBerge JM, Davern TJ 3rd, Bass NM, Kerlan RK Jr., et al. A prospective study on downstaging of hepatocellular carcinoma prior to liver transplantation. Liver transplantation. 2005;11(12):1505–1514. [DOI] [PubMed] [Google Scholar]
- 6.Berry K, Ioannou GN. Comparison of Liver Transplant-Related Survival Benefit in Patients With Versus Without Hepatocellular Carcinoma in the United States. Gastroenterology. 2015;149(3):669–680. [DOI] [PubMed] [Google Scholar]
- 7.Firl DJ, Kimura S, McVey J, Hashimoto K, Yeh H, Miller CM, et al. Reframing the approach to patients with hepatocellular carcinoma: Longitudinal assessment with hazard associated with liver transplantation for HCC (HALTHCC) improves ablate and wait strategy. Hepatology. 2018;68(4):1448–1458. [DOI] [PubMed] [Google Scholar]
- 8.Sasaki K, Firl DJ, Hashimoto K, Fujiki M, Diago-Uso T, Quintini C, et al. Development and validation of the HALT-HCC score to predict mortality in liver transplant recipients with hepatocellular carcinoma: a retrospective cohort analysis. The lancet Gastroenterology & hepatology. 2017;2(8):595–603. [DOI] [PubMed] [Google Scholar]
- 9.Firl DJ, Sasaki K, Agopian VG, Gorgen A, Kimura S, Dumronggittigule W, et al. Charting the Path Forward for Risk Prediction in Liver Transplant for Hepatocellular Carcinoma: International Validation of HALTHCC Among 4,089 Patients. Hepatology. 2020;71(2):569–582. [DOI] [PubMed] [Google Scholar]
- 10.Mazzaferro V, Llovet JM, Miceli R, Bhoori S, Schiavo M, Mariani L, et al. Predicting survival after liver transplantation in patients with hepatocellular carcinoma beyond the Milan criteria: a retrospective, exploratory analysis. Lancet Oncol. 2009;10(1):35–43. [DOI] [PubMed] [Google Scholar]
- 11.Mazzaferro V, Sposito C, Zhou J, Pinna AD, De Carlis L, Fan J, et al. Metroticket 2.0 Model for Analysis of Competing Risks of Death After Liver Transplantation for Hepatocellular Carcinoma. Gastroenterology. 2018;154(1):128–139. [DOI] [PubMed] [Google Scholar]
- 12.Notarpaolo A, Layese R, Magistri P, Gambato M, Colledan M, Magini G, et al. Validation of the AFP model as a predictor of HCC recurrence in patients with viral hepatitis-related cirrhosis who had received a liver transplant for HCC. Journal of hepatology. 2017;66(3):552–559. [DOI] [PubMed] [Google Scholar]
- 13.Cucchetti A, Serenari M, Sposito C, Di Sandro S, Mosconi C, Vicentin I, et al. Including mRECIST in the Metroticket 2.0 criteria improves prediction of hepatocellular carcinoma-related death after liver transplant. Journal of hepatology. 2020. [DOI] [PubMed] [Google Scholar]
- 14.Fisher RA, Kulik LM, Freise CE, Lok AS, Shearon TH, Brown RS, Jr., et al. Hepatocellular carcinoma recurrence and death following living and deceased donor liver transplantation. American Journal of Transplantation. 2007;7(6):1601–1608. [DOI] [PMC free article] [PubMed] [Google Scholar]
- 15.Younossi Z, Stepanova M, Ong JP, Jacobson IM, Bugianesi E, Duseja A, et al. Nonalcoholic Steatohepatitis Is the Fastest Growing Cause of Hepatocellular Carcinoma in Liver Transplant Candidates. Clinical gastroenterology and hepatology. 2019;17(4):748–755. [DOI] [PubMed] [Google Scholar]
- 16.Heimbach JK, Hirose R, Stock PG, Schladt DP, Xiong H, Liu J, et al. Delayed hepatocellular carcinoma model for end-stage liver disease exception score improves disparity in access to liver transplant in the United States. Hepatology. 2015;61(5):1643–1650. [DOI] [PMC free article] [PubMed] [Google Scholar]
- 17.Cotter TG, Paul S, Sandikci B, Couri T, Bodzin AS, Little EC, et al. Improved Graft Survival After Liver Transplantation for Recipients With Hepatitis C Virus in the Direct-Acting Antiviral Era. Liver transplantation. 2019;25(4):598–609. [DOI] [PubMed] [Google Scholar]
- 18.Penston J Should we use total mortality rather than cancer specific mortality to judge cancer screening programmes? Yes. BMJ. 2011;343:d6395. [DOI] [PubMed] [Google Scholar]
- 19.Duvoux C, Roudot-Thoraval F, Decaens T, Pessione F, Badran H, Piardi T, et al. Liver transplantation for hepatocellular carcinoma: a model including alpha-fetoprotein improves the performance of Milan criteria. Gastroenterology. 2012;143(4):986–994. [DOI] [PubMed] [Google Scholar]
- 20.Halazun KJ, Tabrizian P, Najjar M, Florman S, Schwartz M, Michelassi F, et al. Is it Time to Abandon the Milan Criteria?: Results of a Bicoastal US Collaboration to Redefine Hepatocellular Carcinoma Liver Transplantation Selection Policies. Annals of surgery. 2018;268(4):690–699. [DOI] [PubMed] [Google Scholar]
- 21.Hameed B, Mehta N, Sapisochin G, Roberts JP, Yao FY. Alpha-fetoprotein level > 1000 ng/mL as an exclusion criterion for liver transplantation in patients with hepatocellular carcinoma meeting the Milan criteria. Liver transplantation. 2014;20(8):945–951. [DOI] [PMC free article] [PubMed] [Google Scholar]
- 22.Toso C, Meeberg G, Hernandez-Alejandro R, Dufour JF, Marotta P, Majno P, et al. Total tumor volume and alpha-fetoprotein for selection of transplant candidates with hepatocellular carcinoma: A prospective validation. Hepatology. 2015;62(1):158–165. [DOI] [PubMed] [Google Scholar]
- 23.Mazzaferro V, Regalia E, Doci R, Andreola S, Pulvirenti A, Bozzetti F, et al. Liver transplantation for the treatment of small hepatocellular carcinomas in patients with cirrhosis. The New England journal of medicine. 1996;334(11):693–699. [DOI] [PubMed] [Google Scholar]
- 24.Mahmud N, Shaked A, Olthoff KM, Goldberg DS. Differences in Posttransplant Hepatocellular Carcinoma Recurrence by Etiology of Liver Disease. Liver transplantation. 2019;25(3):388–398. [DOI] [PMC free article] [PubMed] [Google Scholar]
- 25.Grabau CM, Crago SF, Hoff LK, Simon JA, Melton CA, Ott BJ, et al. Performance standards for therapeutic abdominal paracentesis. Hepatology. 2004;40(2):484–488. [DOI] [PubMed] [Google Scholar]
- 26.Cullaro G, Verna EC, Lee BP, Lai JC. Chronic Kidney Disease in Liver Transplant Candidates: A Rising Burden Impacting Post-Liver Transplant Outcomes. Liver transplantation. 2020;26(4):498–506. [DOI] [PMC free article] [PubMed] [Google Scholar]
- 27.Levey AS, Eckardt KU, Tsukamoto Y, Levin A, Coresh J, Rossert J, et al. Definition and classification of chronic kidney disease: a position statement from Kidney Disease: Improving Global Outcomes (KDIGO). Kidney international. 2005;67(6):2089–2100. [DOI] [PubMed] [Google Scholar]
- 28.Allen AM, Heimbach JK, Larson JJ, Mara KC, Kim WR, Kamath PS, et al. Reduced Access to Liver Transplantation in Women: Role of Height, MELD Exception Scores, and Renal Function Underestimation. Transplantation. 2018;102(10):1710–1716. [DOI] [PMC free article] [PubMed] [Google Scholar]
- 29.Multivariable Analysis: A Primer for Readers of Medical Research. Annals of internal medicine. 2003;138(8):644–650. [DOI] [PubMed] [Google Scholar]
- 30.Wolff RF, Moons KGM, Riley RD, Whiting PF, Westwood M, Collins GS, et al. PROBAST: A Tool to Assess the Risk of Bias and Applicability of Prediction Model Studies. Annals of internal medicine. 2019;170(1):51–58. [DOI] [PubMed] [Google Scholar]
- 31.Dugas AF, Hsieh Y-H, LoVecchio F, Moran GJ, Steele MT, Talan DA, et al. Derivation and Validation of a Clinical Decision Guideline for Influenza Testing in 4 US Emergency Departments. Clinical Infectious Diseases. 2019;70(1):49–58. [DOI] [PubMed] [Google Scholar]
- 32.Ratzinger F, Haslacher H, Perkmann T, Pinzan M, Anner P, Makristathis A, et al. Machine learning for fast identification of bacteraemia in SIRS patients treated on standard care wards: a cohort study. Scientific Reports. 2018;8(1):12233. [DOI] [PMC free article] [PubMed] [Google Scholar]
- 33.Rothberg MB, Lindenauer PK, Lahti M, Pekow PS, Selker HP. Risk factor model to predict venous thromboembolism in hospitalized medical patients. J Hosp Med. 2011;6(4):202–209. [DOI] [PubMed] [Google Scholar]
- 34.Harrell FE Jr., Lee KL, Mark DB. Multivariable prognostic models: issues in developing models, evaluating assumptions and adequacy, and measuring and reducing errors. Statistics in medicine. 1996;15(4):361–387. [DOI] [PubMed] [Google Scholar]
- 35.Vitale A, Volk ML, De Feo TM, Burra P, Frigo AC, Ramirez Morales R, et al. A method for establishing allocation equity among patients with and without hepatocellular carcinoma on a common liver transplant waiting list. Journal of hepatology. 2014;60(2):290–297. [DOI] [PubMed] [Google Scholar]
- 36.Combescure C, Perneger TV, Weber DC, Daures JP, Foucher Y. Prognostic ROC curves: a method for representing the overall discriminative capacity of binary markers with right-censored time-to-event endpoints. Epidemiology (Cambridge, Mass). 2014;25(1):103–109. [DOI] [PubMed] [Google Scholar]
- 37.Rodriguez-Alvarez MX, Meira-Machado L, Abu-Assi E, Raposeiras-Roubin S. Nonparametric estimation of time-dependent ROC curves conditional on a continuous covariate. Statistics in medicine. 2016;35(7):1090–1102. [DOI] [PubMed] [Google Scholar]
- 38.Yao FY, Bass NM, Nikolai B, Davern TJ, Kerlan R, Wu V, et al. Liver transplantation for hepatocellular carcinoma: analysis of survival according to the intention-to-treat principle and dropout from the waiting list. Liver transplantation. 2002;8(10):873–883. [DOI] [PubMed] [Google Scholar]
- 39.Le Berre C, Sandborn WJ, Aridhi S, Devignes MD, Fournier L, Smail-Tabbone M, et al. Application of Artificial Intelligence to Gastroenterology and Hepatology. Gastroenterology. 2020;158(1):76–94.e72. [DOI] [PubMed] [Google Scholar]
- 40.Persad G, Wertheimer A, Emanuel EJ. Principles for allocation of scarce medical interventions. Lancet. 2009;373(9661):423–431. [DOI] [PubMed] [Google Scholar]
- 41.Mahmud N, Hoteit MA, Goldberg DS. Risk Factors and Center-Level Variation in Hepatocellular Carcinoma Understaging for Liver Transplantation. Liver Transplantation. [DOI] [PMC free article] [PubMed] [Google Scholar]
- 42.Wong RJ, Cheung R, Ahmed A. Nonalcoholic steatohepatitis is the most rapidly growing indication for liver transplantation in patients with hepatocellular carcinoma in the U.S. Hepatology. 2014;59(6):2188–2195. [DOI] [PubMed] [Google Scholar]
- 43.Su F, Yu L, Berry K, Liou IW, Landis CS, Rayhill SC, et al. Aging of Liver Transplant Registrants and Recipients: Trends and Impact on Waitlist Outcomes, Post-Transplantation Outcomes, and Transplant-Related Survival Benefit. Gastroenterology. 2016;150(2):441–453. [DOI] [PubMed] [Google Scholar]
- 44.Parikh CR, Thiessen-Philbrook H. Key concepts and limitations of statistical methods for evaluating biomarkers of kidney disease. JASN. 2014;25(8):1621–1629. [DOI] [PMC free article] [PubMed] [Google Scholar]
- 45.Rao PS, Schaubel DE, Guidinger MK, Andreoni KA, Wolfe RA, Merion RM, et al. A comprehensive risk quantification score for deceased donor kidneys: the kidney donor risk index. Transplantation. 2009;88(2):231–236. [DOI] [PubMed] [Google Scholar]
- 46.VanWagner LB, Harinstein ME, Runo JR, Darling C, Serper M, Hall S, et al. Multidisciplinary approach to cardiac and pulmonary vascular disease risk assessment in liver transplantation: An evaluation of the evidence and consensus recommendations. American Journal of Transplantation. 2018;18(1):30–42. [DOI] [PMC free article] [PubMed] [Google Scholar]
- 47.Wang CW, Lai JC. Reporting functional status in UNOS: The weakness of the Karnofsky Performance Status Scale. Clinical transplantation. 2017;31(7). [DOI] [PMC free article] [PubMed] [Google Scholar]
- 48.Llovet JM, Lencioni R. mRECIST for HCC: Performance and novel refinements. Journal of hepatology. 2020;72(2):288–306. [DOI] [PubMed] [Google Scholar]
Associated Data
This section collects any data citations, data availability statements, or supplementary materials included in this article.


