

Abstract
Prostate cancer is one of the most common malignancies worldwide, yet limited tools exist for prognostic risk stratification of the disease. Identification of new biomarkers representing intrinsic features of malignant transformation and development of prognostic imaging technologies are critical for improving treatment decisions and patient survival. In this study, we analyzed radical prostatectomy specimens from 422 patients with localized disease to define the expression pattern of methionine aminopeptidase II (MetAP2), a cytosolic metalloprotease that has been identified as a druggable target in cancer. MetAP2 was highly expressed in 54% of low-grade and 59% of high-grade cancer. Elevated levels of MetAP2 at diagnosis were associated with shorter time to recurrence. Controlled self-assembly of a synthetic small molecule enabled design of the first MetAP2-activated positron emission tomography (PET) imaging tracer for monitoring MetAP2 activity in vivo. The nanoparticles assembled upon MetAP2 activation were imaged in single prostate cancer cells with post-click fluorescent labeling. The fluorine-18 labeled tracers successfully differentiated MetAP2 activity in both MetAP2 knockdown and inhibitor-treated human prostate cancer xenografts by micro-PET/CT scanning. This highly sensitive imaging technology may provide a new tool for non-invasive early risk stratification of prostate cancer and monitoring the therapeutic effect of MetAP2 inhibitors as anti-cancer drugs.
Keywords: Prostate cancer, MetAP2, PET imaging, prognosis, self-assembly
Introduction
Prostate cancer (PCa) is the second most commonly diagnosed malignancy among men and a leading cause of cancer death worldwide (1). Most cases of PCa are asymptomatic and are detected within the prostate as a result of screening. However, screening has also resulted in over-detection of indolent prostate cancers resulting in over-treatment and unnecessary morbidity, necessitating the development of prognostic models in early disease (2). Current risk stratification uses serum PSA (prostate specific antigen) measurements, Gleason grade on biopsy (microscopic morphology of the cancer cells) and clinical stage for prognostication, although these provide only modest prediction of clinical outcomes (3). Identification of new biomarkers suitable for development of non-invasive prognostic technology is highly desirable.
PET (Positron-Emission Tomography) imaging hybridized with CT (computed tomography) or MRI (magnetic resonance imaging) is sensitive, noninvasive, 3-dimensional, and has demonstrated utility in improving the diagnosis of PCa, especially for recurrent and advanced disease (4). Current PCa imaging tracers approved by the FDA or in clinical trial typically rely on binding of a radiolabeled ligand, inhibitor or antibody to a membrane receptor (5). However, not all prostate cancers express the membrane receptors targeted by these imaging agents. For example, neuroendocrine PCa (NEPC), a highly aggressive form of advanced PCa, commonly lacks expression of prostate-specific membrane antigen (PSMA), the target of a recently approved PET trace Gallium 68 PSMA-11 (6,7). PET tracers that can traverse cell membrane and report on activity of molecules essential for intrinsic biochemical processes which undergo alterations during PCa initiation and progression independent of the AR-signaling axis could offer attractive imaging targets.
Methionine aminopeptidase II (MetAP2) is a cytosolic metalloprotease that catalyzes the co-translational removal of the N-terminus initiator methionine residue from nascent proteins (8). MetAP2 overexpression stimulates cancer cell proliferation (9) and is well known as a druggable target of angiogenesis, a pathological determinant of progression in solid tumors (10). Considerable effort over many years has been devoted to developing MetAP2 inhibitors as anti-cancer drugs (11–13), since its expression has been correlated with proliferation and angiogenesis in advanced PCa (14,15). High MetAP2 expression has been observed in prostatic carcinoma (9), we now report that high levels of MetAP2 are predictive for shorter time to biochemical recurrence in PCa treated surgically. Analysis of MetAP2 levels in a cohort of over 400 patient prostate cancer samples from radical prostatectomies confirmed the overexpression of MetAP2 in more than half of PCa regardless of grade, and MetAP2 overexpression was associated with a two-fold increased risk of biochemical recurrence within 5 years. MetAP2 therefore represents a promising target for noninvasive functional imaging of clinically significant PCa.
We have devised a strategy termed target-enabled in situ ligand aggregation (TESLA) to develop molecular probes for imaging the activity of proteolytic enzymes in vivo that can be used with a variety of imaging modalities including fluorescent imaging, photoacoustic imaging, magnetic resonance imaging (MRI), and positron emission tomography (PET) (16–19). This strategy was inspired by the rapid condensation reaction between 6-hydroxy-2-cyanobenzothiazole (CBT) and D-cysteine in the synthesis of firefly D-luciferin under physiological conditions (20). The cysteine can be masked at its amino and thiol groups, for example, by a peptide substrate, and linked to the CBT unit in designing a TESLA probe. Such probes can undergo self-condensation and assemble into nano-aggregates after the target enzyme activation (17,21–23). Recently we have further explored this condensation reaction from CBT to other aromatic nitriles such as 2-cyanopyrimidine and aminothiols (24). In this study, we designed novel MetAP2 activated self-nanoaggregation tracers (M-SNAT) (Supplementary Fig. S1–4) and validated them for imaging the activity of MetAP2 in a series of in vitro and in vivo models. The first demonstration of MetAP2 activatable small molecule for PET imaging in preclinical models highlights its potential for non-invasive diagnosis and risk stratification of early PCa.
Materials and Methods
Cell culture
PC3, DU145, 22Rv1, LNCaP and NCI-H660 carcinoma lines were obtained from ATCC. LNCaP-Trop2 are engineered LNCaP cells overexpressing Trop2 as previously reported (25). Culture was maintained in 37 °C with 5% CO2. Cells were split using 0.25 % Trypsin-EDTA. PC3, DU145, 22Rv1, LNCaP and LNCaP-Trop2 were cultured in RPMI 1640 medium supplemented with 10% fetal bovine serum (FBS), 100 U/ml penicillin, 100 ug/ml streptomycin, 1% L-glutamine. H660 cells were cultured in RPMI 1640 with supplemented 5% FBS, 0.005 mg/ml insulin, 0.01 mg/ml transferrin, 30 nM sodium selenite, 10 nM hydrocortisone, 10 nM beta-estradiol, 4 mM L-glutamine. Human prostate epithelial cell line PrEC were cultured in prostate epithelial cell basal medium (ATCC PCS-440-030) supplemented by 100 U/ml penicillin, 100 ug/ml streptomycin, 1% L-glutamine, and a prostate epithelial cell growth kit (ATCC PCS-440-040). PC3, DU145, 22Rv1, LNCaP, NCI-H660 and LNCaP-Trop2 were maintained below 10 passages. PrEC was maintained below 3 passages. All cell lines were routinely tested for mycoplasma contamination (MycoAlert Mycoplasma Detection Kit purchased from Lonza), with authentication performed at Stanford Functional Genomics Facility for Short Tandem Repeat (STR) profiling.
Preparation of human prostatectomy slides and microarrays
Prostates were collected at Stanford Hospital under IRB approval and written informed consent. All patient samples were deidentified prior to inclusion in this study. Subsequently tissues were processed into the Stanford Department of Urology tissue bank and consisted of Benign Prostatic Hyperplasia n=62, Benign tissue adjacent to cancer, n=63, low grade cancer (Gleason 3 +3 to 3+ 4) n=249, or high grade cancer (Gleason 4 + 3 to 5 + 5) n=56. Samples were sliced to display clinically relevant disease, fixed overnight, then sectioned at four microns and mounted on lysine coated glass slides. Samples were stained for MetAP2 by IHC and scored by intensity by a pathologist from 0 to 3 (0= negative, 1= uninterpretable, 2= low intensity positive staining and 3= high intensity positive staining).
Tissue microarrays (TMAs) for clinical evaluation of MetAP2 were constructed at Stanford University using an internal cohort of patients with a median follow-up of 10 years as described previously (26). This cohort consisted of recurrent (n=58) and non-recurrent patients (n=176) and included patients with Gleason score 3 + 3 to 4 + 4. Three cores per patient were included on the TMA. MetAP2 staining was performed as described. Samples were scored for MetAP2 intensity by a genitourinary pathologist (CAK) who was blinded to sample information.
IHC staining and grading of tissue slides and TMAs
Tumor slices or TMAs were heated to 65 °C for one hour prior to deparaffinization in Clearify and rehydration. Antigen retrieval was performed 20 minutes in 10 mM sodium citrate buffer pH 6.0 in a steam bath (95 °C) and washed, followed by 3% H2O2 for 5 minutes. Slides were blocked 1 hour in 2.5% goat serum at RT. Mouse primary antibody (Origene concentration 1:75) (Santa Cruz 1:150) was added overnight at 4 °C.
Preparation and IHC staining of xenograft tissue slides
Prostate cancer cells (5x10⁵) were implanted with 100% Matrigel into the rear flank of six to eight-week-old NOD/SCID/IL-2Rγnull (NSG) mice. Tumors were grown to ~500 mm3 and harvested. Tumors were divided for either protein (flash-frozen in liquid nitrogen) or histological analysis (fixed overnight at 4 °C in 10% buffered formalin, paraffin embedded, and sliced at 4-micron thickness). Immunohistochemistry for xenografts was performed as described above.
Western blot analysis of cells and tumors
Cells were trypsinized, pelleted and washed 3 times with ice cold PBS and lysed in RIPA buffer. Tumor tissues were cut into small pieces and ground in 1.5 mL Eppendorf tubes with microtube pestles for lysis in RIPA buffer. Protein concentrations of centrifuged whole lysates were determined with BCA assay. As described previously (27), in brief, either 40 μg or 50 μg of cell or tumor lysate were loaded each lane in NuPAGE 4-12% Bis-Tris protein gels for electrophoresis at 200V for 90 min. Wet transfer was performed using a Bio-Rad transfer kit at 300 mA for 90 min. The transferred nitrocellulose membrane was blocked in PBS containing 5% BSA and 0.1% Tween-20 for 1 h. Primary antibody incubation was performed in the blocking buffer overnight at 4 °C at the recommended concentration. The membrane was then washed with PBS containing 0.1% Tween-20 for 5 min, four times. Secondary antibody incubation (LI-COR donkey anti-mouse IgG IRDye 680 or anti-rabbit IgG IRDye 800CW, 1: 10,000) was performed in the blocking buffer for 2 h at room temperature. After washing four times with PBS containing 0.1% Tween-20, membranes were analyzed in a LI-COR Odyssey imaging system.
MetAP2-mediated macrocyclization in vitro
M-SNAT (10 μM, 10 μL of 1 mM stock in DMSO) was diluted in reaction buffer containing 50 mM HEPES, 100 mM NaCl and 0.1 mM MgCl2 at pH 7.5 with or without 1 mM TCEP (2 μL of 500 mM stock in water) and 7.5 μg recombinant human MetAP2 in 1 mL final concentration. Reactions were performed at 37 °C for 24 h and monitored by HPLC.
Post-click labeling of M-SNAT in cells by Cy5-azide for microscope imaging and flow cytometry analysis
For microscopic imaging, PC3, DU145, 22Rv1, PC3 MetAP2 KD and 22Rv1 MetAP2 KD cells were seeded at about 50% confluence on cover glasses in 6-well plates a day before incubation with 20 μM M-SNAT (10 μL of 2 mM stock in DMSO) in medium containing 1 % FBS and TNP-470 (2 μM, 2 μL of 1 mM stock in DMSO). After incubation at 37 °C for 24 h, cells were washed 3 times with PBS then fixed with 10% formalin for 30 min. Cells were permeabilized in PBS-Triton X100 (0.1% v/v) at room temperature for 15 min then washed 3 times with PBS. Post-Click assay solution was freshly prepared with 100 mM ascorbic acid (100 μL of 1 M stock in water, freshly prepared), 1 mM CuSO4 (10 μL of 100 mM stock in water), 15 μM (BimC4A)3 (0.5 μL of 30 mM stock in water) and 5 μM Cy5-azide (1 μL of 5 mM in DMF) in 1 mL PBS. Cells were incubated with assay solution at room temperature for 4 h at 37 °C then washed 3 times with PBS. Cells were then stained with 300 nM DAPI in PBS for 10 min at room temperature, washed with PBS 3 times and mounted on glass slides with antifade mounting medium.
The epifluorescence microscope images were acquired by 1X81 inverted microscope (Olympus) equipped with pE-4000 illumination systems (CoolLED) and ORCA-Flash4.0 digital CMOS camera (HAMAMATSU) with excitation at 405 nm for DAPI and 650 nm for Cy5. Digital images were reconstructed by MetaMorph software (v. 7.8.11.0) and analyzed using the ImageJ (NIH) software package.
The super-resolution images were acquired by OMX BLAZE 3D-structured illumination, super-resolution microscope (SIM) (Applied Precision) with simultaneous excitation at 405 nm for DAPI (Emission filters 435/31 nm) and 642 nm for Cy5 (Emission filters 683/40 nm), according to the standard procedure in the manufacturer’s instructions, and reconstructed with OMX softWoRx image-processing software. Images were further processed using Volocity (v. 6.3.0, PerkinElmer) to generate the video.
For flow cytometry analysis, PC3 cells were trypsinized and resuspended after incubation in 20 μM M-SNAT and medium containing 1 % FBS with or without 2 μM TNP-470 for 24 h. Cells were centrifuged at 300G for 10 min and washed with PBS once, then resuspended and fixed in 10% formalin at room temperature for 30 min. Cells were washed with PBS for 3 times by centrifugation then resuspended in post-Click assay buffer at 37 °C for 4 h. Cells were washed with PBS for 3 times then analyzed with a 4-laser, 12-color DxP12 Cytek upgrade (Becton Dickinson, Cytek Biosciences) and evaluated according to their size (FSC, Front Scatter) on a linear scale, excited by 640 nm later, filtered by 655 nm, LP (Long Pass filter) and 616/661 nm, BP (Band Pass filter). Flow cytometry data analysis was done using FlowJo V10 software. The MFI (mean fluorescence intensity) was collected and plotted against the natural autofluorescence of cells.
Cell viability assay
Cell viability assay was performed with a CellTiter 96 AQueous One Solution Cell Proliferation Assay (MTS) kit (Promega, Madison, WI) according to the manufacturer’s protocol. PC3 cells were incubated with M-SNAT (100 pM – 100 μM), cisplatin (500 μM), and solvent (DMSO, 1%) in a 96 well-plate at 37 °C for 24 h. The second day, medium was changed, and cells were incubated with MTS reagent for additional 3 h. The absorbance at 490 nm was measured and plotted.
Generation of lentivirus and MetAP2 knockdown stable lines in PC3 and 22Rv1 cells
pLKO.1-control scramble short hairpin RNA (shRNA) vector (Addgene, plasmid #1864), or pLKO.1-MetAP2 shRNA (Millipore Sigma, TRCN0000294143: GGATCATATACAGCG CAATTT; TRCN0000286742: GCAGAAGCACATCGACAAGTT; TRCN0000306917: GACAAAGGCAAACCGTCTAAT) were co-transfected with pMDLg/pRRE, pRSV-Rev, and pMD2.G into 293T cells based on standard calcium phosphate transfection. The media with viral particles were collected at 24 and 48 h, and 0.45-μm filtered for usage. 2x10⁵ PC3 or 22Rv1 cells were seeded in six-well plates for infection with 2mL viral media containing polybrene (10 μg/mL). 72 h after transfection, the infected cells underwent selection using puromycin (1 μg/mL). The media with puromycin were changed every 3 days and the stable lines were generated after 9 days for further validation utilizing Western blot to determine the knockdown efficiency of MetAP2.
Stability in mouse serum
M-SNAT (100 μM, 1 μL of 2 mM stock in DMSO) was diluted in 20 μL mouse serum and incubated at 37 °C for 0, 15, 30 min, 1 and 2 h. Serum proteins were denatured by mixing cold methanol (980 μL) and precipitated by centrifugation at 8,000G for 10 min. Supernatants were analyzed by HPLC and LC-MS. Percentage of tracer (relative area) was calculated as (peak area of tracer/total peak area on the HPLC chromatogram) x 100.
Animals
All experimental procedures using mice were performed in agreement with protocols approved by Institutional Animal Care and Use Committee (IACUC) of Stanford University as well as the USAMRMC Animal Care and Use Review (ACURO) in accordance with the laws of the United States and regulations of the Department of Agriculture.
For the MetAP2 inhibition model, six- to eight-week-old male nu/nu nude mice were purchased from Charles River Laboratories. Mice were housed in the Research Animal Facility at the Clark Center of the Stanford University (Stanford, CA). 5 x 10⁵ PC3 cells were injected subcutaneously into the right upper flank region of nu/nu nude mice in 50% Matrigel. When the tumors reached ~100 mm3, TNP-470 (stock in DMSO) was sequentially dissolved in ethanol and PBS then injected subcutaneously at a dose of 30 mg/kg at a position remote from the tumor (lower left back) every other day for 4 days then injected every day for 5 additional days with the last injection 4 h prior to injection of PET tracer. Tumor dimensions were measured every other day by external caliper and tumor volume was calculated using the modified ellipsoid formula (Length x Width2)/2.
For PET imaging of MetAP2 stable KD models, NSG (NOD-SCID-IL2R γ) (Jackson Laboratory) male mice were bred at the Canary Center in accord with IACUC guidelines. 2.5 x 10⁵ WT, sh-ctrl or sh-MetAP2 PC3 cells were injected subcutaneously into bilateral flanks of 6-week3-old male NSG mice in 100% Matrigel. Tumors were measured every third day by external caliper, and tumor volume was calculated by use of the formula (Length x Width x Height)/2. Tumors were grown to around 300–1000 mm3 volume on average at the time of imaging.
For biodistribution studies, 1 x 10⁶ sh-ctrl or sh-MetAP2 PC3 cells were subjected to bilateral subcutaneous injection into the flanks of 6-weeks-old male NSG mice in 100% Matrigel. Tumors were measured every second or third day by external caliper, and tumor volume was calculated by use of the formula (Length x Width x Height)/2. Tumors were grown to around 300-600 mm3 volume on avarage at the time of studies.
In vivo PET/CT imaging and data analysis
In experiments using the MetAP2 inhibitor, PET/CT imaging was performed using a Siemens Inveon micro PET/CT scanner (CT attenuation-corrected). Totally 8 mice were imaged in two batches, 4 mice each. Approximately 145 μCi of [18F]-M-SNAT (radiochemical purity of 99% as determined by HPLC; first batch, ~14 pmol; second batch, ~26 pmol) was injected intravenously into tumor-bearing mice. For the MetAP2 stable KD mouse model, PET imaging was performed using a Siemens Inveon D-PET micro-PET scanner (transmission attenuation-corrected). CT was performed using a Sofie G-Next PET-CT scanner. Totally 8 mice were imaged in two batches, 4 mice each. Approximately 79 μCi of [18F]-M-SNAT (radiochemical purity of 99% as determined by HPLC; first batch, ~46 pmol; second batch, ~80 pmol) was injected intravenously into tumor-bearing mice. Dynamic scans were acquired in list mode format over 90 min, and sorted into 22 times of frames, 0.5-mm sinogram bins for image reconstruction (4 × 15 s, 4 × 60 s, 11 × 300 s, 3 × 600 s). Mice were anesthetized with 2% isoflurane near the center of the FOV to ensure the highest image resolution and sensitivity. Iterative reconstruction was performed using 3D ordered-subsets expectation maximization (3D-OSEM) followed by fast maximum posteriori (fast MAP) with the following parameters: MAP OSEM iterations, 2; MAP subsets, 16; MAP iterations, 18. PET images were registered with CT images. Siemens Inveon Research Workplace software v.4.2 was used for visualization of radiotracer uptake in the tumor, and to define the three-dimensional (3D) volumes of interest (VOI). The relative tumor or organ radioactivity concentrations were from mean pixel values within the multiple VOI volumes and converted to counts per milliliter per min and then divided by the injected dose (ID) to obtain an imaging VOI-derived percentage of the injected radioactive dose per cubic centimeter of tissue (%ID/cc). We assume the average tissue density is close to density of water and converted %ID/cc to percentage of the injected radioactive dose per gram tissue (%ID/g).
Ex vivo biodistribution studies
Ex vivo biodistribution studies were performed to measure tumor- and tissue-associated radioactivity. Totally 18 mice were analyzed in two batches, 9 mice in the first 40 μCi (~38.28 pmol) injection batch (sh-ctrl, n=4; sh-MetAP2, n=5), 9 mice in the second 300 μCi (~520.90 pmol) injection batch (sh-ctrl, n=4; sh-MetAP2, n=5). [18F]-M-SNAT (radiochemical purity of 99% as determined by HPLC) was injected intravenously into tumor-bearing mice. Mice were sacrificed 60 min post injection to collect tumor, heart, lung, spleen, muscle, liver, kidney, prostate, and bone. The radioactivity in each tissue was measured using a gamma counter (Hidex automated gamma counter) and normalized to tissue weight and the amount of radioactivity administered to each mouse, decay-corrected to the time of radiotracer injection. Data were expressed as percentage injected dose per gram of tissue (%ID/g) values.
Statistical analysis
GraphPad Prism 7 was utilized for plotting and statistical analysis. The significant difference was determined by performing one-way or two-way ANOVA followed by Bonferroni’s multiple comparisons test and T tests (Mann-Whitney test, nonparametric) to determine the statistical significance with 95% confidence intervals with *= P < 0.0332; **= P < 0.0021, ***= P < 0.0002, ****= P < 0.0001, ns: not significant.
Results
High levels of MetAP2 are predictive for biochemical recurrence in PCa
We first measured the protein levels of MetAP2 in a panel of prostate cell lines including a benign human prostate epithelial cell line PrEC (28) and PCa cell lines PC3, DU145, 22Rv1, and their corresponding tumor xenografts. PrEC cells expressed significantly lower levels of MetAP2 when compared to PC3, DU145 and 22Rv1 PCa cells and xenografts (Fig. 1A). MetAP2 was also expressed in LNCaP PCa xenografts and xenografts from two different models of NEPC, NCI-H660 and NEPC driven by the Trop2 oncogene (TD-NEPC) (25) (Fig. 1B and C). In contrast to MetAP2, PSMA is only detected in LNCaP xenografts, suggesting that utilizing MetAP2 as a target for new imaging modalities may detect additional subsets of PCa missed by PSMA tracers. Together these findings demonstrate that MetAP2 levels are elevated in models of adenocarconoma and neurodendocrine PCa.
Figure 1.

MetAP2 is highly expressed in PCa cells, xenografts, human PCa and associates with biochemical recurrence. A and B, Western blot analysis of MetAP2 in prostate cell lines and xenografts, and AR (FL-full length, V7-variant) and PSMA in tumor xenografts; 40 μg of each whole cell or tumor lysate was loaded. 5 x 10⁵ cells were implanted subcutaneously in 100% Matrigel into rear flank of NSG mice. C, Representative images of IHC staining of MetAP2 and PSMA in xenograft prostate tumor samples from PC3, DU145, 22Rv1, NCI-H660, LNCaP and LNCaP-Trop2 (NEPC model), Scale bar: 50 μm. D, Representative images of IHC staining from PCa patient samples showing the overexpression of MetAP2 in both low-and high-grade tumors but not benign regions. IHC was done in parallel with MetAP2 primary antibodies from Santa Cruz (Supplementary Fig. S5) and OriGene (shown here) to demonstrate reproducibility. Scale bar: 500 μm left, 100 μm right. E, Intensity of the staining of MetAP2 in patient specimens was scored from 0 to 3 by a pathologist (0: negative; 1: uncertain/excluded due to lack of sufficient tissue for evaluation; 2: weakly positive; 3: strongly positive). Percentage of patients with none (0), low (average >1 & ≤2) and high (average>2) MetAP2 staining were presented within each group of samples (BPH, n=62; Benign, n=63; 3+3 to 3+4, n=249; 4+3 to 5+4, n=56). F, The mean intensity in BPH, benign adjacent to cancer, low-grade and high-grade cancer. Error bars represent standard error, ****= P <0.0001, ns= no significance. G, Kaplan-Meier analysis showing biochemical recurrence of patients (n=212) stratified by strong MetAP2 IHC staining at least 2 of the 3 biopsy cores (MetAP2 high, red curve) and all the other patients (MetAP2 negative/low, blue curve).
We further evaluated the levels of MetAP2 in human PCa by immunohistochemistry staining of radical prostatectomy sections and tissue microarrays (TMAs) containing samples from 422 PCa patients, out of which 212 patients had 10 years of follow-up (29). As shown in Fig. 1D, benign prostate tissues had low levels of MetAP2 while low-grade PCa (Gleason 3+3) expressed moderate to high levels of MetAP2, and high-grade cancers (Gleason 4+4, 5+5) expressed high MetAP2 levels throughout the cancerous tissues (Fig. 1D, E and Supplementary Fig. S5). Benign prostatic hyperplasia (BPH) and benign adjacent to cancer tissues had significantly lower levels of MetAP2 than both low and high-grade PCa, while there was no significant difference between BPH and benign adjacent to PCa (Fig. 1F). Among the 212 patients with long-term follow-up (recurrent, n=52; non-recurrent, n=160), high levels of MetAP2 at the time of surgery were associated with biochemical recurrence (Fig. 1G and Supplementary Fig. S6).
Design of MetAP2-sensitive probes
Fig. 2A illustrates the design of MetAP2 sensitive nanoaggregation tracer (M-SNAT): the probe carries a methionine (P1, green) followed by a cysteine (P2) on the N-terminus that is connected to a 2-cyanopyrimidine (blue) through a linker. In eukaryotes, MetAP2 substrates prefer penultimate residues (P2) with a small nonpolar side chain (e.g. Gly, Ala, Ser, Thr, Val, Cys) (30). After intravenous administration, M-SNAT extravasates into tissues. In normal prostatic or BPH tissues with minimal MetAP2 activity, M-SNAT will mostly remain intact or be partially reduced and will therefore diffuse away freely. In PCa with high MetAP2 activity, cleavage, and release of the P1 methionine residue by MetAP2, as well as the reduction of the disulfide bond by intracellular glutathione (GSH), trigger the intramolecular condensation reaction. Unlike the unprocessed probes, cyclized macromolecules become rigid and tend to interact with each other to form molecular nanoaggregates (Fig. 2B). By tagging the probe with a radioisotope like fluorine-18, the location and amounts of these nanoaggregates can be detected in vivo through PET/CT imaging (Fig. 2C, top compound). For in vitro studies, a post-click reaction at the propargylglycine with an azide conjugated far-red fluorophore Cy5 was utilized to pinpoint the aggregated and precipitated M-SNAT in cells (Fig. 2C, middle compound). A control compound (M-SNAT-ctrl), with a methylated thiol that prevents intramolecular cyclization after methionine cleavage by MetAP2, was synthesized to examine the role of cyclization and aggregation in the activity of M-SNAT (Fig. 2C, bottom compound).
Figure 2.
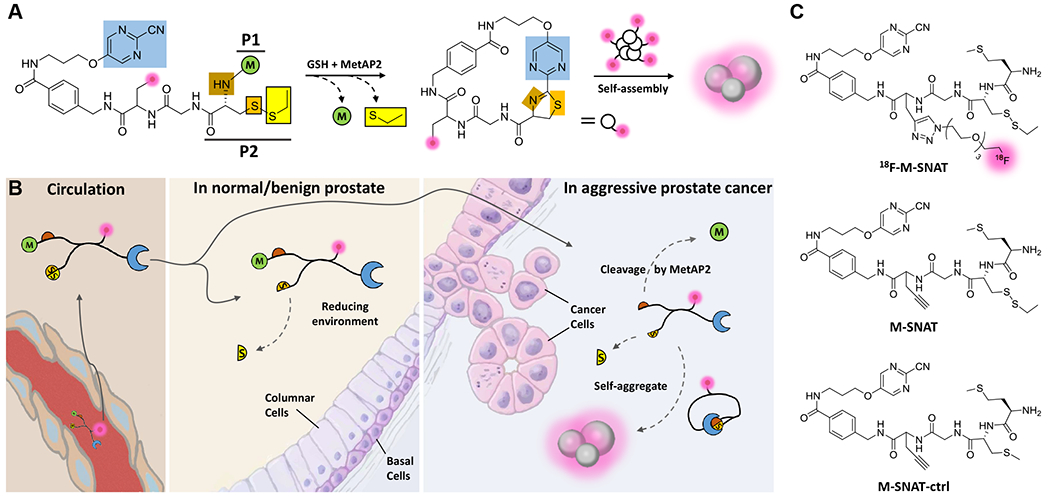
Illustration of the mechanism of in vivo imaging of MetAP2 activity by [18F]-M-SNAT in human prostate cancer. A, Proposed MetAP2 and cellular glutathione (GSH) controlled conversion of M-SNAT into M-SNAT-cyclized through the bioorthogonal intramolecular cyclization reaction followed by self-assembly into nanoaggregates in situ. Blue, the 2-cyanopyrimidine; brown and orange, amino and thiol groups of D-cysteine, respectively; yellow, thioethyl masking group; green, the capping methionine residue; pink, isotope molecule. B, After intravenous administration, M-SNAT extravasates into tumor tissue because of its small size. In normal or benign tissue that express minimal amounts of MetAP2, the methionine mostly remains and M-SNAT can diffuse away freely, leading to low signal. In aggressive cancer cells overexpressing MetAP2, after methionine cleavage M-SNAT undergoes macrocyclization and in situ nanoaggregation, leading to enhanced probe retention and high radioactive signal. C, Structures of [18F]-M-SNAT, M-SNAT and M-SNAT-Ctrl.
Macrocyclization and nanoaggregation of M-SNAT in vitro
Macrocyclization of M-SNAT to produce M-SNAT-cyclized was monitored in solution using high-performance liquid chromatography (HPLC) and mass spectrometry. After 24 hours incubation with recombinant human MetAP2 in the presence of tris(2-carboxyethyl)phosphine (TCEP) to mimic the intracellular reducing environment, M-SNAT (10 μM; HPLC retention time, TR = 15.5 minutes) was converted completely into M-SNAT-cyclized (TR = 11.8 minutes) (Fig. 3A and Supplementary Fig. S7). In contrast, the M-SNAT-ctrl cannot cyclize due to the non-reducible methylated thiol group (Supplementary Fig. S8). Dynamic light scattering (DLS) analysis showed the formed nanoparticles with an average diameter of 861 nm (531-1281 nm) (Fig. 3B), which was confirmed by transmission electron microscopy (TEM) (Fig. 3C and Supplementary Fig. S9). MetAP2 catalyzed removal of the methionine residue and activated M-SNAT to undergo intramolecular macrocyclization and subsequent nanoassembly.
Figure 3.

In vitro characterization of M-SNAT. A, HPLC traces of M-SNAT (black) and M-SNAT (10 μM) after incubation with TCEP (1 mM) and recombinant human MetAP2 (7.5 μg/ml) at 37 °C in reaction buffer for 24h (red). B, DLS analysis shows the formation of nanoparticles with an average diameter of 861 nm (531-1281 nm). C, TEM image of nanoaggregates after incubation of M-SNAT (10 μM) with MetAP2.
Imaging MetAP2 activity in PCa cells
The uptake and MetAP2 specific activation of M-SNAT were evaluated in PC3 and DU145 PCa cells. Post-click fluorescent labeling with Cy5-azide was performed to pinpoint the nanoaggregation in cells and to avoid possible interference with probe uptake incurred by conjugating the probe with a bulky Cy5 fluorophore prior to treating the cells (Fig. 4A). A well-characterized MetAP2 inhibitor (TNP-470), that inhibits the aminopeptidase activity by alkylating the His231 residue in the active center, was used to evaluate the probe specificity (10). Under microscope, red fluorescence was observed in M-SNAT treated PC3 and DU145 cells in a concentration-dependent manner after 24 hours incubation, while there was minimal fluorescent signal in cells with the control probe M-SNAT-ctrl (Fig. 4B and Supplementary Fig. S10–12). When TNP-470 (2 μM) was added, the fluorescence in both PC3 and DU145 cells was significantly reduced (Fig. 4B and Supplementary Fig. S11). Flow cytometry analysis of PC3 cells incubated with M-SNAT and post-labeled with Cy5-azide revealed 22.7% inhibition by TNP-470 (Fig. 4C and Supplementary Fig. S13). These data indicated the requirement of MetAP2 hydrolysis in conversion of M-SNAT to cyclized product and the macrocyclization dependent probe nanoaggregation and retention in cells. We evaluated the toxicity of M-SNAT up to 100 μM in PC3 cells and found little effect on the cell viability (Supplementary Fig. S14).
Figure 4.

Characterization of M-SNAT in PCa cells. A, Illustration of the post-click labeling of MetAP2 activated M-SNAT nanoaggregation by Cy5 azide. B, Fluorescence microscopic imaging of cy5 (red, Ex650/Em670) post-labeled M-SNAT (20 μM) with or without TNP470 (2 μM) and M-SNAT-ctrl (20 μM) in PC3 cells. Permeabilized cells were also stained with DAPI (blue, Ex405/Em470). C, Flow cytometry analysis of PBS, M-SNAT (20 μM) with or without TNP-470 (2 μM) treated PC3 cells. Cells were suspended, fixed and permeabilized for post-click labeling after 24 h incubation. The intensity of Cy5 in each group was plotted either individually or as overlay. The percentage instead of actual counts in forward scatter (FSC) was normalized to its mode as shown in distribution. D and E, Western blot analysis of wild type (WT), KD control (Ctrl) and MetAP2 KD (M1, 2, 3) PC3 and 22Rv1 cells. 50 μg of each whole cell lysate were loaded. F and G, Growth curves of WT, KD control (sh-ctrl) and MetAP2 KD PC3 and 22Rv1 cells. Error bars represent standard error, *= P <0.0332, **= P <0.0021, ns= no significance. H, Fluorescence microscopy imaging of Cy5 post-labeled M-SNAT (20 μM) in KD control (Sh-ctrl) and MetAP2 KD (M1, M2) PC3 and 22Rv1 cells. Permeabilized cells were also stained with DAPI.
To further validate the specificity of M-SNAT activation by MetAP2, we generated MetAP2 knockdown (KD) PC3 and 22Rv1 cells. Three KD lines (M1-M3) of each cell line were generated via transduction of lentivirus carrying different shRNA sequences. A scramble shRNA was used to generate KD controls. The cell lines with the highest KD (PC3-M1, 22Rv1-M2) were selected for cell-based studies (Fig. 4D and E). Previous work has shown that cells deficient in p53 show less inhibition of proliferation by TNP-470 due to disruption of p53-dependent induction of p21Waf1/CIP1 to induce cell cycle arrest (31,32). As expected, MetAP2 KD slowed the growth of 22Rv1-M2 cells expressing wild type p53 but had minimal impact on the growth of PC3-M1 (p53 null) cells (33) (Fig. 4F and G). High doses of TNP-470, however, were reported to slow the growth of PC3 cells 30 days post tumor implantation (15). After incubation with M-SNAT for 24 hours, both PC3 and 22Rv1 KD cells showed much weaker red fluorescence than their wild type counterparts (Fig. 4H and Supplementary Fig. S15, S16). Taken together, these cell studies demonstrate specific intracellular activation and retention of M-SNAT due to MetAP2 activity.
Direct observation of the nanoparticles formed in single PCa cells
Aggregated and Cy5 post-labeled M-SNAT assemblies observed in Fig. 4B were further visualized at a single cell level using SR-SIM (Superresolution Structured Illumination Microscope), which provided both lateral (XY) and axial (Z) resolutions at twice the diffraction limit of conventional high-resolution light microscope systems such as confocal (Fig. 5 and Supplementary movie s1). The size of particles formed in situ varied from a few hundred nanometers to more than one micron, consistent with the values measured by DLS and TEM (Fig. 3B and C). The post-labeled red fluorescent aggregates occurred throughout the cytoplasm with a relatively higher density surrounding the nucleus.
Figure 5.

3D projected Super-resolution Structured Illumination Microscope (SR-SIM) imaging of cy5 post-labeled self-nanoaggregation of M-SNAT in a single PC3 cell. Representative SR-SIM image of self-aggregated fluorescent nanoparticles in PC3 cells incubated with M-SNAT (20 μM) and post-labeled by Cy5. Cells were co-stained with DAPI. Red indicates the aggregated M-SNAT, and blue indicates the nucleus. The yellow boxes i and ii indicate the enlarged area. Arrow points to an aggregation structure in the cell.
[18F]-M-SNAT enables visualization of MetAP2 activity in PCa xenografts
The ability of [18F]-M-SNAT to report MetAP2 activity in vivo was assessed in two different models of MetAP2 inhibition. To test the specificity of [18F]-M-SNAT for MetAP2 activity independent of tumor growth, we used a PC3 PCa model in which cell growth was not affected by MetAP2 knock-down (Fig. 4F). PC3 cells (5 x 10⁵) were implanted subcutaneously (s.c.) in male nude mice (15) and measured every other day for 18 days until reaching ~100 mm3. Starting at day 18, phosphate buffered saline (PBS) with or without TNP-470 (30 mg/kg) was injected s.c. every other day for 4 days, and then daily for 5 additional days, with the last injection 4 hours prior to PET imaging. Consistent with the in vitro knock-down experiments, there were no significant differences in tumor volumes (~400 mm3) between the inhibitor or PBS treated groups over the short period of treatment (Fig. 6A). [18F]-M-SNAT was prepared in a rapid two-step chemical synthesis using the labeling chemsitry as previously described (20) (Fig. 2C and Supplementary Fig. S3). Mice received an intravenous injection of approximately 145 μCi [18F]-M-SNAT and underwent a programed 90 min micro PET/CT whole-body scan. As shown in Fig. 6B, C (corresponding 3D proection in Supplementary Fig. S17), co-registered PET (sky color) and CT (grey and white) images demonstrated that PC3 xenografts in PBS treated mice retained higher radioactivity (up to 1.6 %ID/g) than tumors in mice treated with TNP-470 (around 1 %ID/g). Tumors were resected 20 hours after tracer injection for ex vivo analysis. As antibodies used for IHC recognize epitopes upstream and distant from the active binding pocket (β sheet 1-8, from Asn223) (34), changes in expression of MetAP2 by IHC were not seen after inhibitor treatment (Supplementary Fig. S18). CD31 (PECAM1) staining revealed slightly decreased neovascularization in TNP-470 treated tumors, reflecting its known anti-angiogenic effect (Supplementary Fig. S18).
Figure 6.

[18F]-M-SNAT PET/CT imaging and distribution studies of PC3 tumor xenografts. A, Growth curves of PC3 tumors treated with PBS/DMSO/ethanol (Ctrl, n=4) or TNP-470/DMSO dissolved in ethanol and PBS (Inhibitor, n=4). Black arrows indicate the time point of inhibitor injection. Error bars represent standard error, ns = no significance. B, Curves of the percentage of tumor retained injection dosage per gram acquired by defining the volumes of interest (VOI) with Inveon Research Workplace 4.2. Error bars represent standard error, *= p <0.0332. C, Representative plane images after 90 min programmed micro PET/CT scan of PBS or inhibitor treated mice. Tumors were centered for comparison. White and gray indicate CT signal; sky colors (0.5-2.5% of injected dosage per gram) indicate the mean value of accumulated PET signal. Yellow arrows indicate tumors. D, Growth curves of WT, sh-ctrl and sh-MetAP2 tumors, n=10. Error bars represent standard error, ns= no significance. E, Curves of the percentage of injection dosage per gram tumor retained acquired by defining the VOI. WT, n=3; sh-ctrl, n=5; shMetAP2-M1, n=4. Error bars represent standard error, **= p<0.0021, ns= no significance. F, Representative plane images after 90 min programmed PET/CT scan of WT, sh-ctrl and sh-MetAP2-M1 PC3 cells implanted mice. The WT tumor on the right flank of a representative mouse was <300 mm3 therefore excluded from analysis. G, Western blot analysis of MetAP2 in representative WT, sh-ctrl, and all sh-MetAP2-M1 PC3 tumor xenografts. Tumors were collected 1 day after imaging; 40 μg of each tumor lysate was analyzed. H, Quantification of [18F]-M-SNAT signal (%ID/g) from imaging data in PBS treated and sh-ctrl mice by defining the VOI at 65 min. Error bars represent standard error. I, Quantification of [18F]-M-SNAT signal (%ID/g) from ex vivo biodistribution (Bio-D) analysis of tumor, heart, lung, spleen, muscle, liver, kidney, prostate, and bone 60 min after tracer administration. Tracer uptake in tumors (Sh-ctrl, n=8; sh-MetAP2-M1, n=10) were compared using T tests (Mann–Whitney test).
To further evaluate the specificity of [18F]-M-SNAT for imaging MetAP2 activity, we developed MetAP2 KD PC3 xenograft models. 2.5 x 10⁵ wild type (WT), MetAP2 KD (sh-MetAP2-M1) or scramble shRNA transfected (sh-ctrl) PC3 cells (Fig. 4D) were suspended in 100% Matrigel and subcutaneously injected bilaterally into rear flanks of male NSG mice (n=5, each group). Tumors were measured every three days after implantation. As observed in vitro (Fig. 4F), growth of PC3 tumors in NSG mice was not affected by MetAP2 KD (Fig. 6D). At day 30, mice carrying WT (n=2), sh-MetAP2-M1 (n=3) and sh-ctrl (n=3) tumors were injected with [18F]-M-SNAT (~79 μCi) and imaged by a micro PET/CT for 90 min. Tumors larger than 900 mm3 or smaller than 300 mm3 were exluded from analysis to minimize the impact of tumor volumes on tracer uptake. The PET signal in sh-MetAP2-M1 tumors was significantly lower than WT and sh-ctrl tumors, with less than 1% uptake in sh-MetAP2-M1 tumors compared to 1.5% uptake in both WT and sh-ctrl tumors (Fig. 6E, F, and corresponding 3D projection in Supplementary Fig. S19). Ex vivo analysis confirmed the lower expression of MetAP2 in imaged sh-MetAP2-M1 tumors than WT and sh-ctrl tumors (Fig. 6G). Whole-body distribution of [18F]-M-SNAT in both models at 65 min post-injection were analyzed by defining the three-dimensional (3D) volumes of interest (VOI) and showed that most radioactivity was in the kidney and bladder, with additional uptake in the liver (Fig. 6H). We compared the uptake in liver between PBS and inhibitor treated groups but found no statistical differences, suggesting that uptake in the liver was not due to MetAP2 activity (Supplementary Fig. S20). Bone, muscle, and the pelvic region, in contrast, had very little uptake of the tracer, making it ideal for imaging primary and potentially metastatic PCa lesions at these sites (Fig. 6H). NSG mice have been shown to have a faster clearance of antibodies and antibody-drug conjugates compared to nude mice due to an abnormal Fc interaction (35). We compared the biodistribution of [18F]-M-SNAT in NSG and nude mice, particularly in the spleen, and found they were similar overall (Fig. 6H). The extreme immunodeficiency in NSG mice did not appear to interfere with the biodistribution of [18F]-M-SNAT.
To validate the aggregation dependent tracer retention in vivo, we performed a titration study with two different doses of [18F]-M-SNAT in our NSG/MetAP2 KD PCa xenograft model: low (40 μCi) and high (300 μCi). Since the cyclic products from MetAP2 are more hydrophobic than the tracer itself and tend to interact with each other, a higher local concentration should promote nanoaggregation of the cyclic prodcuts, the mechanism for contrast enhancement. As shown in Fig. 6I (left panel), a high (300 μCi, 520.90 pmol) dose of [18F]-M-SNAT showed higher tracer radioactivity (%ID/g) at 1 hour post injection than a low dose (40 μCi, 38.28 pmol) (p=0.0019) in NSG mice bearing PC3 xenografts (sh-ctrl). This result is consistent with the proposed nanoaggregation mechanism, and has also provided direct evidence that the MetAP2 activated nanoaggregation could occur at the concentration as low as 40 μCi (p=0.0005). Consistent to the imaging data, the distribution results showed that most radioactivity was in the liver and kidney. The prostate, bone and muscle, in contrast, had very little uptake of the tracer (Fig. 6I, right panel). Lastly, M-SNAT seems to be relatively stable in the serum, with a gradual decline from 100% to ~25% in 2 h incubation at 37 °C mainly because of hydrolysis of the methionine residue (Supplementary Fig. S21).
Discussion
Using the TESLA strategy, we developed a novel molecular imaging technology for non-invasive imaging of MetAP2 activity based on conversion of a small, diffusible molecule into cyclized, non-diffusible form that undergoes nanoaggregation in the cytoplasm of cancer cells. The probe chemistry is flexible and allows easy modification for generating fluorescent read out at a single cell level as well as a radiative output signal for detection in vivo. Since the tracer retention directly depends on MetAP2 expression and activity to produce contrast (Fig. 4 and 6), the images correlate with the catalytic activity of the enzyme in situ. This MetAP2 imaging strategy has potential for clinical translation since there are ongoing needs to develop imaging tools that identify clinically aggressive PCas, and MetAP2 tends to be expressed in some high-risk localized cancer and in model systems of castrate resistant and neuroendocrine PCa.
Several PET tracers have been studied for imaging PCa in localized disease to identify lesions in the prostate, when planning localized therapy to identify lymph node metastases, at time of biochemical recurrence after definitive local therapies such as surgery or radiation therapy, and when metastasized to bone. The FDG PET is used in many cancers but has limited sensitivity for imaging PCa. Choline agents, [11C]-acetate, and [18F]-fluciclovine have better sensitivity than conventional imaging technologies under particular clinical settings (36). The advent of PSMA PET imaging with either gallium-68 or fluorine-18 conjugated small molecules is revolutionizing the diagnosis and management of PCa (37). However, PSMA is expressed in benign prostatic epithelium, resulting in false positive findings within the prostate (38), and is incrementally upregulated in primary cancer, lymph node and distant metastases (39). PSMA expression does not correlate with tumor aggressiveness in localized PCa or with risk of recurrence after surgery (40–42). Discovery of reliable prognostic biomarkers, especially as imaging agents capable of early-stage disease stratification, remains a clinical demand that could be met in part through MetAP2 imaging.
MetAP2 catalyzes critical N-terminus initiator methionine hydrolysis and has been studied as a target of anti-angiogenic compounds in a variety of solid tumors, including PCa (43,44). Although MetAP2 has been heavily investigated as a therapeutic target, its use as a diagnostic imaging target had yet to be explored. In localized prostate cancer, high expression of MetAP2 in 54% of low-grade and 59% of high-grade cancers, and low or absent expression in non-cancerous prostatic tissues (BPH and normal adjacent tissues) make it an attractive imaging target. Furthermore, the finding that PCa cases with elevated MetAP2 have twice the risk of biochemical recurrence within 5 years following surgery suggest that MetAP2 imaging could be particularly useful for identifying clinically significant localized disease, a major unmet clinical need (2). In addition, the finding that MetAP2 highly expressed in model systems of castrate resistant and neuroendocrine PCa merits additional study since this imaging approach identifies MetAP2 enzymatic activity, thereby identifying tumors that could be treated with MetAP2 targeted therapies.
The synthesis and radiolabeling of [18F]-M-SNAT is straightforward and ideal for large scale preparation. We characterized [18F]-M-SNAT in both inhibtor (TNP-470) treated and stable KD PC3 xenograft models. Since TNP-470 (50-200 mg/kg) treatment in nude mice has been reported with toxicity even death (15), we lowered the injection dose to 30 mg/kg and performed multiple injections till the tumors reached ~400 mm3 on average for PET imaging. Overall, a good tolerance was observed and no obvious variances in tumor size were noticed with this short treatment plan. There are several opportunties for improving the relatively moderate uptake of [18F]-M-SNAT by tumors (up to ~2 %ID/g). For example, increasing stability of the tracer by incorporating a more bulky disulfide on the cysteine residue of [18F]-M-SNAT might impede non-specific hydrolysis in the serum, but likely will not impact MetAP2 hydrolysis kinetics in cancer cells where it is reduced by glutathione. A previous study by Zhou et al. reported a tripeptide analog containing a mercaptoacetyl residue (P2) and alanyl (or phenylalanyl) residue (P3) showed excellent efficiency for human MetAP2 (kcat/KM = 2.8 x 10⁵ M−1s−1) (45). Replacing the current glycyl residue by alanine may improve the hydrolytic kinetics by MetAP2 and thus increase signal retention.
MetAP2 PET imaging has promise to advance current imaging strategies in several ways. First, MetAP2 imaging is more likely to be active in more aggressive cancer, based on patterns of expression and therefore could enrich for identification of clinically significant PCas. Second, loss of expression of PSMA in NEPC is often acquired after androgen deprivation therapies (7). As we observed, MetAP2 is highly expressed in model systems of castrate resistant adenocarcinoma and neuroendocrine PCa, suggesting a unique role of MetAP2 PET imaging for tracking these histological variants (Fig. 1B and C). Third, non-invasive PET imaging of MetAP2 activity could be invaluable as a companion diagnostic test to predict and monitor responses to MetAP2 inhibitors in the near future. Collectively these data indicate that MetAP2 may be a valuable addition to the oncologist armamentarium for use as a prognostic indicator of biochemical recurrence and diagnostic imaging agent in PCa.
Supplementary Material
Significance:
This study defines MetAP2 as an early risk stratifier for molecular imaging of aggressive prostate cancer and describes a MetAP2-activated self-assembly small molecule PET tracer for imaging MetAP2 activity in vivo.
Acknowledgments:
This work was supported by NIH grant U54CA199075 (Center for Cancer Nanotechnology Excellence for Translational Diagnostics, CCNE-TD). J.X. thanks the Molecular Imaging Program at Stanford for the Molecular Imaging Young Investigator (MIYI) Prize. M.A.R. was supported by the U.S. Army Medical Research Acquisition Activity through the Congressionally Directed Medical Research Program (CDMRP) under Award No.’s W81XWH1810141. T.S. thanks the support from National Institute of Health/National Cancer Institute (NCI) (R37CA240822 and R03CA230819) and CDMRP (Award # W81XWH1810323). M.C. acknowledges the support from the Stanford Cancer Translational Nanotechnology Training (Cancer TNT) Program funded by NCI award (T32CA196585). L.C. was supported by a CDMRP Breast Cancer Research Program Breakthrough postdoctoral fellowship award (Award # W81XWH1810591). J.D.B. was supported by the National Institute of Health/National Cancer Institute (U01CA196387). The SR-SIM was funded by a NIH High End Instrumentation grant (Award Number 1S10OD01227601) from the National Center for Research Resources (NCRR). Opinions, interpretation, conclusions, and recommendations are those of the authors and not necessarily endorsed by the US Army and the funding agencies. We thank J. Mulholland at Stanford Cell Sciences Imaging Facility (CSIF) for help on SR-SIM, Stanford Shared FACS Facility for instrumentation and assistance with flow cytometry, Functional Genomics Facility at Stanford for access to LI-COR Odyssey for Western blots, and Stanford Center for Innovation in In-Vivo Imaging (SCI3) for micro-PET/CT imaging, and continued support of the Canary Foundation.
Footnotes
Conflict of interests: J.X., Z.C., Y.C., M.C., and J.R. are inventors on a U.S. patent application submitted by Leland Junior Stanford University that covers some of the work. All other authors declare that they have no competing interests.
Data and materials availability: All data associated with this study are present in the paper or Supplementary Materials. Materials are available and will be provided under the material transfer policies of Stanford University. These requests should be directed to the corresponding authors.
References
- 1.World Health Organization. WHO report on cancer: setting priorities, investing wisely and providing care for all. Geneva, Switzerland: World Health Organization; 2020. [Google Scholar]
- 2.Brooks JD. Managing localized prostate cancer in the era of prostate-specific antigen screening. Cancer 2013;119(22):3906–9. [DOI] [PMC free article] [PubMed] [Google Scholar]
- 3.Descotes JL. Diagnosis of prostate cancer. Asian Journal of Urology 2019;6(2):129–36. [DOI] [PMC free article] [PubMed] [Google Scholar]
- 4.Li R, Ravizzini GC, Gorin MA, Maurer T, Eiber M, Cooperberg MR, et al. The use of PET/CT in prostate cancer. Prostate cancer P D 2018;21(1):4–21. [DOI] [PubMed] [Google Scholar]
- 5.Evans JD, Jethwa KR, Ost P, Williams S, Kwon ED, Lowe VJ, et al. Prostate cancer-specific PET radiotracers: A review on the clinical utility in recurrent disease. Pract Radiat Oncol 2018;8(1):28–39. [DOI] [PubMed] [Google Scholar]
- 6.Lipianskaya J, Cohen A, Chen CJ, Hsia E, Squires J, Li Z, et al. Androgen-deprivation therapy-induced aggressive prostate cancer with neuroendocrine differentiation. Asian J Androl 2014;16(4):541–4. [DOI] [PMC free article] [PubMed] [Google Scholar]
- 7.Sheikhbahaei S, Werner RA, Solnes LB, Pienta KJ, Pomper MG, Gorin MA, et al. Prostate-specific membrane antigen (PSMA)-targeted pet imaging of prostate cancer: an update on important pitfalls. Semin Nucl Med 2019;49(4):255–70. [DOI] [PubMed] [Google Scholar]
- 8.Li X, Chang YH. Amino-terminal protein processing in Saccharomyces cerevisiae is an essential function that requires two distinct methionine aminopeptidases. Proc Natl Acad Sci U S A 1995;92(26):12357–61. [DOI] [PMC free article] [PubMed] [Google Scholar]
- 9.Tucker LA, Zhang Q, Sheppard GS, Lou P, Jiang F, McKeegan E, et al. Ectopic expression of methionine aminopeptidase-2 causes cell transformation and stimulates proliferation. Oncogene 2008;27(28):3967–76. [DOI] [PubMed] [Google Scholar]
- 10.Sin N, Meng L, Wang MQ, Wen JJ, Bornmann WG, Crews CM. The anti-angiogenic agent fumagillin covalently binds and inhibits the methionine aminopeptidase, MetAP-2. Proc Natl Acad Sci U S A 1997;94(12):6099–103. [DOI] [PMC free article] [PubMed] [Google Scholar]
- 11.Ingber D, Fujita T, Kishimoto S, Sudo K, Kanamaru T, Brem H, et al. Synthetic analogues of fumagillin that inhibit angiogenesis and suppress tumour growth. Nature 1990;348(6301):555–7. [DOI] [PubMed] [Google Scholar]
- 12.Benny O, Fainaru O, Adini A, Cassiola F, Bazinet L, Adini I, et al. An orally delivered small-molecule formulation with antiangiogenic and anticancer activity. Nat Biotechnol 2008;26(7):799–807. [DOI] [PMC free article] [PubMed] [Google Scholar]
- 13.Heinrich T, Seenisamy J, Blume B, Bomke J, Calderini M, Eckert U, et al. Discovery and structure-based optimization of next-generation reversible methionine aminopeptidase-2 (MetAP-2) Inhibitors. J Med Chem 2019;62(10):5025–39. [DOI] [PubMed] [Google Scholar]
- 14.Weidner N, Carroll PR, Flax J, Blumenfeld W, Folkman J. Tumor angiogenesis correlates with metastasis in invasive prostate carcinoma. Am J Clin Pathol 1993;143(2):401–9. [PMC free article] [PubMed] [Google Scholar]
- 15.Yamaoka M, Yamamoto T, Ikeyama S, Sudo K, Fujita T. Angiogenesis inhibitor TNP-470 (AGM-1470) potently inhibits the tumor growth of hormone-independent human breast and prostate carcinoma cell lines. Cancer Res 1993;53(21):5233–6. [PubMed] [Google Scholar]
- 16.Shuhendler AJ, Ye D, Brewer KD, Bazalova-Carter M, Lee KH, Kempen P, et al. Molecular magnetic resonance imaging of tumor response to therapy. Sci Rep 2015;5:14759. [DOI] [PMC free article] [PubMed] [Google Scholar]
- 17.Ye D, Shuhendler AJ, Cui L, Tong L, Tee SS, Tikhomirov G, et al. Bioorthogonal cyclization-mediated in situ self-assembly of small-molecule probes for imaging caspase activity in vivo. Nat Chem 2014;6(6):519–26. [DOI] [PMC free article] [PubMed] [Google Scholar]
- 18.Shen B, Jeon J, Palner M, Ye D, Shuhendler A, Chin FT, et al. Positron emission tomography imaging of drug-induced tumor apoptosis with a caspase-triggered nanoaggregation probe. Angew Chem Int Ed Engl 2013;52(40):10511–4. [DOI] [PMC free article] [PubMed] [Google Scholar]
- 19.Dragulescu-Andrasi A, Kothapalli SR, Tikhomirov GA, Rao J, Gambhir SS. Activatable oligomerizable imaging agents for photoacoustic imaging of furin-like activity in living subjects. J Am Chem Soc 2013;135(30):11015–22. [DOI] [PMC free article] [PubMed] [Google Scholar]
- 20.Oba Y, Yoshida N, Kanie S, Ojika M, Inouye S. Biosynthesis of firefly luciferin in adult lantern: decarboxylation of L-cysteine is a key step for benzothiazole ring formation in firefly luciferin synthesis. PLoS One 2013;8(12):e84023. [DOI] [PMC free article] [PubMed] [Google Scholar]
- 21.Liu Y, Miao Q, Zou P, Liu L, Wang X, An L, et al. Enzyme-Controlled Intracellular Self-Assembly of (18)F Nanoparticles for Enhanced MicroPET Imaging of Tumor. Theranostics 2015;5(10):1058–67. [DOI] [PMC free article] [PubMed] [Google Scholar]
- 22.Qiu L, Li X, Lv G, Seimbille Y, Li K, Peng Y, et al. Radiofluorinated Smart Probes for Noninvasive PET Imaging of Legumain Activity in Living Subjects. Anal Chem 2020;92(17):11627–34. [DOI] [PubMed] [Google Scholar]
- 23.Wang S, Gao D, Li K, Ye S, Liu Q, Peng Y, et al. Radiopharmacological evaluation of a caspase-3 responsive probe with optimized pharmacokinetics for PET imaging of tumor apoptosis. Org Biomol Chem 2020;18(18):3512–21. [DOI] [PubMed] [Google Scholar]
- 24.Chen Z, Chen M, Cheng Y, Kowada T, Xie J, Zheng X, et al. Exploring the condensation reaction between aromatic nitriles and amino thiols to optimize in situ nanoparticle formation for the imaging of proteases and glycosidases in cells. Angew Chem Int Ed Engl 2020;59(8):3272–9. [DOI] [PMC free article] [PubMed] [Google Scholar]
- 25.Hsu E-C, Rice MA, Bermudez A, Marques FJG, Aslan M, Liu S, et al. Trop2 is a driver of metastatic prostate cancer with neuroendocrine phenotype via PARP1. Proc Natl Acad Sci U S A 2020;117(4):2032–42. [DOI] [PMC free article] [PubMed] [Google Scholar]
- 26.Lapointe J, Li C, Higgins JP, van de Rijn M, Bair E, Montgomery K, et al. Gene expression profiling identifies clinically relevant subtypes of prostate cancer. Proc Natl Acad Sci U S A 2004;101(3):811–6. [DOI] [PMC free article] [PubMed] [Google Scholar]
- 27.Xie J, Huang X, Park MS, Pham HM, Chan WK. Differential suppression of the aryl hydrocarbon receptor nuclear translocator-dependent function by an aryl hydrocarbon receptor PAS-A-derived inhibitory molecule. Biochem Pharmacol 2014;88(2):253–65. [DOI] [PMC free article] [PubMed] [Google Scholar]
- 28.Goldstein AS, Drake JM, Burnes DL, Finley DS, Zhang H, Reiter RE, et al. Purification and direct transformation of epithelial progenitor cells from primary human prostate. Nat Protoc 2011;6(5):656–67. [DOI] [PMC free article] [PubMed] [Google Scholar]
- 29.Sahoo D, Wei W, Auman H, Hurtado-Coll A, Carroll PR, Fazli L, et al. Boolean analysis identifies CD38 as a biomarker of aggressive localized prostate cancer. Oncotarget 2018;9(5):6550–61. [DOI] [PMC free article] [PubMed] [Google Scholar]
- 30.Xiao Q, Zhang F, Nacev BA, Liu JO, Pei D. Protein N-terminal processing: substrate specificity of Escherichia coli and human methionine aminopeptidases. Biochemistry 2010;49(26):5588–99. [DOI] [PMC free article] [PubMed] [Google Scholar]
- 31.Zhang Y, Griffith EC, Sage J, Jacks T, Liu JO. Cell cycle inhibition by the anti-angiogenic agent TNP-470 is mediated by p53 and p21WAF1/CIP1. Proc Natl Acad Sci U S A 2000;97(12):6427–32. [DOI] [PMC free article] [PubMed] [Google Scholar]
- 32.Yeh JR, Mohan R, Crews CM. The antiangiogenic agent TNP-470 requires p53 and p21CIP/WAF for endothelial cell growth arrest. Proc Natl Acad Sci U S A 2000;97(23):12782–7. [DOI] [PMC free article] [PubMed] [Google Scholar]
- 33.Chappell WH, Lehmann BD, Terrian DM, Abrams SL, Steelman LS, McCubrey JA. p53 expression controls prostate cancer sensitivity to chemotherapy and the MDM2 inhibitor Nutlin-3. Cell Cycle 2012;11(24):4579–88. [DOI] [PMC free article] [PubMed] [Google Scholar]
- 34.Liu S, Widom J, Kemp CW, Crews CM, Clardy J. Structure of human methionine aminopeptidase-2 complexed with fumagillin. Science 1998;282(5392):1324–7. [DOI] [PubMed] [Google Scholar]
- 35.Li F, Ulrich ML, Shih VF, Cochran JH, Hunter JH, Westendorf L, et al. Mouse Strains Influence Clearance and Efficacy of Antibody and Antibody-Drug Conjugate Via Fc-FcgammaR Interaction. Mol Cancer Ther 2019;18(4):780–7. [DOI] [PubMed] [Google Scholar]
- 36.Schuster DM, Nanni C, Fanti S. PET tracers beyond FDG in prostate cancer. Semin Nucl Med 2016;46(6):507–21. [DOI] [PMC free article] [PubMed] [Google Scholar]
- 37.Zimmerman ME, Meyer AR, Rowe SP, Gorin MA. Imaging of prostate cancer with positron emission tomography. Clin Adv Hematol Oncol 2019;17(8):455–63. [PubMed] [Google Scholar]
- 38.Ferraro DA, Rupp NJ, Donati OF, Messerli M, Eberli D, Burger IA. 68Ga-PSMA-11 PET/MR Can Be False Positive in Normal Prostatic Tissue. Clin Nucl Med 2019;44(4):e291–e3. [DOI] [PubMed] [Google Scholar]
- 39.Queisser A, Hagedorn SA, Braun M, Vogel W, Duensing S, Perner S. Comparison of different prostatic markers in lymph node and distant metastases of prostate cancer. Mod Pathol 2015;28(1):138–45. [DOI] [PubMed] [Google Scholar]
- 40.Gasinska A, Jaszczynski J, Rychlik U, Luczynska E, Pogodzinski M, Palaczynski M. Prognostic significance of serum PSA level and telomerase, VEGF and GLUT-1 protein expression for the biochemical recurrence in prostate cancer patients after radical prostatectomy. Pathol Oncol Res 2019. [DOI] [PMC free article] [PubMed] [Google Scholar]
- 41.Minner S, Wittmer C, Graefen M, Salomon G, Steuber T, Haese A, et al. High level PSMA expression is associated with early PSA recurrence in surgically treated prostate cancer. Prostate 2011;71(3):281–8. [DOI] [PubMed] [Google Scholar]
- 42.Bostwick DG, Pacelli A, Blute M, Roche P, Murphy GP. Prostate specific membrane antigen expression in prostatic intraepithelial neoplasia and adenocarcinoma: a study of 184 cases. Cancer 1998;82(11):2256–61. [DOI] [PubMed] [Google Scholar]
- 43.Kruger EA, Figg WD. TNP-470: an angiogenesis inhibitor in clinical development for cancer. Expert Opin Investig Drugs 2000;9(6):1383–96. [DOI] [PubMed] [Google Scholar]
- 44.Logothetis CJ, Wu KK, Finn LD, Daliani D, Figg W, Ghaddar H, et al. Phase I trial of the angiogenesis inhibitor TNP-470 for progressive androgen-independent prostate cancer. Clin Cancer Res 2001;7(5):1198–203. [PubMed] [Google Scholar]
- 45.Zhou Y, Guo XC, Yi T, Yoshimoto T, Pei D. Two continuous spectrophotometric assays for methionine aminopeptidase. Anal Biochem 2000;280(1):159–65. [DOI] [PubMed] [Google Scholar]
Associated Data
This section collects any data citations, data availability statements, or supplementary materials included in this article.