

Abstract
Background:
Studies have shown that Black patients die more frequently following coronary artery bypass grafting (CABG) than their White counterparts for reasons not fully explained by disease severity or comorbidity. To examine whether provider care team segregation within hospitals contributes to this inequity, we analyzed national Medicare data.
Methods:
Using national Medicare data, we identified beneficiaries who underwent CABG at hospitals where procedures were performed on at least 10 Black and 10 White patients between 2008 to 2014 (n = 12,646). After determining the providers who participated in their perioperative care, we examined the extent to which Black and White patients were cared for by unique networks of provider care teams within the same hospital. We then evaluated whether a lack of overlap in composition of the provider care teams treating Black versus White patients (i.e., high segregation) was associated with higher 90-day operative mortality among Black patients.
Results:
The median level of provider care team segregation was high (0.89) but varied across hospitals (interquartile range, 0.85 to 0.90). On multivariable analysis, after controlling for patient-, hospital-, and community-level differences, mortality rates for White patients were comparable at hospitals with high and low levels of provider care segregation (5.4% [95% confidence interval {CI}, 4.7% to 6.1%] versus 5.8% [95% CI, 4.7% to 7.0%], respectively; P=0.601), while Black patients treated at high segregation hospitals had significantly higher mortality than those treated at low segregation hospitals (8.3% [95% CI, 5.4% to 12.4%] versus 3.3% [95% CI, 2.0% to 5.4%], respectively; P=0.017). The difference in mortality rates for Black and White patients treated at low segregation hospitals was non-significant (−2.5%; P=0.098).
Conclusions:
Black patients who undergo CABG at a hospital with a higher level of provider care team segregation die more frequently after surgery than Black patients treated at a hospital with a lower level.
Introduction
Numerous studies have shown that Black patients die more frequently following coronary artery bypass grafting (CABG) than their White counterparts for reasons that cannot be fully explained by disease severity or comorbidity.1,2 Moreover, while sources of administrative data reveal that Black and White patients have differential access to high quality hospitals for their cardiac surgical care,3–5 even among those treated in the same facility, a racial mortality inequity persists.6 Prior research suggests that this inequity is due, at least in part, to differences in the perioperative care received by Black and White patients.7
But why would Black and White patients treated in the same hospital receive different perioperative care? One possible explanation relates to the provider care teams to which Black and White patients are exposed. Empirical work demonstrates that the provider care teams embedded in communities with high versus low proportions of Black residents differ in measurable ways.8,9 Namely, providers in communities with high proportions of Black residents do not work together as often, and when they do, they tend to form insular teams that are isolated from others outside their immediate area. Further, patterns of provider care team interaction around shared patients correlate with CABG outcomes.10,11 Insofar as Black and White patients treated in the same hospital are served by unique and dissimilar provider care teams, they may receive separate and unequal perioperative care, resulting in the observed mortality gap.
In this context, we analyzed national Medicare claims from beneficiaries aged 66 years and older, who underwent CABG between 2008 and 2014. We identified the providers who participated in these patients’ perioperative care during their surgical episodes and had two goals in mind. First, we evaluated the extent to which Black and White patients, who underwent CABG at the same hospital, were exposed to different groups of providers around their episodes of care. We defined this as provider team segregation. Second, we then evaluated for an association between a hospital’s level of provider care team segregation and operative mortality.
Methods
The study was determined to be exempt from our institutional review board’s oversight. The data will not be made available to other researchers, but the analytic methods have been made available in the Data Supplement.
Data sources
We used national Medicare claims from a 20% random sample of beneficiaries, including data from the Carrier, Denominator, Medicare Provider Analysis and Review, and Outpatient research identifiable files. To characterize hospitals where beneficiaries received their care, we used data from the American Hospital Association Annual Survey.12 To better understand the communities (as defined by the hospital service area) served by these hospitals, we leveraged additional data from the Dartmouth Atlas Project and the American Community Survey.13,14
Study population
Through appropriate International Classification of Diseases, Ninth Revision,15 procedure codes, we identified White and Black fee-for-service beneficiaries 66 years of age and older who underwent CABG between January 1, 2008, and December 31, 2014 (Appendix Figure 1). As it is used by the Centers for Medicare & Medicaid Services in reports on health disparities, we used the Medicare Enrollment Database (MED) race variable from the Medicare Beneficiary Summary File. Use of the MED race variable has been shown to have good sensitivity and specificity in categorizing non-Hispanic White and Black beneficiaries when compared with the gold standard of self-identification.15a We required continuous enrollment in Medicare Parts A and B for six months before surgery (to allow comorbidity assessment) and 90 days after discharge (or until death). To ensure sufficient variation in our exposure, we excluded beneficiaries whose surgery was performed at a hospital where fewer than 10 Black and 10 White beneficiaries underwent CABG over the study interval.
Identifying provider care teams
For all patients in our cohort, we constructed a claims window beginning 90 days prior to their hospitalization for surgery until 90 days following discharge. The length of this window was informed by Medicare’s current value-based payment models.16,17 Next, we identified all providers who billed for services during the patients’ surgical episode. We then aggregated across all episodes over the study interval to construct the provider care team networks at each hospital. Previous studies have shown that medical claims can be used in this way to identify meaningful provider care team relationships.18,19
Assessing provider care team segregation
To assess provider care team segregation at a hospital, we first calculated the relative frequency of Black patients for each provider in a hospital’s care team network, bi. Specifically, we divided the number of Black patients that a given provider saw by the sum of that number over all providers in the hospital. We calculated the relative frequency of White patients, wi, in a similar fashion. We then took the difference between relative frequencies of Black and White patients summed over all providers using the equation below.
Expressed as an absolute value, our measure can range from 0 to 1. Zero represents a situation where, for each provider in a hospital’s care team network, the ratio between the numbers of Black and White patients treated by a provider is the same (i.e., no provider care team segregation exists). When our measure equals 1, the provider care teams are completely segregated such that each provider in a hospital’s care team treats only Black or only White patients. Our measure is equivalent to the dissimilarity index, which has been substantiated in the literature on healthcare disparities.4,20–22 To facilitate comparisons, we stratified hospitals into terciles based on their level of provider care team segregation.
Primary outcome
To evaluate the association between a hospital’s level of provider care team segregation and post-surgical outcomes, we measured 90-day operative mortality, defined as death from any cause during the patient’s index admission or within 90 days of discharge from the hospital.
Statistical analysis
For all analyses, our unit of analysis was the patient. We used parametric and non-parametric tests to compare patients who underwent CABG at hospitals with low, medium, and high provider care team segregation. In particular, we compared the groups on age, sex, race, level of comorbid illness (as measured by the Charlson index23), and socioeconomic status (assessed with a composite ZIP code-level measure24). In addition, we evaluated for differences in a patient’s admission priority. At the hospital level, our comparisons focused on the number of patients undergoing CABG, the number of providers on the care teams, ownership, bed size, geographic region, and teaching status. We also examined differences between communities served by these hospitals (as determined by the hospital service area) with respect to their healthcare capacity and several sociocultural factors.
We used multivariable regression to assess whether 90-day operative mortality varied with provider care team segregation. Given our binary outcome, we fit logistic models. We included our exposure, the level of provider care team segregation at the hospital where a beneficiary’s CABG was performed, as a three-level categorical variable. We controlled for the patient-, hospital-, and community-level confounders described above. We also included in our models year fixed effects. Because the effects of provider care team segregation, as well as those of our controls, on operative mortality may vary by a patient’s race, we included interaction terms between an indicator for patients of Black race and all covariates. Given our data’s nested structure, we calculated robust standard errors using the Huber-White sandwich estimator.25 To express the strength of association between provider care team segregation and mortality, conditional on race, we computed marginal effects using the least squares means method.26
Finally, we conducted a series of post hoc sensitivity analyses to test the robustness of our findings. First, since the observed segregation values for hospitals in our sample were tightly clustered with a small absolute difference between the low and high groups, we performed a simulation. For this, we randomly selected providers from each hospital to form simulated provider care teams for each patient, fixing the care team’s size. We then reassessed segregation values for hospitals, comparing them with the observed values. Second, we recomputed marginal effects using two alternative estimation strategies—recycled predictions and marginal effects at the mean.27,28 Third, we used appropriate Medicare specialty codes to exclude billing providers whose care we hypothesized would not influence operative mortality (e.g., optometrists, chiropractors, audiologists), as well as those not involved in face-to-face patient care (radiologists, pathologists). After recalculating our measure of provider care team segregation, we then re-estimated the relationship of our exposure with our mortality outcome. Fourth, to account for differences in disease severity that could be associated with both our outcome and exposure, we refit our models to include the Medicare Severity-Diagnosis Related Group for a beneficiary’s admission as a fixed effect. Fifth, given that early, in-hospital mortality may be influenced by surgeon skill rather than care team segregation, we excluded beneficiaries who died within three days of surgery from our models. Sixth, in recognition of the effects of surgeon experience on surgical outcomes, we repeated our primary analysis, adjusting for the treating surgeon’s average annual CABG caseload.
We performed all analyses using SAS Version 9.4 (Cary, NC). All of our statistical tests were two-tailed, with probability of Type 1 error set at 0.05. The annotated analytic code and more details of the modes is available in the Data Supplement.
Results
Over the seven-year study interval, a total of 12,646 patients met our inclusion criteria, 10% of whom were Black. They underwent CABG at one of 72 hospitals. The median number of providers who cared for each beneficiary during a surgical episode was 29 (interquartile range [IQR], 21 to 40). Appendix Tables 1 and 2 reveal the composition of these teams by provider specialty. The relative frequency of Black patients for each provider in a hospital’s care team network varied. There were examples where, in the same hospital, some providers cared exclusively for Black patients, while others treated none. Figure 1 reveals that levels of provider care team segregation were high (median, 0.89) and varied slightly across hospitals (IQR, 0.85 to 0.90). The lowest value observed on this measure was 0.78 (relatively low segregation); the highest was 0.96 (higher segregation). The Appendix Figure 2 reveals the distribution of care team segregation values across hospitals from the simulation that we performed, in which we randomly selected providers from each hospital to form simulated provider care teams for each patient, fixing the care team’s size. Compared to our real data, the simulated dataset demonstrated a lower median level of provider care team segregation (0.67) and wider variability (IQR, 0.59 to 0.76), suggesting that the observed levels were not due to chance alone.
Figure 1.
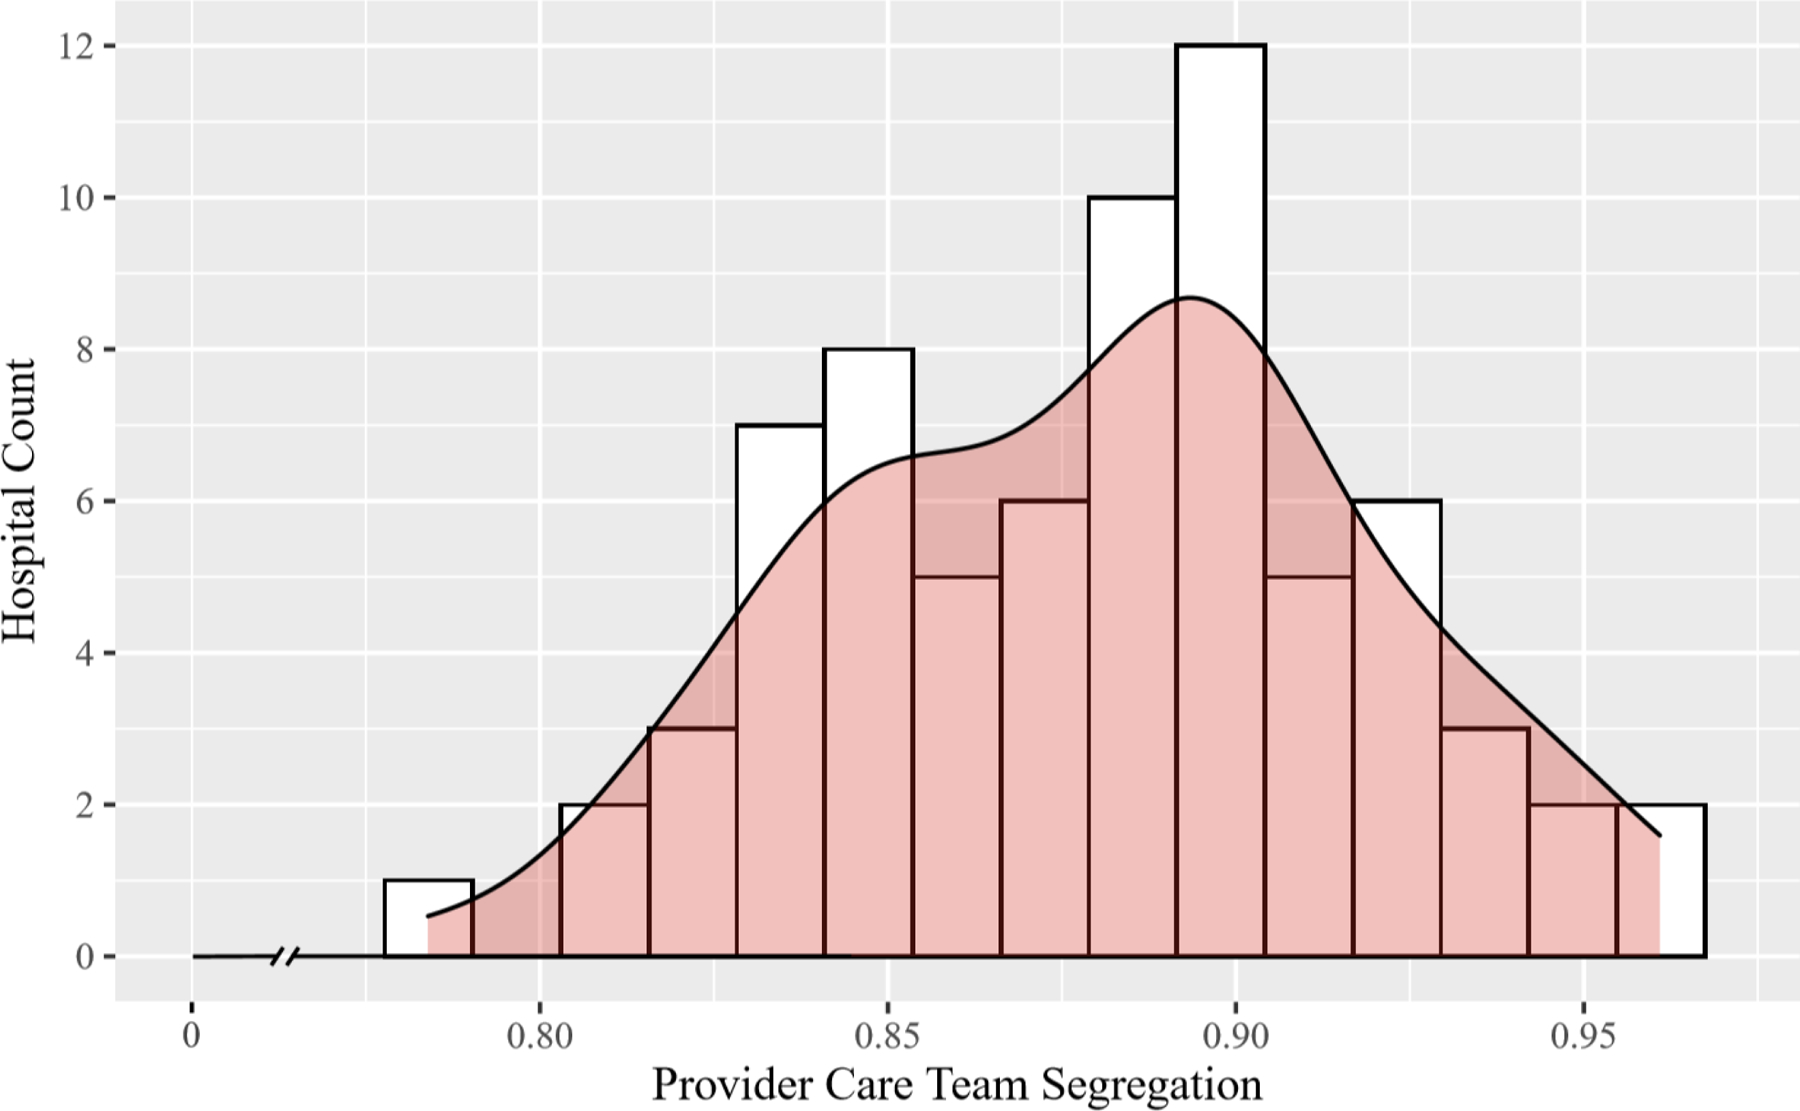
Histogram Depicting the Variability in the Level of Provider Care Team Segregation across Study Hospitals
As an illustrative example, Figure 2 depicts two Alabama hospitals from our cohort—one in Birmingham (A) and the other Mobile (B). In the figure, we observe the relative frequencies of Black and White patients seen by the providers in each hospital’s care team network, which are coded in red and blue, respectively. The hospitals served a comparable number of patients, and they had similar numbers of provider care team members. Despite these similarities, hospitals A had a considerably higher level of provider care team segregation than hospital B (0.91 versus 0.82, respectively), as well as markedly higher crude 90-day operative mortality rate for Black patients (4.3% versus 0.0%, respectively).
Figure 2.
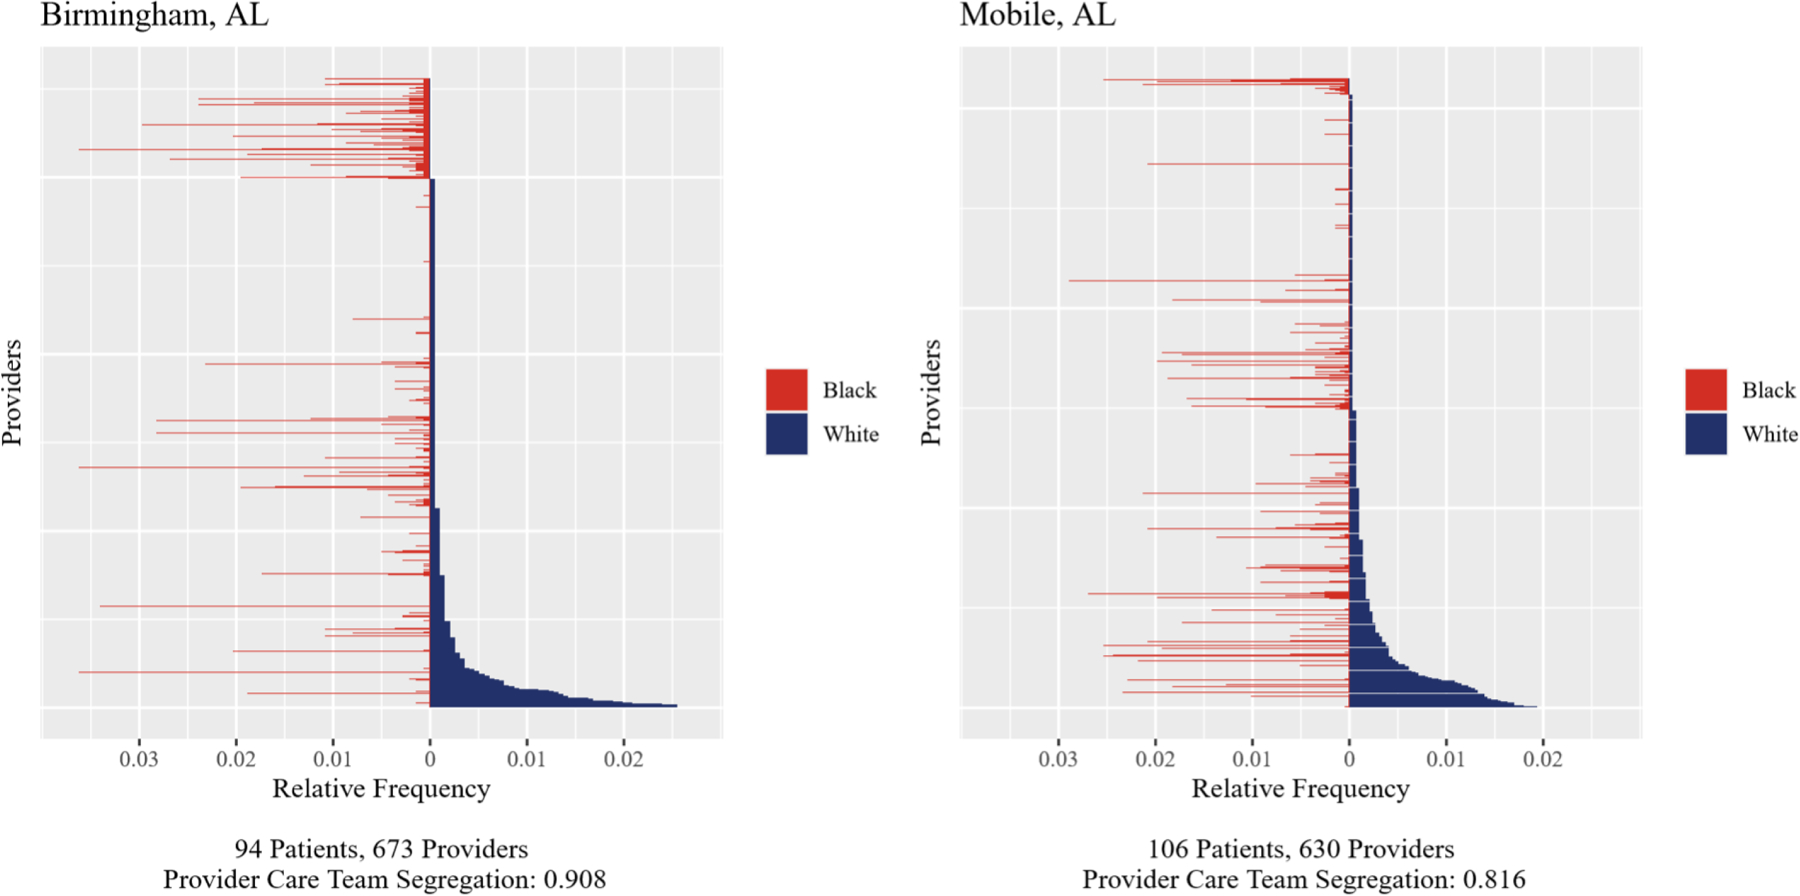
Illustrative Example of Two Hospitals in Alabama with High versus Low Provider Care Team Segregation
Each horizontal line represents a provider. The length of the red (blue) part represents the relative frequency of Black (White) patients seen by that provider, as defined in the fourth paragraph of the Methods. Providers are ordered by their relative frequency of White patients.
Table 1 compares patients treated at hospitals with high, medium, and low levels of provider care team segregation. Compared to patients who received care from hospitals with low segregation, those treated at medium and high segregation hospitals were more likely to be White, men, have a higher level of comorbid illness, and undergo an elective procedure (P<0.05 for each comparison). Within hospital segregation levels, Black patients tended to be younger, sicker, and poorer than their White counterparts (Appendix Table 3; P<0.05 for each comparison). They were also less often male and less likely to undergo CABG electively (Appendix Table 3; P<0.05 for each comparison). At the hospital level, hospitals with high and medium levels of provider care team segregation took care, on average, of more beneficiaries than those with low levels; the sizes of their provider care teams were also larger (Table 1; P<0.05 for each comparison). However, the communities served by these hospitals did not differ over a variety of healthcare capacity or sociocultural factors.
Table 1.
Bivariate Comparisons.
| Characteristic | All Hospitals | Low Segregation | Medium Segregation | High Segregation | P-Value* |
|---|---|---|---|---|---|
| Patient-level | |||||
| No. of patients | 12,414 | 3351 | 4189 | 4874 | -- |
| Age, mean (SD) | 74.7 (5.8) | 74.7 (5.8) | 74.6 (5.7) | 74.9 (5.9) | 0.01 |
| Male (%) | 8480 (68) | 2228 (66) | 2908 (69) | 3344 (69) | 0.02 |
| White (%) | 11,204 (90) | 2928 (87) | 3743 (89) | 4533 (93) | <0.01 |
| Charlson score (%) | <0.01 | ||||
| 0 | 2889 (23) | 845 (25) | 970 (23) | 1074 (22) | |
| 1 | 3190 (26) | 873 (26) | 1094 (26) | 1223 (25) | |
| ≥2 | 6335 (51) | 1633 (49) | 2125 (51) | 2577 (53) | |
| Socioeconomic status (%) | <0.01 | ||||
| Low | 4044 (32) | 1367 (40) | 1234 (29) | 1443 (30) | |
| Medium | 4041 (32) | 944 (28) | 1423 (34) | 1674 (34) | |
| High | 3983 (32) | 935 (28) | 1427 (34) | 1621 (33) | |
| Missing | 346 (4) | 105 (4) | 105 (3) | 136 (3) | |
| Elective procedure (%) | 6790 (55) | 1683 (50) | 2473 (59) | 2634 (54) | <0.01 |
| Hospital-level | |||||
| No. of hospitals | 72 | 24 | 24 | 24 | -- |
| No. of patients undergoing CABG, mean (SD) | 175.6 (89.1) | 142.0 (68.4) | 177.9 (71.8) | 207.1 (111.6) | 0.04 |
| No. of black patients undergoing CABG, mean (SD) | 16.8 (9.5) | 17.6 (9.0) | 18.6 (12.9) | 14.2 (4.4) | 0.25 |
| No. of providers in a hospital’s care team network, mean (SD) | 1503.5 (1092.5) | 978.7 (542.9) | 1432.0 (617.4) | 2099.6 (1531.4) | <0.01 |
| Proportion of patients from outside the CBSA | 0.4 (0.2) | 0.4 (0.2) | 0.4 (0.2) | 0.4 (0.2) | 0.44 |
| Ownership (%) | 0.82 | ||||
| For-profit | 5 (7) | 2 (8) | 2 (8) | 1 (4) | |
| Non-profit | 61 (85) | 21 (88) | 19 (79) | 21 (88) | |
| Other | 6 (8) | 1 (4) | 3 (13) | 2 (8) | |
| Bed size (%) | 0.77 | ||||
| <250 beds | 4 (6) | 2 (8) | 1 (4) | 1 (4) | |
| 251 – 500 beds | 24 (33) | 9 (38) | 6 (25) | 9 (38) | |
| >500 beds | 44 (61) | 13 (54) | 17 (71) | 14 (58) | |
| Geographic region (%) | 0.54 | ||||
| Northeast | 10 (14) | 1 (4) | 4 (17) | 5 (21) | |
| Midwest | 11 (15) | 4 (17) | 4 (17) | 3 (12) | |
| South | 51 (71) | 19 (79) | 16 (67) | 16 (67) | |
| West | 0 (0) | 0 (0) | 0 (0) | 0 (0) | |
| Teaching hospital (%) | 68 (94) | 21 (88) | 23 (96) | 24 (100) | 0.16 |
| HSA-level | |||||
| No. of acute care hospital beds per 1000 residents | 2.3 (0.8) | 2.5 (0.6) | 2.3 (1.0) | 2.1 (0.7) | 0.21 |
| No. of PCPs, per 100,000 residents | 71.5 (18.8) | 68.3 (18.1) | 74.3 (22.2) | 71.8 (16.1) | 0.51 |
| No. of medical specialists per 100,000 residents | 50.1 (17.8) | 46.4 (14.4) | 53.1 (20.7) | 50.8 (17.6) | 0.46 |
| No. of surgeons per 100,000 residents | 41.6 (10.3) | 38.2 (7.5) | 44.4 (12.8) | 42.1 (9.5) | 0.08 |
| Total resident population, in thousands | 507.3 (867.7) | 455.6 (569.5) | 409.8 (932.9) | 656.6 (1045.7) | 0.59 |
| Total black population, in thousands | 142.9 (233.0) | 157.8 (197.3) | 115.1 (239.1) | 155.7 (265.1) | 0.77 |
| Total Hispanic population, in thousands | 96.3 (299.4) | 50.9 (149.3) | 88.0 (337.1) | 149.9 (368.2) | 0.52 |
| Proportion of residents living below poverty line | 0.2 (0.1) | 0.2 (0.0) | 0.1 (0.1) | 0.1 (0.1) | 0.12 |
| Proportion of residents that obtained a graduate or professional degree, among residents that are 25 years or older | 0.1 (0.1) | 0.1 (0.1) | 0.1 (0.1) | 0.1 (0.0) | 0.75 |
| Proportion of residents living in a rural area | 0.3 (0.2) | 0.3 (0.2) | 0.3 (0.3) | 0.2 (0.2) | 0.32 |
Abbreviations: CBSA, core-based statistical area; HSA, hospital service area; No., number; PCP, primary care provider; SD, standard deviation.
For comparison between low, medium, and high segregation hospitals.
Figure 3 illustrates the adjusted 90-day mortality rates for Black and White patients undergoing CABG at hospitals with high, medium, and low levels of provider care team segregation (full results from our multivariable model can be found in the Appendix Table 4). Mortality rates for White patients were comparable at hospitals with high and low levels of provider care segregation hospitals (5.4% [95% confidence interval {CI}, 4.7% to 6.1%] versus 5.8% [95% CI, 4.7% to 7.0%], respectively; P=0.601), but Black patients treated at high segregation hospitals had significantly higher mortality rates than those treated at low segregation hospitals (8.3% [95% CI, 5.4% to 12.4%] versus 3.3% [95% CI, 2.0% to 5.4%], respectively; P=0.017). Although the magnitude of this association varied, its directionality and clinical significance were consistent across several sensitivity analyses (Table 2). The difference in mortality rates between Black and White patients treated at low segregation hospitals was non-significant (Figure 3: −2.5%; P=0.098). Comparisons between medium and high and medium and low segregation hospitals on 90-day mortality by patient race demonstrated numerical differences that were not statistically significant (Figure 3).
Figure 3.
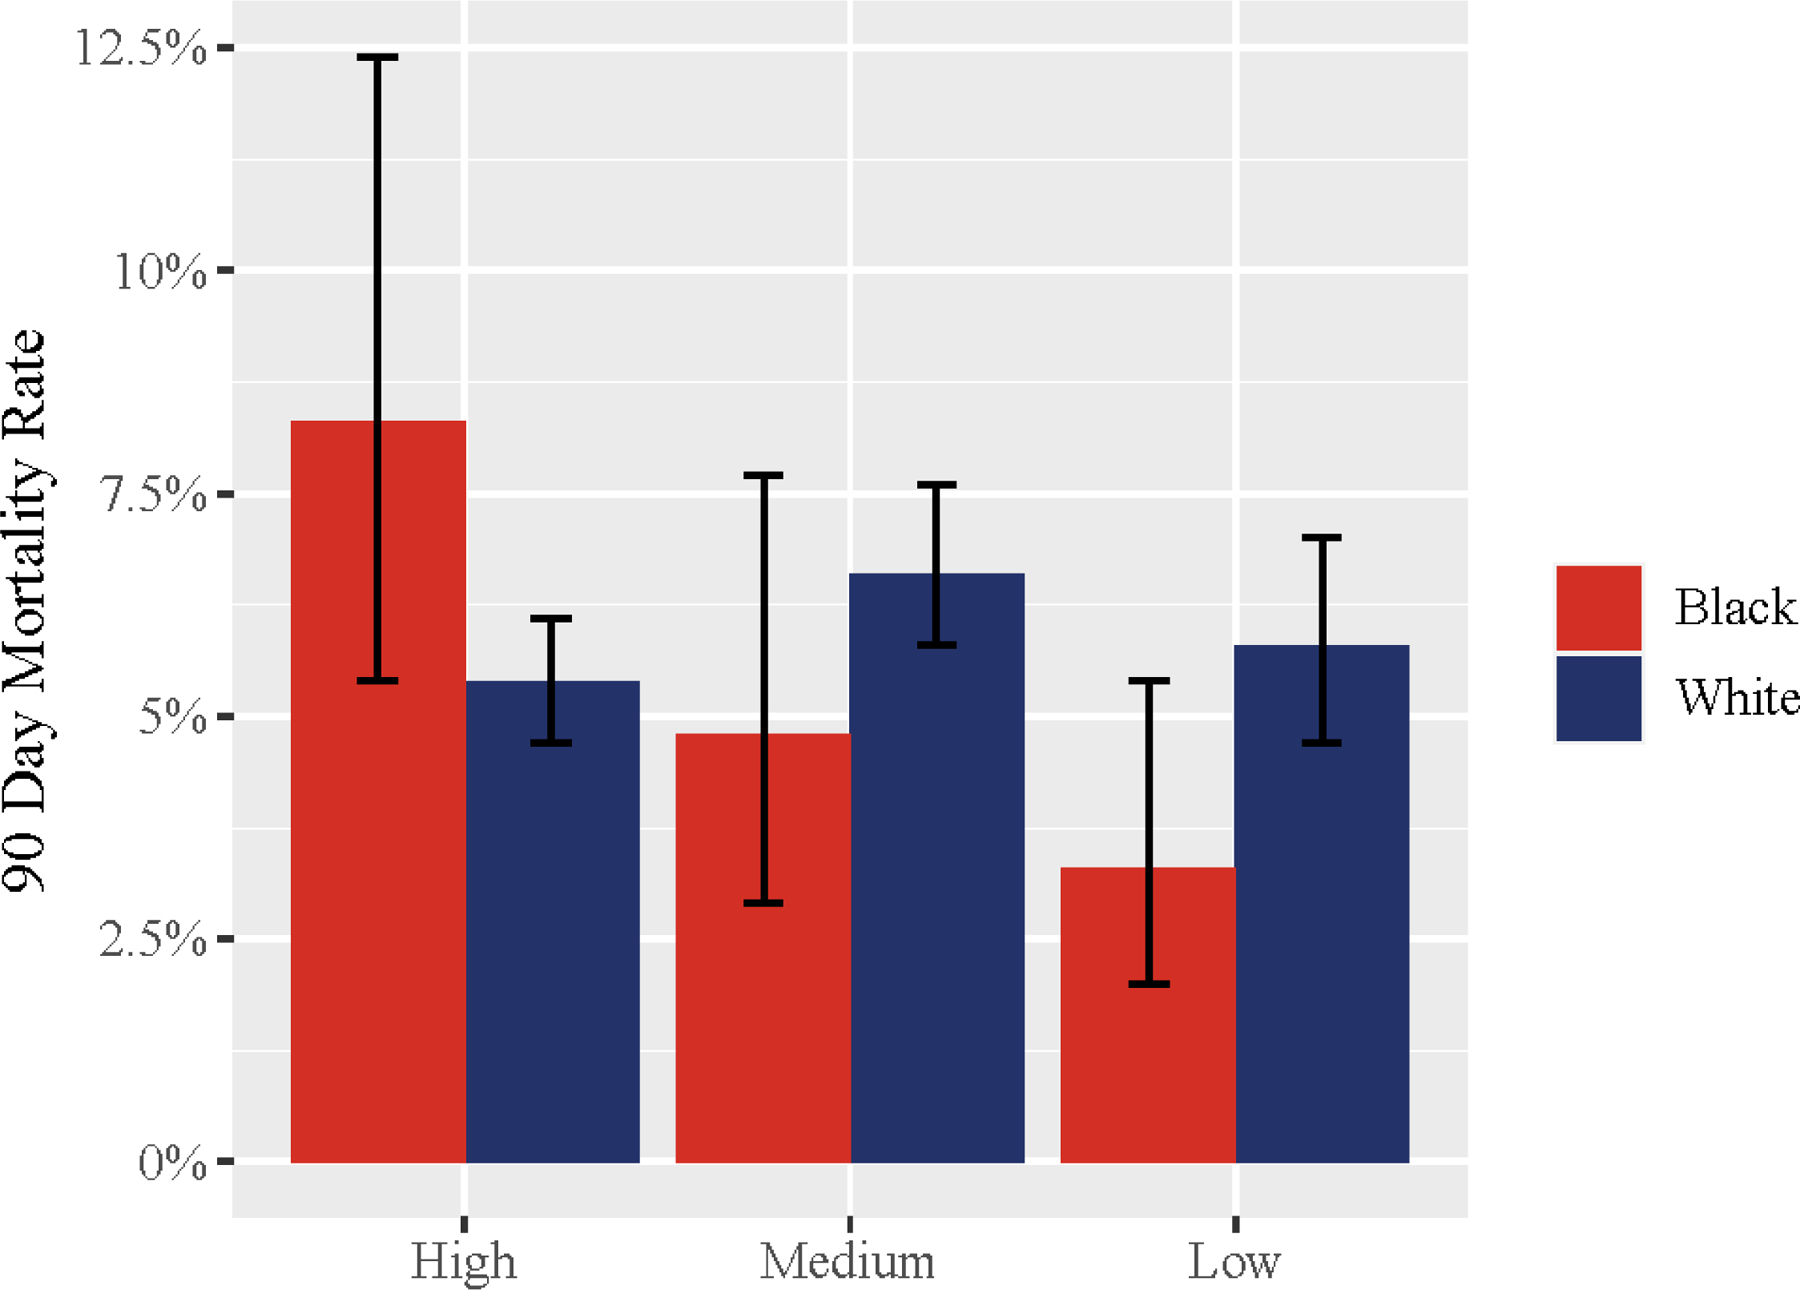
Adjusted Operative Mortality Rates Among Black and White Patients by a Hospital’s Level of Provider Care Team Segregation
Table 2.
Results of Sensitivity Analyses
| Differences in 90-Day Operative Mortality | ||
|---|---|---|
| White/High and White/Low | Black/High and Black/Low | |
| Alternative estimation strategies for marginal effects | ||
| Recycled predictions | −0.5%* | 6.0%* |
| Marginal effects at the mean | −0.4% | 4.5%* |
| Excluding providers whose care should not influence mortality | 0.6% | 4.7%* |
| Including MS-DRG fixed effects | −0.4% | 3.0% |
| Excluding patients who died within three days of surgery | −0.7% | 2.7% |
| Adjusting for a Treating Surgeon’s Average Annual CABG Caseload | −0.4% | 4.9%* |
Abbreviations: CABG, coronary artery bypass grafting; MS-DRG, Medicare Severity-Diagnosis Related Group.
Denotes P<0.05 for the difference.
Discussion
Our study has two main findings. First, in the Medicare population, there exists high provider care team segregation between White and Black patients undergoing CABG within the same hospital in facilities across the U.S. This essentially means that there are often unique systems of provider care teams, which treat Black patients but do not overlap with those of White patients. Second, we found that Black patients have significantly higher operative mortality rates when treated at hospitals with higher provider care team segregation than Black patients who are treated at hospitals with lower provider care team segregation. Equally important is that Black patients have operative mortality rates that are comparable to those of their White counterparts when treated at hospitals with lower provider care team segregation.
To provide some context for our findings, the median level of provider care team segregation that we observed for hospitals where CABG occurred was high (0.89) when compared to other healthcare settings like U.S. nursing homes (0.65) and neonatal intensive care units (0.50)21,22 or even non-healthcare settings like high schools.29 Many factors may contribute to this, including patient preference. Empirical work demonstrates that racially concordant and discordant patient-physician interactions have different satisfaction levels.30 As such, Black and White patients may seek out physicians of the same race with whom they feel more comfortable engaging and sharing information, leading to de facto segregation. Alternatively, differences may exist between Black and White patients with respect to admission priority.7 In particular, Black patients are much more likely to undergo CABG on an emergent basis than their White counterparts,7 and the provider care teams for these procedures are anticipated to differ from those of procedures done electively.
A more insidious explanation relates to structural racism. Although sanctioned forms of hospital segregation have been eliminated, the social and economic pressures unique to healthcare may be perpetuating the informal segregation of Black and White patients to certain provider care teams within the same hospital that may have variable resources. How could this happen? For one, the assignment of patients to provider care teams is an opaque and complex process at hospitals that remains largely insulated from public scrutiny and political control.20 The external monitoring of them that does exist (e.g., The Joint Commission) does not generally focus on issues of race, allowing them to linger “out of sight, out of mind.” Second, some providers at a given hospital might make profit-minded decisions to limit the patients that they treat through managed care contracting, payment criteria, or physical location, which might also intersect with differences by race.20 Third, there could be racial divisions in referrals among providers at the hospital that exist through informal relationships (e.g., certain networks of cardiac surgeons, cardiologists, and primary care physicians work regularly together, and these providers segregate themselves based on race).20 While we must be cautious about inferring causation from these observational data, our findings indicate that Black patients who are cared for by provider teams, which predominantly treat Black patients experience worse outcomes than Black patients seen by providers who treat additional races. The major concern is that Black patients are being systematically blocked from accessing greater resources through certain sets of providers that White patients can attain more freely. A deeper understanding of the process of patient sorting based on race and its clinical implications will require future investigation.
Our findings must be viewed in the context of several limitations. First and foremost, the operative mortality differences that we observed among Black patients treated at hospitals with high versus low provider care team segregation are not intended to be a comprehensive explanation for all racial inequities in CABG outcomes. Indeed, a variety of factors have been explored to account for such inequities. Undoubtedly, many act in concert to influence CABG outcomes, and our purpose in advancing health system factors as a potential contributor is not to supersede other proposed mechanisms but to supplement them. Nonetheless, while predisposition to chronic diseases like hypertension surely stimulates racial inequities, factors like it are outside the immediate control of either patients or providers. Health system factors similar to provider care team segregation, by contrast, offer a tangible, accessible corrective that deserves further study.
Second, while we controlled for differences between patients and hospitals in our modeling approach, we readily acknowledge that we are describing association. There is certainly the possibility of residual confounding suggesting that other features that are associated with higher levels of segregation may correlate with outcomes especially given the complexity of a procedure like CABG. For instance, there are key technical issues around CABG (e.g., small vessel caliber, the presence of aortic calcification, time on bypass), which can affect post-surgical outcomes, but that are not captured in medical claims. Insofar as omitted variables exist, our estimate of the association between provider care team segregation and operative mortality could be biased. However, we have no reason to suspect that these technical issues would differ systematically between hospitals with low versus high provider care team segregation. Third, the care teams that we identified were composed solely of those who billed for services around a patient’s surgical episode. We fully recognize that the care of nurses and other providers (e.g., clinical pharmacists, respiratory therapists), which may have an impact on outcomes, is missed with a claims-based approach. Fourth, we focused specifically on Medicare beneficiaries who underwent CABG. Accordingly, our sample is not necessarily representative of those with commercial insurance. Fifth, we did not examine other coronary revascularization procedures. There could be something systematically different about referral patterns for percutaneous coronary interventions in areas with low segregation hospitals, which might affect the denominator of patients undergoing CABG in these areas. Lastly, it is also unclear whether the observed relationship between provider care team segregation and operative mortality is unique to our context of CABG or if it might be generalizable to other types of surgical procedures.
Notwithstanding these limitations, our findings serve to inform efforts aimed at reducing racial inequities in surgical outcomes. To date, most racial inequities research has focused on the contributions of social determinants (i.e., socioeconomic and demographic factors that over a person’s life course can result in better or poorer health status) and healthcare access (whether or not patients can obtain prompt curative services for their surgical problems). While this research is certainly important, if we are to have any chance at reducing existing inequities, attention must also be paid to actionable health system factors. Along these lines, our study provides a blue print for the type of research that needs to be conducted in this area. Not only does our study add to our understanding of the health system factors that might exacerbate racial inequities in surgical outcomes, but it also reveals an organizational problem within hospitals that providers can control and manipulate “on the ground” right now for all patients. For example, if structural factors are determined to be a driver of the observed segregation, then enhanced learning and professional development activities around implicit bias and cultural humility, combined with outreach and pipeline strategies to achieve greater compositional diversity in the workforce, could lead to greater provider care team integration and hopefully improved surgical outcomes among Black patients.
Conclusions
We found a high degree of provider care team segregation between White and Black patients undergoing CABG within the same hospital. Black patients undergoing CABG at hospitals with a higher level of provider care team segregation die more frequently after surgery than Black patients treated at a hospital with a lower level of provider care team segregation. A sustained program of research, synthesizing both quantitative (such as our own) and qualitative analyses of provider decision making in situ, is needed for us to better understand the contexts that shape provider care teams for Black and White patients. This understanding will allow hospital and health system leaders to incentivize desirable interactions between providers, potentially reducing persistent healthcare inequities.
Supplementary Material
Data Supplement: Available at https://github.com/bnallamo/Hollingsworth-Circ-CQO-2021.git
What is known:
Black patients die more frequently following coronary artery bypass grafting (CABG) than their white counterparts, even when they are treated in the same hospital, for reasons that cannot be fully explained by disease severity or comorbidity.
One possible explanation for this racial inequity relates to differences in the provider care teams to which Black and white patients in the same hospital are exposed.
What the study adds:
In the Medicare population, there is a lack of overlap in the composition of the provider care teams that treat Black and white patients undergoing CABG in the same hospital (i.e., provider care team segregation).
Black patients have significantly higher operative mortality rates when treated at hospitals with high levels of provider care team segregation than Black patients who are treated at hospitals with lower levels.
Reducing provider care team segregation within a hospital may represent an actionable health system factor for reducing racial inequities following CABG.
Sources of Funding
Dr. Hollingsworth is supported by grants from the Agency for Healthcare Research and Quality (R01HS026908, R01HS024525, and R01HS024728), the National Institute of Diabetes and Digestive and Kidney Diseases (R01DK121709), and the National Institute on Aging (R01AG068074).
Non-standard Abbreviations and Acronyms
- CABG
coronary artery bypass grafting
Footnotes
Disclosure Statement
There are no relevant disclosures or conflicts of interest for the authors.
References
- 1.Becker ER, Rahimi A. Disparities in race/ethnicity and gender in in-hospital mortality rates for coronary artery bypass surgery patients. J Natl Med Assoc. 2006;98:1729–1739. [PMC free article] [PubMed] [Google Scholar]
- 2.Bridges CR, Edwards FH, Peterson ED, Coombs LP. The effect of race on coronary bypass operative mortality. J Am Coll Cardiol. 2000;36:1870–1876. [DOI] [PubMed] [Google Scholar]
- 3.Rangrass G, Ghaferi AA, Dimick JB. Explaining racial disparities in outcomes after cardiac surgery: the role of hospital quality. JAMA Surg. 2014;149:223–227. [DOI] [PubMed] [Google Scholar]
- 4.Dimick J, Ruhter J, Sarrazin MV, Birkmeyer JD. Black Patients More Likely Than Whites To Undergo Surgery At Low-Quality Hospitals In Segregated Regions. Health Affair. 2013;32:1046–1053. [DOI] [PMC free article] [PubMed] [Google Scholar]
- 5.Khera R, Vaughan-Sarrazin M, Rosenthal GE, Girotra S. Racial Disparities in Outcomes After Cardiac Surgery: the Role of Hospital Quality. Curr Cardiol Rep. 2015;17:29. [DOI] [PMC free article] [PubMed] [Google Scholar]
- 6.Skinner J, Chandra A, Staiger D, Lee J, McClellan M. Mortality after acute myocardial infarction in hospitals that disproportionately treat black patients. Circulation. 2005;112:2634–2641. [DOI] [PMC free article] [PubMed] [Google Scholar]
- 7.Konety SH, Sarrazin MSV, Rosenthal GE. Patient and hospital differences underlying racial variation in outcomes after coronary artery bypass graft surgery. Circulation. 2005;111:1210–1216. [DOI] [PubMed] [Google Scholar]
- 8.Hollingsworth JM, Funk RJ, Garrison SA, et al. Differences Between Physician Social Networks for Cardiac Surgery Serving Communities With High Versus Low Proportions of Black Residents. Med Care. 2015;53:160–167. [DOI] [PubMed] [Google Scholar]
- 9.Ghomrawi HMK, Funk RJ, Parks ML, Owen-Smith J, Hollingsworth JM. Physician referral patterns and racial disparities in total hip replacement: A network analysis approach. Plos One. 2018;13:e0193014. [DOI] [PMC free article] [PubMed] [Google Scholar]
- 10.Hollingsworth JM, Funk RJ, Garrison SA, et al. Association Between Physician Teamwork and Health System Outcomes After Coronary Artery Bypass Grafting. Circ-Cardiovasc Qual. 2016;9:64. [DOI] [PMC free article] [PubMed] [Google Scholar]
- 11.Funk RJ, Owen-Smith J, Kaufman SA, Nallamothu BK, Hollingsworth JM. Association of Informal Clinical Integration of Physicians With Cardiac Surgery Payments. Jama Surgery. 2018;153:446–453. [DOI] [PMC free article] [PubMed] [Google Scholar]
- 12.Kralovec PD, Mullner R. The American Hospital Association’s Annual Survey of Hospitals: continuity and change. Health Serv Res. 1981;16:351–355. [PMC free article] [PubMed] [Google Scholar]
- 13.U.S. Census Bureau. 2008–2014 American Community Survey Public Use Microdata Samples [SAS Data file]. Retrieved from https://www.census.gov/programs-surveys/acs/data/pums.html. Accessed on March 5, 2021.
- 14.Dartmouth Atlas Project. Available at https://atlasdata.dartmouth.edu/. Accessed on June 1, 2020.
- 15.World Health Organization. (1978). International classification of diseases : [9th] ninth revision, basic tabulation list with alphabetic index. World Health Organization. Available at: https://apps.who.int/iris/handle/10665/39473. [Google Scholar]
- 15a.Jarrín OF, Nyandege AN, Grafova IB, Dong X, Lin H. Validity of Race and Ethnicity Codes in Medicare Administrative Data Compared With Gold-standard Self-reported Race Collected During Routine Home Health Care Visits. Medical Care. 2020; 58:e1–e8. [DOI] [PMC free article] [PubMed] [Google Scholar]
- 16.Centers for Medicare & Medicaid Services. Bundled Payments for Care Improvement Advanced Model. Available at: https://innovation.cms.gov/innovation-models/bpci-advanced. Accessed on June 1, 2020.
- 17.Centers for Medicare & Medicaid Services. The Comprehensive Care for Joint Replacement Model. Available at: https://innovation.cms.gov/innovation-models/cjr. Accessed on June 1, 2020.
- 18.Barnett ML, Landon BE, O’Malley AJ, Keating NL, Christakis NA. Mapping Physician Networks with Self-Reported and Administrative Data. Health Services Research. 2011;46:1592–1609. [DOI] [PMC free article] [PubMed] [Google Scholar]
- 19.Everson J, Funk RJ, Kaufman SR, et al. Repeated, Close Physician Coronary Artery Bypass Grafting Teams Associated with Greater Teamwork. Health Services Research. 2018;53:1025–1041. [DOI] [PMC free article] [PubMed] [Google Scholar]
- 20.Sarrazin MSV, Campbell ME, Richardson KK, Rosenthal GE. Racial Segregation and Disparities in Health Care Delivery: Conceptual Model and Empirical Assessment. Health Services Research. 2009;44:1424–1444. [DOI] [PMC free article] [PubMed] [Google Scholar]
- 21.Horbar JD, Edwards EM, Greenberg LT, et al. Racial Segregation and Inequality in the Neonatal Intensive Care Unit for Very Low-Birth-Weight and Very Preterm Infants. Jama Pediatr. 2019;173:455–461. [DOI] [PMC free article] [PubMed] [Google Scholar]
- 22.Smith DB, Feng ZL, Fennel ML, Zinn JS, Mor V. Separate and unequal: Racial segregation and disparities in quality across US nursing homes. Health Affair. 2007;26:1448–1458. [DOI] [PubMed] [Google Scholar]
- 23.Klabunde CN, Potosky AL, Legler JM, Warren JL. Development of a comorbidity index using physician claims data. J Clin Epidemiol. 2000;53:1258–1267. [DOI] [PubMed] [Google Scholar]
- 24.Diez Roux AV, Merkin SS, Arnett D, et al. Neighborhood of residence and incidence of coronary heart disease. N Engl J Med. 2001;345:99–106. [DOI] [PubMed] [Google Scholar]
- 25.Williams RL. A note on robust variance estimation for cluster-correlated data. Biometrics. 2000;56:645–646. [DOI] [PubMed] [Google Scholar]
- 26.Cai W Making comparisons fair: How LS-means unify the analysis of linear models. SAS Institute Inc. Paper SAS060–2014. Available at: https://support.sas.com/resources/papers/proceedings14/SAS060-2014.pdf. Accessed on June 30, 2020. [Google Scholar]
- 27.Li Z, Mahendra G. Using “recycled predictions” for computing marginal effects. SAS Global Forum; 2010. Paper 272–2010. Available at: https://support.sas.com/resources/papers/proceedings10/272-2010.pdf. Accessed on Jun 30, 2020. [Google Scholar]
- 28.Bartus T Estimation of marginal effects using margeff. The State Journal. 2005;5:309–329. [Google Scholar]
- 29.School Segregation Data for U.S. Metro Areas. Governing website. Available at: https://www.governing.com/archive/school-segregation-dissimilarity-index-for-metro-areas.html. Accessed on February 9, 2021.
- 30.Assari S Psychosocial determinants of communication satisfaction in racially concordant and discordant patient-physician interactions. Journal of Medical Research and Innovation. 2019;3:e000165. [DOI] [PMC free article] [PubMed] [Google Scholar]
Associated Data
This section collects any data citations, data availability statements, or supplementary materials included in this article.
Supplementary Materials
Data Supplement: Available at https://github.com/bnallamo/Hollingsworth-Circ-CQO-2021.git