

Abstract
We describe the design and synthesis of OFS-1, an Osteoadsorptive Fluorogenic Sentinel imaging probe that is adsorbed by hydroxyapatite (HAp) and bone mineral surfaces, where it generates an external fluorescent signal in response to osteoclast-secreted cathepsin K (Ctsk). The probe consists of a bone-anchoring bisphosphonate moiety connected to a Förster resonance energy transfer (FRET) internally quenched fluorescent (IQF) dye pair, linked by a Ctsk peptide substrate, GHPGGPQG. Key structural features contributing to the effectiveness of OFS-1 were defined by SAR and modeling studies comparing OFS-1 with two cognates, OFS-2 and OFS-3. In solution or when pre-adsorbed on HAp, OFS-1 exhibited strong fluorescence when exposed to Ctsk (2.5–20 nM). Time-lapse photomicrographs obtained after seeding human osteoclasts onto HAp-coated well plates containing pre-adsorbed OFS-1 revealed bright fluorescence at the periphery of resorbing cells. OFS-1 administered systemically detected early osteolysis co-localized with orthotopic engraftment of RPMI-8226-Luc human multiple myeloma cells at a metastatic skeletal site in a humanized mouse model. OFS-1 is thus a promising new imaging tool for detecting abnormal bone resorption.
Keywords: imaging, fluorescence, bone, cathepsin K, bisphosphonate, cancer, multiple myeloma, osteoclast
Introduction
Osteoclasts are terminally differentiated monocytic myeloid immune cells that are specialized to lower the pH at the bone surface, in order to demineralize its hydroxyapatite (HAp) mineral component. Osteoclasts also secrete cathepsin K (Ctsk), a cysteine protease that degrades the bone collagen matrix.1–2 Osteolysis is a prominent pathology of multiple myeloma and is strongly correlated with skeletal morbidity and lethal progression, thus early detection of tumor-induced osteoclastic activity is greatly desirable for more accurate diagnosis and prognosis.3 More generally, in situ detection of Ctsk activity both in vitro and in vivo would be very useful for studying the role of this enzyme in other bone diseases. Ctsk-activated fluorogenic probes exploit the phenomenon of Förster resonance energy transfer (FRET) internally quenched fluorescence (IQF) by linking the emitting and quenching fluorophores with a bridging peptide that is specifically cleaved by Ctsk. This permits prompt separation of the paired chromophores by diffusion, thereby ‘turning on’ external fluorescence.4–6 The emergence of ‘smart probes’ that fluoresce in the presence of activating stimuli holds great promise for new imaging applications.7–8
The scope of these probes is generally limited by the fact that activating stimuli is not exclusively present in target tissue, which leads to off-target activation. One recent effort to address this shortcoming has been the development of AND-gate probes that require activation of two separate proteases to generate fluorescence.8 Probes developed for the imaging of bone remodeling and pathogenesis are similarly limited in that they are not selectively and persistently localized in bone tissue. The development of pH-activatable probes by Kikuchi et al. utilizes a previously established strategy where a bone-targeting moiety directs a conjugated fluorescent system to the target site.9 The incorporation of a pH-activatable fluorophore allows for sensitive monitoring of the bone remodeling environment at the target site.9 In an alternative strategy to address the overarching problem with bone imaging probes, we sought to design an IQF probe incorporating such a bone-targeting moiety. To this end, we gave priority of consideration to a bisphosphonate (BP). BPs exhibit strong affinity for bone mineral, where they may remain adsorbed for weeks to years depending on their structure.10−12 Certain clinical BPs, notably zoledronate (ZOL) and risedronate (RIS), were previously conjugated directly with fluorescent dyes in our laboratory to provide versatile ‘always on’ imaging reagents that bind avidly to hydroxyapatite (HAp) in vitro and to bone mineral in vivo.13−20 In the present instance, we aimed to create a ‘sentinel’ fluorescent compound that would remain dark after adsorption on the bone surface until switched on by Ctsk released locally at the onset of osteoclastic bone resorption: OFS, an Osteoadsorptive Fluorogenic Sentinel probe (Figure 1).
Figure 1.

The OFS concept: an IQF dye pair bridged by a Ctskspecific peptide substrate incorporates a BP moiety, resulting in highly specific adsorption of the probe on bone surfaces. Cleavage of the peptide linker by Ctsk secreted by a bone-resorbing osteoclast ‘turns on’ an externally detectable fluorescent signal due to diffusive separation of the quenching dye. The Gly-Gly site cleavage is illustrative (see Results and Discussion).
We here report the design and synthesis of OFS-1, a unique osteoclast Ctsk-activated IQF imaging agent that strongly and specifically binds to bone surfaces. OFS-1 adsorbed on HAp does not fluoresce but generates an intense fluorescent signal when activated by Ctsk in solution or when adsorbed on an HAp surface and exposed to resorbing human osteoclasts. Intriguingly, when administered systemically in vivo, OFS-1 detected early osteolysis co-localized with orthotopic engraftment of multiple myeloma cells at a skeletal site in an immunocompetent humanized multiple myeloma mouse model.
Results and Discussion
Design of OFS-1
Selection of the IQF dye pair.
A necessary condition for efficient Förster Resonance energy transfer is good overlap between the emission spectrum of the fluorophore and the absorbance spectrum of the quencher. Fluorescein (FAM, emission λmax = 665 nm) was selected as the primary fluorophore for visible light microscopy (OFS-1) based on its longstanding and very wide applications in imaging studies. This suggested Black Hole Quencher-1 (BHQ-1, quenching range λ = 620–730 nm) as the quenching dye of choice, as it has excellent spectral overlap with FAM and its effectiveness as an IQF quencher of FAM is well established.21
Selection of the Ctsk cleavable peptide linker for the IQF dye pair.
Ctsk is an important target for the treatment of osteoporosis22–23 and its substrate specificity has been extensively investigated.24 Among the mammalian cysteine cathepsins, the primary determinant of its substrate specificity is a proline residue in the P2 position.24 We selected GHPGGPQG as the linker-substrate for OFS-1, as a racemization-resistant analogue of the HPGGPQ peptide which was shown to be selectively cleaved by Ctsk24 and subsequently made available commercially.
Selection of the bisphosphonate and trifunctional scaffold.
Because it seemed likely that facility in adjusting separation of the osteoadsorptive BP moiety from the fluorogenic unit would be desirable in OFS probes to minimize steric clashes around the peptide Ctsk substrate, we favored a BP with a terminal aminoalkyl (H2N(CH2)n-side chain at the PCP bridging carbon, such as alendronate (n = 3, ALA) or pamidronate (n = 2, PAM), which both have high bone-affinity and well-defined pharmacology.14 Although these BPs have an α-hydroxy substituent which was a potential synthetic liability, we decided that the augmentation of overall bone affinity expected from this group was worthwhile to retain.17
As the constituent moieties of OFS-1–the two IQF dyes, their peptide-linker and the BP–would be conjoined via their respective carboxylate and amino groups, we chose lysine, with its complementary, orthogonally protectable α- and ε-amino and carboxylate groups, as the assembly scaffold to enable amido connections of all components. Likewise, as a small spacer inserted between the peptide and the scaffold to increase their spatial separation, we utilized β-alanine.
Synthesis of OFS-1
The design of the synthesis was driven by considerations of modularity (ready adaptation to other dye pairs, peptide substrates and BPs) and of deferring incorporation of the most expensive component (the quenching dye) to the final step. The final synthetic route, involving 10 steps, is shown in Scheme 1. α-N-Fmoc ε-N-Boc (l)-lysine (1) was activated by conversion to its sulfo NHS ester and coupled with PAM, then selectively deprotected with TFA at the ε-amino nitrogen to give the carboxamide 2. This intermediate was reacted with 5-carboxyfluorescein (5-FAM) activated as its N-hydroxy succinimidyl ester to form 3 (alternatively, the less expensive 5(6)-FAM isomer mixture can be used and the preferentially formed 5-FAM derivative (3) isolated by preparative RP HPLC). After removal of the Fmoc protecting group by treatment with piperidine in DMF, N-Boc-β-alanine was reacted with 3 and the intermediate product deprotected with TFA to give 4 which has a free β-amino function. This was exploited to add the Boc-G(Trt)HPGGP(Trt)QG-ONHS peptide 6, (itself made by reaction of the bespoke peptide precursor 5 with TSTU and Et3N in DMF), leading after TFA removal of the Boc to compound 7. In the final step, 7 was reacted with the N-hydroxy succinimidyl ester of BHQ-1 to give 8 (OFS-1). 8 was characterized by its UV and fluorescence spectra, HRMS analysis and LC-MS Ctsk fragmentation product analysis. The LC-MS fragmentation product analysis revealed an alternative cleavage site, the Gly-Gln bond. The GHPGGPQG peptide cleavable linker was selected as a racemization-resistant analogue of HPGGPQ. The original peptide had a well-established cleavage site at the Gly-Gly bond. In our product analysis we find that the introduction of terminal glycine residues generates a new preferred cleavage site in the Gly-Gln bond. The OFS probe’s structure, osteoadsorptive and fluorogenic properties were further determined in the experiments described in the following sections.
Scheme 1.

Synthesis of OFS-1, 8.
OFS-1 fluorogenesis induced by Ctsk in solution
The extrinsic fluorescence of 10 μM OFS-1 in water was virtually undetectable during 48 h at 37 °C. However, at 37°C in aqueous 50 mM sodium acetate buffer (pH 5.5) containing 2.5 mM EDTA, 1 mM DTT and 25 nM human Ctsk, fluorescence was generated with an intensity that depended linearly on the OFS-1 concentration up to 1 μM (Supplementary Figure S3).
The kcat and Km for this Ctsk-catalyzed activation were calculated to be 0.17 ± 0.07 s−1 and 1.7 ± 0.7 μM, respectively, giving a catalytic efficiency (kcat/Km) = 0.97 × 10⁵ M-1 s-1 (Figure 2).
Figure 2.

Lineweaver-Burk plot of enzyme kinetics data for activation of OFS-1 in the presence of cathepsin K (2.5 nM). OFS-1 (0 – 2.5 μM in 50 mM NaOAc buffer at pH 5.5. Fluorescence measurements were taken at 1 min intervals using a Biotek Synergy H4 plate reader on solutions in black Corning 3720 96-well plates incubated at 37° (r2 = 0.975).
Abz-HPGGPQ-EDN2Ph (where Abz represents o-aminobenzoic acid and EDN2Ph represents N-(2,4-dinitrophenylethylenediamine)) was reported to have a catalytic efficiency of 4.26 × 10⁵ M−1 s−1, showing that OFS-1 cleaved only fourfold less efficiently than this small peptide substrate of Ctsk.25
Importantly, odanacatib (ODN), a well-known competitive inhibitor of Ctsk26 developed as an investigational treatment for osteoporosis27 and bone metastasis,28 impeded both the initial rate and the final extent of time-dependent Ctsk-activated OFS-1 fluorescence (initial Ctsk concentration, 20 nM) in time-course experiments when added to the assay mixture at a concentration of 10–100 nM (Figure 3A). In the control experiment lacking enzyme, OFS-1 fluorescence remained essentially unchanged throughout the 2 h incubation period (Figure 3A).
Figure 3.

Dependence of OFS-1 fluorescence on Ctsk. A. OFS-1 in solution, pH 7. The time-course evaluation of OFS-1 (0.5 μM) incubated with 20 nM Ctsk revealed that fluorescent activity was immediately observed within 10 min and reached a plateau thereafter. Application of odanacatib (0, 1, 5, 10, 30, 50 and 100 nM; n = 3) decreased the fluorescent intensity with complete suppression at ≥ 30 nM. B. OFS-1 bound to HAp. Ca3(PO4)2 coated well plates were pre-incubated with OFS-1 (0.5 μM) for overnight followed by extensive washes. Ctsk (20 nM) application activated FRET resulting in a time-course increase of fluorescent intensity. Odanacatib (0, 1, 5, 10, 30, 50 and 100 nM; n = 3) decreased the fluorescent intensity, with complete suppression at ≥ 30 nM.
Ctsk-induced fluorogenesis of OFS-1 activation adsorbed on HAp
To ascertain whether Ctsk activation of OFS-1-derived fluorescence also occurred when the probe was pre-adsorbed on solid Ca3(PO4)2 (HAp), the time course experiments were repeated using styrene wells coated with HAp treated overnight with 0.5 μM OFS-1 in 50 mM acetate buffer, pH 5.5, then repeatedly washed with water to remove any unbound probe This protocol was previously established using fluorescent-tagged bisphosphonate ensuring the removal of unadsorbed bisphosphonate.19 The OFS-1-treated HAp plate was then incubated (37 °C) for 2 h with a covering layer of 20 nM Ctsk. Bright Ctsk-dependent fluorescence was again observed, exhibiting a time course similar to that for the solution experiment. (Figure 3B). In the presence of 30 nM odanacatib , no Ctsk-dependent fluorescence was observed (Figure 3B).
To explore extending our approach to fluorophores emitting in the far red region and to gain insight into how the structure of OFS influences its activity, we prepared OFS derivatives in which the BHQ-1/FAM ICQ dye pair was replaced by BHQ-3/Alexafluor® 647 (AF-647): OFS-2, 13, Scheme 2) or by BBQ650/Cy5: OFS-3, 18, Scheme 3).29 To increase the separation between the BP and these larger dyes, the BP was changed from PAM to ALN in OFS-2 and the β-Ala spacer was removed. Cy5 and AF-647, which share a pentamethine cyanine chromophore, have similar fluorescence emission spectra, with maxima at 668 nm. However, AF-647 has better aqueous solubility due to its two additional sulfonate groups and offers a ~18% higher fluorescence quantum yield (0.28 vs 0.33). Both BHQ-3 and BBQ-650 have good spectral overlap with these dyes.29 In contrast to the route employed to synthesize 8, the more expensive fluorescent dyes (Cy5 and AF-647) were added to the scaffold only in the final step and the two quenching dyes (BHQ-3 and BBQ-650) were conjugated in the penultimate step of the synthesis, leading to modifications in the route originally developed for OFS-1. These included reversal of the Boc and Fmoc protection sites in quest of improved yield.
Scheme 2.

Synthesis of OFS-2, 13.
Scheme 3.

Synthesis of OFS-3, 18.
In the Ctsk solution assay, OFS-2 was found to be much less activatable than 8, even with a tenfold higher enzyme concentration. Reliable kcat and Km values could not be obtained. In contrast, OFS-3 was 40x more reactive than OFS-2 when comparing the initial velocities at 2.5 μM concentration (Figure 4).
Figure 4.
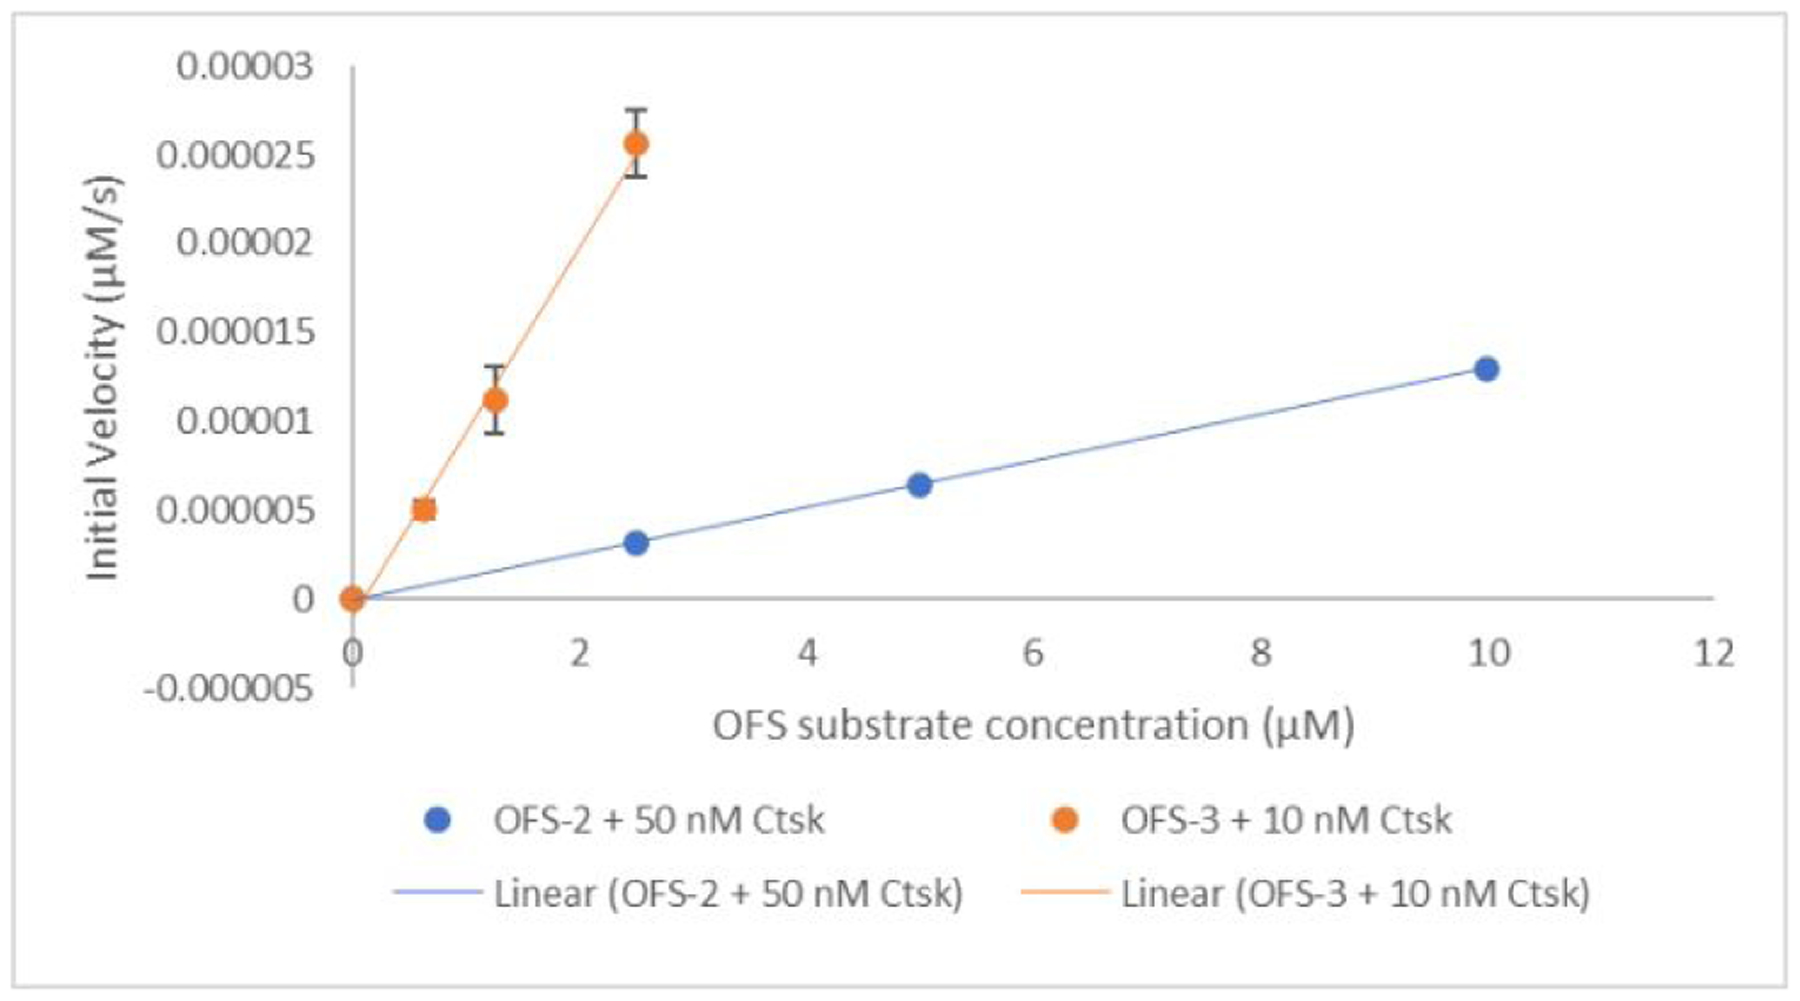
Comparison of initial rates of Ctsk catalyzed cleavage between fluorophore and quencher pair of OFS-2 and OFS-3 in 50 mM NaOAc buffer at pH 5.5. Fluorescence measurements were taken at 1 min intervals using a Biotek Synergy H4 plate reader on solutions in black Corning 3720 96-well plates incubated at 37°C. For the linear data fits, r2 was ≥ 0.99 (OFS-3, data points are triplicate averages).
To gain structural insights into these differences, we first docked a model substrate (Abz-HPGGPQ-EDN2Ph, 31 rotatable bonds) into the active site of human Ctsk (5TDI (ODN-bound hCtsk), 1.4 Å resolution)30 using ICM-Pro14 v. 3.8–6a.31 The computer modeling revealed a preferred pose of the peptide bound to the active site (Figure 5A) with the sulfur atom of C25 (the catalytic nucleophile in peptide substrate cleavage) at a distance of 3.1 Å from the glycine (Gly-Pro-Gln) carbonyl carbon (the site of nucleophilic attack in the substrate).
Figure 5.

A. Preferred pose of Abz-HPGGPQ-EDN2ph bound to hCtsk (5TDI) predicted by ICM Pro (thoroughness 8, score −39. The colors correspond to the calculated electrostatic potential surface as follows: red – negative area, blue – positive area, white – neutral area. The position of cysteine 25 (C25) is shown in yellow. B. A preferred pose of OFS-1 bound to hCtk (5TDI) predicted by the modeling (score −46). C. A preferred pose of OFS-2 bound to hCtk (5TDI) predicted by the modeling (score −42).31
Due to the large size of the OFS-1 molecule, we defined the entire protein as the active site, using a thoroughness parameter of 8. A preferred pose that emerged from repeated calculations with the modeling software is shown in Figure 5B.
In this conformation, the pose of the peptide moiety in the probe is similar to that of Abz-HPGGPQ-EDN2Ph, and shows a C25 sulfur - Gly carbonyl carbon distance of 3.4 Å.
Despite multiple docking attempts, we were unable to obtain a good scoring conformation of OFS-2 that placed the peptide moiety in the active site of the enzyme. In Figure 5C a preferred pose of bound OFS-2 is shown, indicating that the negatively charged sulfonate groups on the dyes are stabilized by positively charged lysines and arginines on the protein, specifically R8 and K9 located opposite to the active site of Ctsk.
Although the results from these modeling studies with the Ctsk-bound OFS probes should be regarded as qualitative due to limitations of the computations, they suggest a possible explanation for the large differences in activation by the enzyme, namely the existence of a cluster of positively charged amino acid residues located opposite to the catalytic active site.24 We posit that strong electrostatic interactions of these clusters with negatively charged groups in the OFS-2 dyes interfere with the optimal alignment of the bound ligand for peptide bond cleavage. Taking into account that all the OFS probes have 2–3 negative charges at pH 5.5, the optimal pH for Ctsk32, the relative OFS activation rates correlate with the number of sulfonate groups: four in OFS-2 (very slow peptide linker cleavage), two in OFS-3 (moderately efficient peptide linker cleavage) and none in OFS-1 (efficient peptide linker cleavage).
A further effect of these sulfonate anions is to decrease lipophilicity, as partly reflected in their calculated log D values relative to that of the reference peptide (Table 1). We did not examine the influence of these charge differences on HAp affinity.
Table 1.
Log D values for OFS series compared to a reference Ctsk substrate.
| Probe | LogD | Number of Sulfonate Anions |
|---|---|---|
| OFS-1 | −5.45 | 0 |
| OFS-2 | −10.49 | 4 |
| OFS-3 | −7.67 | 2 |
| Abz-HPGGPQ-EDN2ph | −3.51 | 0 |
Our results demonstrate that in addition to linker length, dye structure, polarity and charge can play important roles in determining the activation kinetics of these conjugates.
OFS-1 for detection of disease-induced osteolysis by human multiple myeloma cells co-cultured with osteoclasts in vitro and engrafted in humanized mice.
Multiple myeloma is the most frequent primary malignant neoplasm of the skeletal system and develops debilitating or life-limiting skeletal-related events.33 The pathological mechanism of disease-induced bone lesions is still unclear; however, the preferred initial diagnosis and staging of multiple myeloma remains radiological skeletal survey to image the characteristic osteolytic lesions.34 Osteoclasts on the bone surface release hydrogen ions and Ctsk. Ctsk is nearly exclusively secreted by osteoclasts and has an optimal enzymatic activity in acidic conditions for collagenolysis.35 Accordingly, we examined whether OFS-1 would generate a fluorescent signal in response to osteoclast-mediated Ctsk activity as an imaging marker of early stage multiple myeloma-induced osteolysis.
Activation of OFS-1 adsorbed on HAp by resorbing human osteoclasts
Human osteoclasts seeded on the surface of an HAp layer coating a polystyrene well dissolve proximate Ca2PO4 crystals, producing dissolution pits simulating the lacunae that these cells create during bone resorption. This affords a convenient model system for determining whether OFS-1 fluorogenesis occurs during osteoclast-mediated resorption. HAp-coated polystyrene wells were pre-treated with 5.0 μM OFS-1 as described above, washed and then seeded with human osteoclasts. The wells were imaged using both bright field and fluorescent microscopy for 24 h at 37 °C. A time-lapse experiment revealed that Ctsk-dependent osteoclast activation of fluorescence at the pit periphery gradually increased in intensity over several hours (Figure 6A; Supplementary Video 1). Minimal fluorescence was observed in areas where the HAp layer had been dissolved completely. Control wells containing OFS-1 but not seeded with osteoclasts showed smooth coated surfaces which were not significantly fluorescent, but inoculated wells developed typical resorption pits whose peripheries were intensely fluorescent. Remarkably, the osteoclasts themselves were also well defined by internal fluorescence and left luminous trails as they migrated across the HPa surface. When the experiments were repeated in the presence of 30 nM odanacatib, pit formation was again observed, however fluorescence was suppressed (Figure S9). These experiments established that osteoclast-secreted Ctsk was responsible for the observed fluorescent signals; however pit formation in HAp, which is purely Ca2PO4 (corresponding to the mineral component of bone) did not depend on Ctsk secretion by the osteoclasts.36
Figure 6.
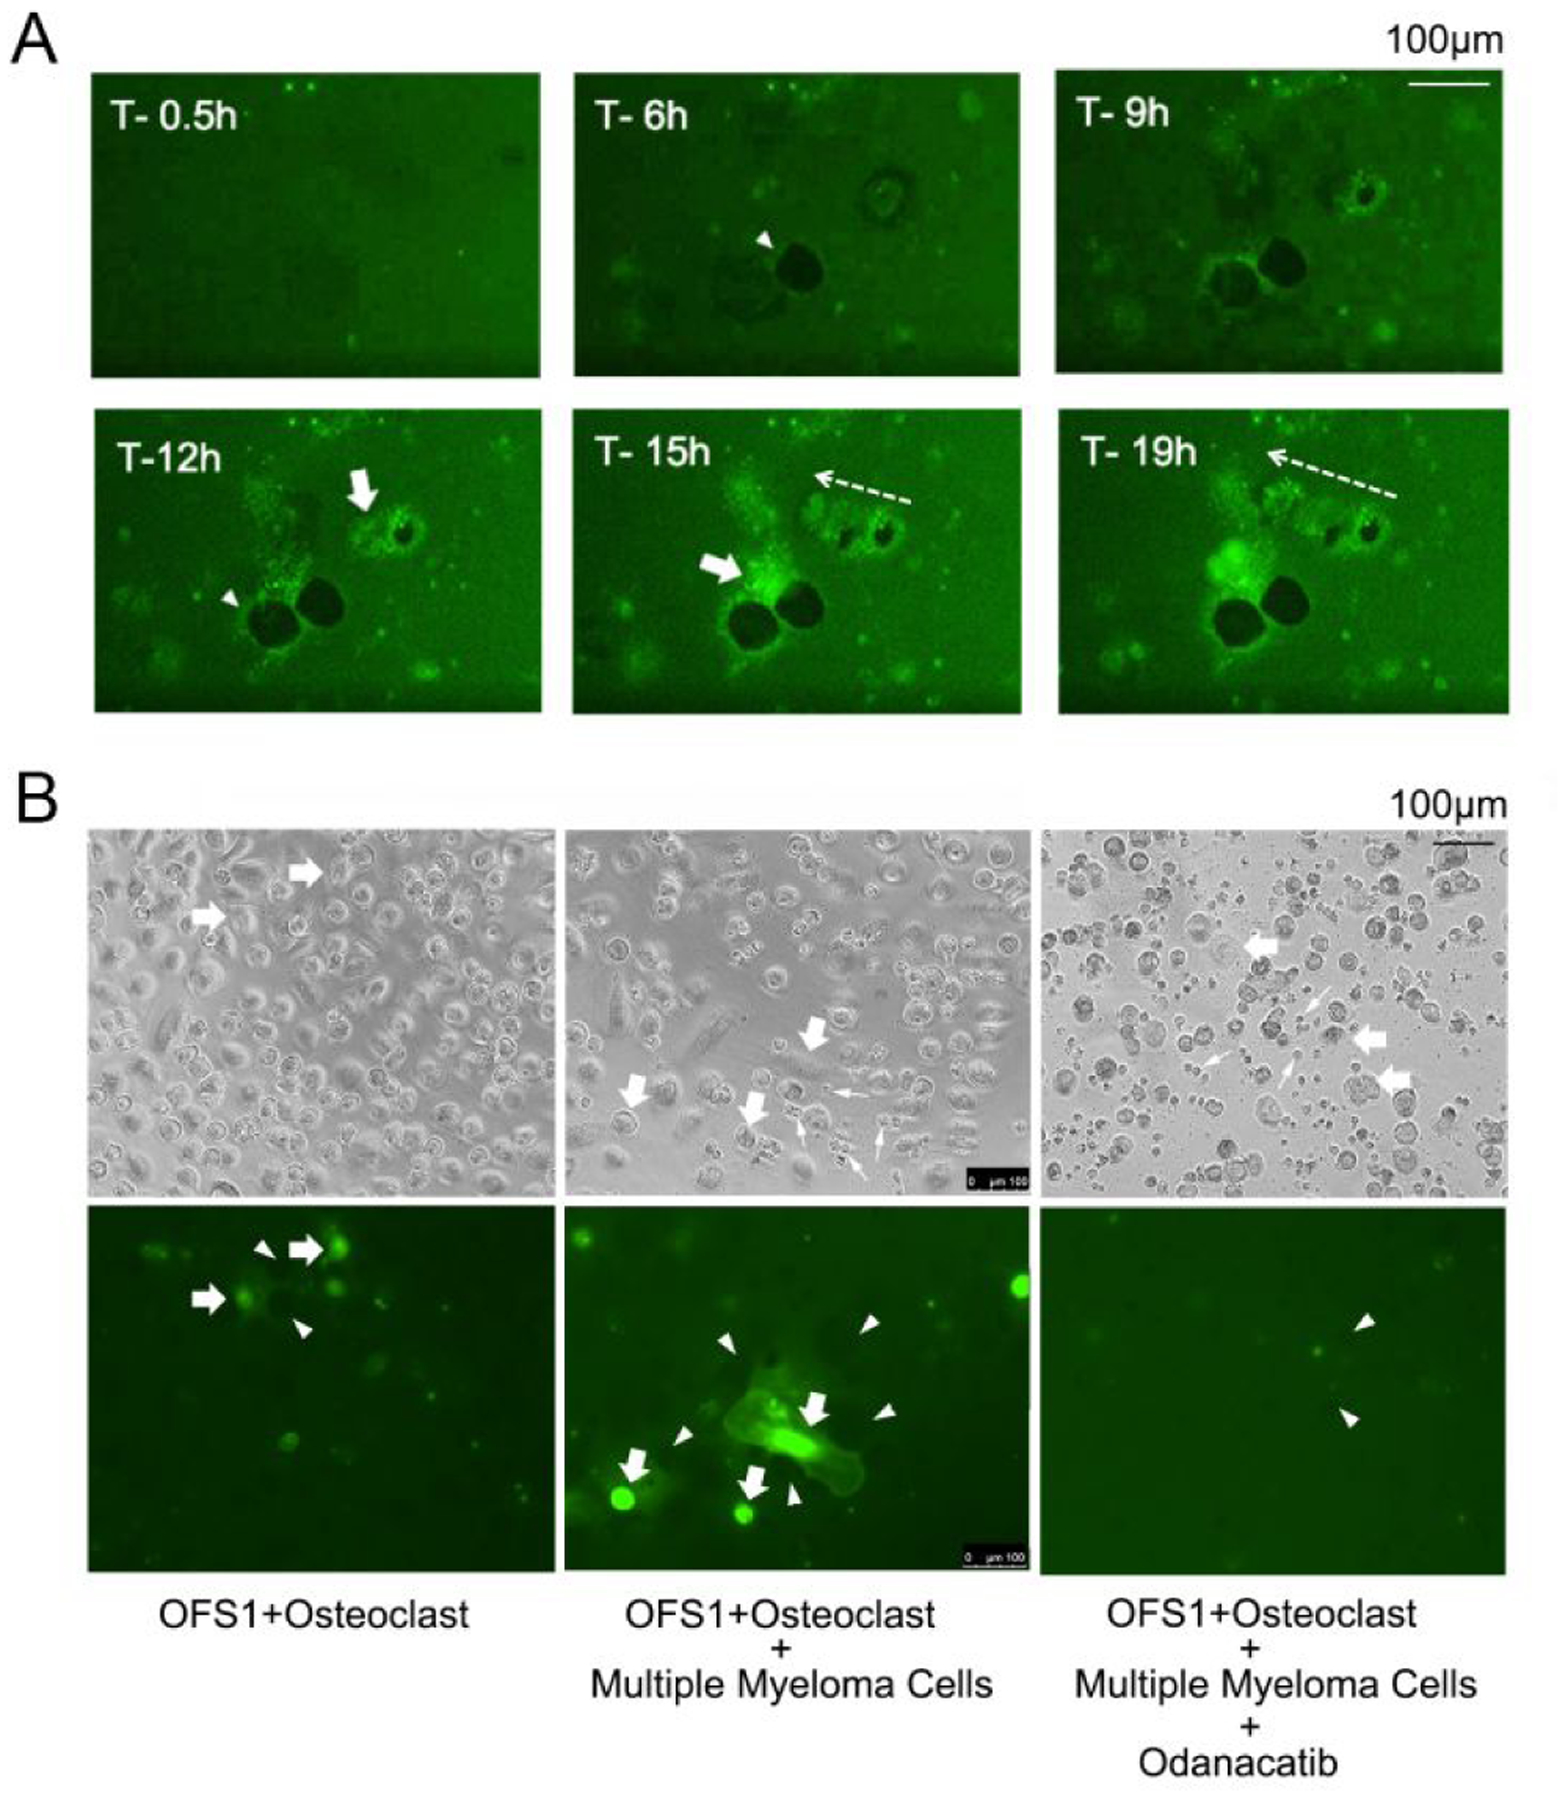
OFS-1-derived fluorescent signals associated with resorbing action of human osteoclasts (culture medium details: Supporting Information) on HAp. A. Ca3(PO4)2-coated well plates were pre-incubated with 8 (5.0 μM), washed with excess PBS solution and seeded with human osteoclasts. Time-lapse photomicroscopy revealed fluorescence generated around the periphery of resorption pits created by the cells (arrowheads). The cytoplasm of the osteoclasts (arrows) also exhibited a fluorescent signal, likely due to internalization of 8 or its FAM activation product fragment. Osteoclast migration left a fluorescent trail (dotted arrow); see Figure S9 for enlarged images and also Supplementary Video 1) B. Left panel: OFS-1-derived fluorescent signals associated with resorbing action of human osteoclasts (arrows) cultured on Ca3(PO4)2-coated wells pre-treated with OFS-1 (5.0 μM). Center panel: the same experiment using osteoclasts co-cultured with RPMI-8226-Luc human multiple myeloma cells (small arrows) (see also Supplementary Video 2). Right: the same experiment as in the center panel, + 30 nM odanacatib (see also Supplementary Video 3).
Activation of OFS-1 co-cultured with RP MI-8226-LUC multiple myeloma cells
Multiple myeloma cells increase osteoclastic bone resorption, an effect that has been demonstrated through indirect methods such as measuring soluble RANKL production.16 We therefore examined osteoclasts seeded on HAp coated well plates pre-treated with OFS-1 in a co-culture environment with human multiple myeloma RPMI-8226-Luc cells. Time-lapse photomicrography of live osteoclasts co-cultured with the RPMI-8226 cells demonstrated robust activation of OFS-1 fluorescent signals on the Hap well plate surface around the resorption pits and migrating osteoclasts (Figure 6B). Compared to solitary osteoclasts in culture, the OFS-1 fluorescent signal was increased by RPMI-8226-Luc cells and was effectively inhibited by odanacatib (30 nM), which confirmed that the OFS-1 signal activation was dependent on Ctsk (Figure 6B).
OFS-1 activation in multiple myeloma engrafted humanized mice
These in vitro results encouraged us to explore OFS-1 activation in vivo. We selected a murine model for disease-induced osteolysis in multiple myeloma using NSG immunodeficient mice co-grafted with human CD34+ hematopoietic stem cells, liver and thymus which were irradiated to effect complete humanization of their immune regulatory and effector cells (NSG/BLT mice).37–38 The osteoclast cells in the mice are also humanized in this model. To evaluate the potential of OFS-1 for imaging of abnormal Ctsk levels associated with engrafted multiple myeloma sites in the NSG-BLT model, RPMI-8226-Luc human multiple myeloma cells (15×106 cells per mouse) were administered by tail IV injection (100 μL) (Figure 7A). RPMI-8226-Luc human multiple myeloma cells were successfully engrafted at the left femur and pelvis or lower lumber bone of test animals, as demonstrated by intense bioluminescence from these sites post injection (Figure 7B). The pattern of RPMI-8226-Luc human multiple myeloma cell engraftment in NSG-BLT mice was highly consistent with the well-established model using NOG immunodeficient mice.39–40
Figure 7.

OFS-1 for in vivo live imaging of multiple myeloma-induced aberrant osteolysis. A. Experimental plan. After NSG/BLT humanized mice were established, human RPMI-8226-Luc multiple myeloma cells were injected via the tail vein. One week later, OFS-1 was injected via retro-orbital venous plexus. Mice were then imaged using an IVIS Lumina II in vivo imaging system and micro-CT. B. The bioluminescence in vivo images (bottom) and 3D reconstructed ex vivo micro-CT images (top) of representative mice after 4 weeks of injection of RPMI-8226-Luc cells or vehicle solution (Cont.) As a reference, RPMI-8226-Luc cells were injected into immunodeficient NOG mice (right). Human multiple myeloma cells were engrafted in both NSG/BLT and NOG mice. (Cont. n = 1, MM-induced mice n = 2). C. In vivo bioluminescence and fluorescent images of representative mice 3, 4, and 5 weeks after the RPMI-8226-Luc cell injection. OFS-1 fluorescent in vivo imaging revealed a localized signal superimposed on the RPMI-8226-Luc bioluminescent signal at the cervical/thoracic bone (arrow). (Cont. n = 1, MM-induced mice n = 3). D. In vivo bioluminescence and fluorescent images were superimposed at the cervical lumber bone. Post-mortem micro-CT images of cervical region revealed extensive osteolysis lesions (arrows), which corresponded to the sentinel OFS-1 signal. (Cont. n = 1, MM-induced mice n = 3). E. In vivo live imaging (left) of an RPMI-8226-Luc cells-engrafted NSG/BLT mouse identified the strong OFS-1 fluorescent signal in femurs and tibias. Post-mortem micro-CT imaging (right) revealed decreased trabecular bone structure in the RPMI-8226-Luc cell-sengrafted NSG/BLT mouse as compared to a control mouse. (Cont. n = 1, MM-induced mice n = 3).
After 7 days, 100 μL of 50 μM OFS-1 were injected retro-orbitally and the animals were examined by in vivo fluorescence imaging at 3, 4, and 5 wk after RPMI-8226-Luc multiple myeloma cell injection (Figure 7C). It has been reported that the human multiple myeloma cells (RPMI-8226-Luc) requires several weeks for the orthotropic grafting after injection in mice.39 There was a bioluminescent signal near the tail vein injection site until 4 wk suggesting the remaining of RPMI-8226-Luc cells. However, this bioluminescent signal near the tail vein injection site disappeared at 5 wk, while a new bioluminescent signal was detected at the cervical/thoracic bone (arrow in Figure 7C). Fluorescent in vivo imaging revealed a localized signal superimposed on the bioluminescent signal at the cervical/thoracic bone (arrow), suggesting osteoclastic activity induced by orthotopic-engrafted RPMI-8226-Luc cells. Strikingly, the distinct fluorescent signal was detected from 4 wk. The cervical RPMI-8226-Luc bioluminescent signal was not detected at 4 wk, likely because the remaining tail vein signal masked other weaker signals. Because the control animals with physiological level of bone resorption did not show the OFS-1 signal, the activated OFS-1 fluorescent signal indicated to sensitively identify the early orthotopic engraftment of RPMI-8226-Luc multiple myeloma cells.
Post-mortem micro-CT images of cervical region of another mouse with the superimposed signals of RPMI-8226-Luc and OFS-1 in the cervical area revealed extensive osteolysis lesions (Figure 7D). Importantly, a strong fluorescent signal was detected at (and extending beyond) the bioluminescent tumor site, suggesting that not only was OFS-1 significantly activated at this site, but also was reporting from the immediately surrounding area where cells may have spread but not yet in sufficient density to produce detectable bioluminescence.
Another NSG/BLT mouse with RPMI-8226-Luc bioluminescent signal over a large area of its lower back demonstrated localized OFS-1 fluorescent signal in femurs and tibia. Post-mortem microCT analysis revealed decreased trabecular bone structure of both tibia and femur bones as compared to a control mouse. While RPMI-8226-Luc bioluminescent signal from the large lower back area might have included remnant cells in skin connective tissue at the injection site, the sentinel OFS-1 signal accurately identified the bone engrafting site of RPMI-8226-Luc cells.
Summary and Conclusions
OFS-1 is avidly adsorbed by hydroxyapatite (HAp) and bone mineral surfaces, where it emits an external fluorescent signal in the presence of osteoclast-secreted Ctsk. The catalytic role of Ctsk in signal generation is supported by the observation that ODN, a specific inhibitor of Ctsk, strongly suppressed the fluorescence. Key structural features contributing to the effectiveness of OFS-1 were revealed by SAR and modeling studies comparing OFS-1 with two cognates, OFS-2 and OFS-3.
OFS-1 was demonstrated to signal multiple myeloma-induced aberrant osteoclastogenesis in NSG/BLT humanized mice injected with human RPMI-8226-Luc cells OFS before the co-localized luminescence of the myeloma cells could be detected. Bone metastases typically feature modulation of osteoclast and/or osteoblast activity by nascent tumor cells. OFS probes could thus be of particular value in the early detection, accurate diagnosis and therapy assessment of cancer-induced resorptive bone disease, which is a major source of morbidity and mortality in cancer patients. OFS probes also constitute unique imaging tools to study the underlying mechanisms of osteoclast-mediated bone resorption.
Experimental Section
General.
Nα-Fmoc-Nε-Boc-(L)-lysine, Nα-Boc-Nε-Fmoc-(L)-lysine and dicyclohexycarbodiimide (DCC) were purchased from Sigma Aldrich. N-hydroxysulfosuccinimide sodium salt and N-Boc-(L)-alanine succinimidyl ester were purchased from Chem-Impex International, Inc. Pamidronic acid was a kind gift from Novartis International AG. Trifluoroacetic acid (TFA) and N,N,N,N-tetramethyl-O-(N-succinimidyl)uronium tetrafluoroborate (TSTU) were purchased from Oakwood Chemical. 5-Carboxyfluorescein succinimidyl ester and 5(6)-carboxyfluorescein succinimidyl ester were purchased from ChemShuttle and Sigma Aldrich, respectively. Sulfo-Cy5 succinimidyl ester was purchased from Lumiprobe. Alexafluor® 647 (AF-647) was purchased from Thermo Fisher Scientifica. Anhydrous N,N-dimethylformamide (DMF), tetrahydrofuran (THF), acetonitrile, ethyl acetate, methanol and triethylamine (TEA) were purchased from EMD Millipore Corporation or VWR. Sodium carbonate and sodium bicarbonate were purchased from Fisher Scientific. The custom synthesized peptide Boc-GH(Trt)PGGPQ(Trt)G was purchased from Chi Scientific or Applied Biological Materials Inc. Black Hole Quencher-1 (BHQ-1) succinimidyl ester and Black Hole Quencher-3 (BHQ-3) succinimidyl ester were purchased from Biosearch Technologies. BlackBerry Quencher 650 (BBQ-650) succinimidyl ester was purchased from Berry & Associates, Inc. TEA was distilled from NaOH, other solvents and reagents were used as received. 1H and 31P NMR spectra were obtained on Varian 400-MR, VNMRS-500, or VNMRS-600 spectrometers. 31P NMR spectra were proton-decoupled unless stated otherwise. Multiplicities are quoted as singlet (s), doublet (d), triplet (t), unresolved multiplet (m), doublet of doublets (dd), doublet of doublet of doublets (ddd), doublet of triplets (dt), broad singlet signal (sbr) or broad signal (br). All chemical shifts (δ) are reported in parts per million (ppm) relative to residual CDH2OH in CD3OD (δ 3.34, 1H NMR), CHCl3 in CDCl3 (δ 7.26, 1H NMR), HDO in D2O (δ 4.80, 1H NMR) or external 85% H3PO4 (δ 0.00, 31P NMR). pH measurements were calibrated using three different pH reference buffers (4, 7, and 10). NMR spectra were processed with MestReNova 9.0.0 or 11.0.2. Preparative HPLC was performed using a Shimadzu LC-20AD solvent delivery system with an SPD-M20A PDA detector. Mass spectrometry were performed on a Finnigan LCQ Deca XP Max equipped with an ESI source (negative or positive ion mode) and a photodiode detection array (PDA) detector. High Resolution mass spectra were obtained at the University of Illinois Urbana Mass Spectrometry Laboratory on a fee for service basis. Mass spectral data were calculated using ChemDraw 19.1.21 or iMass 1.3 (Apple Mac). Compound IUPAC names were assigned by MarvinSketch 20.4.
Synthesis.
3-(Nα-Fmoc-Nε-Boc-(L)-lysineamido)-1-hydroxypropane-1,1-diyl)bis(phosphonic acid), (2).
To Nα-Fmoc-Nε-Boc-(L)-lysine, 1, (117 mg, 0.25 mmol) in anhydrous DMF (625 μL) was added N-hydroxysulfosuccinimide sodium salt (65.1 mg, 0.3 mmol, 1.2 equiv) and the mixture was sonicated to give a white suspension. DCC (51.6 mg, 0.25 mmol, 1 equiv) was added and the mixture was stirred for 2 h at rt while monitored by TLC (silica, 100% ethyl acetate, visualized with UV 254 nm; starting material, Rf value of 0.2–0.5 product, Rf value of 0) and by MS: (ESI−): calcd for C30H34N3O11S [M-H]−: 644.20, found 644.39 m/z . The reaction mixture was centrifuged, and the isolated supernatant was added slowly dropwise to a rapidly stirred suspension of pamidronic acid (176.3 mg, 0.75 mmol, 3 equiv) in water (2.5 mL) adjusted with sodium bicarbonate to pH 7.6. After 8 min, addition was complete and stirring was continued while the reaction was monitored by LC-MS (Hamilton PRP-C18 column 4.6 × 150 mm, 5μm; buffer system: aqueous 50 mM ammonium acetate, pH 7.5, A: 8.5% acetonitrile, B: 70% acetonitrile; gradient: 1 ml / min; 0 – 4 min. 0% B; 4 – 20 min. 0 to 100% B). After 17 min, integration of the product peak at 260 nm indicated 60% conversion to BOC-protected 2. The product was purified by HPLC (Hamilton PRP-1 column 21.2 × 250 mm, 7 μm; buffer system: aqueous 50 mM triethylammonium bicarbonate, pH 7.5, A: 8.5% acetonitrile, B: 70% acetonitrile; gradient: 8 ml / min; 0 – 4 min. 0% B; 4 – 20 min. 0 to 100% B) and concentrated in vacuo. 1H NMR (400 MHz, D2O) δ 7.87 (dd, J = 6.4 Hz, 2H), 7.68 (dd, J = 18.3, 7.5 Hz, 2H), 7.54 – 7.38 (m, 4H), 4.55 – 4.48 (m, 3H), 4.26 (t, J = 4.9 Hz, 1H), 3.85 (dd, J = 9.4, 4.1 Hz, 1H), 3.55 – 3.42 (m, 1H), 3.34 (d, J = 8.8 Hz, 2H), 3.08 – 2.77 (m, 1H), 2.11 (dd, J = 9.0, 6.3 Hz, 2H), 1.62 – 1.42 (m, 2H), 1.40 (s, 9H). 31P NMR (162 MHz, D2O) δ 17.75. MS (ESI−) calcd for C30H35N3O11S [M-H]: 644.2, found 644.4.
A mixture of trifluoroacetic acid (TFA), water and triisopropylsilane (TIS) (95:2.5:2.5) was added to the residue and the mixture stirred for 90 min at rt with monitoring by MS (ESI−) at 584 m/z. The deprotected product 2 was concentrated in vacuo, co-evaporated thrice with a small portion of water and then used in the next reaction without further purification. 1H NMR (400 MHz, D2O) δ 7.84 – 7.66 (m, 2H), 7.66 – 7.43 (m, 2H), 7.43 – 7.14 (m, 4H), 4.71 – 4.46 (m, 3H), 4.45 – 4.26 (m, 1H), 4.13 (s, 1H), 3.90 – 3.67 (m, 1H), 3.47 – 3.11 (m, 2H), 2.81 (t, J = 7.7 Hz, 2H), 2.11 – 1.78 (m, 2H), 1.63 – 1.30 (m, 2H), 1.19 – 0.85 (m, 2H). 31P NMR (162 MHz, D2O) δ 17.81. MS calcd for C24H32N3O10P2 [M-H]- 584.2, found: 584.3 m/z.
(S)-5-((5-amino-6-((3-hydroxy-3,3-diphosphonopropyl)amino)-6-oxohexyl)carbamoyl)-2-(6-hydroxy-3-oxo-3H-xanthen-9-yl)benzoic acid, (3). Compound 2 (340 mg, 0.581 mmol) was suspended in water (5.1 mL) and THF (3.85 mL). Sodium bicarbonate was used to adjust the pH to 7.3 and 5-carboxyfluorescein succinimidyl ester (300 mg, 0.634 mmol, 1.1 eq) in THF (10.2 mL) was added, giving an orange solution which was stirred at rt overnight. Solvents were removed under reduced pressure and the residue was suspended in DMF (27.2 mL), then treated with piperidine (6.80 mL). The resulting solution was stirred at rt overnight. Solvents were removed under reduced pressure, the residue was dissolved in water (680 mL) and acetic acid (1.60 mL) was added. The aqueous layer was extracted with ethyl acetate (680 mL × 3) and then evaporated under reduced pressure to give the crude product 3 (0.201 mmol, 34% yield (determined by UV absorbance at 493 nm (PBS buffer, ε = 73,000). 1H NMR (400 MHz, D2O) δ 8.03 (s, 1H), 7.79 (d, J = 7.7 Hz, 1H), 7.21 (d, J = 8.2 Hz, 1H), 7.00 (d, J = 9.5 Hz, 2H), 6.50 (d, J = 7.9 Hz, 4H), 3.78 (t, J = 6.5 Hz, 1H), 3.50 (dt, J = 13.1, 6.4 Hz, 1H), 3.42 – 3.27 (m, 3H), 2.03 (tt, J = 13.4, 7.9 Hz, 2H), 1.89 – 1.79 (m, 2H), 1.59 (p, J = 7.5 Hz, 2H), 1.38 (p, J = 7.6, 7.1 Hz, 2H). 31P NMR (162 MHz, D2O) δ 17.83. MS calcd for C30H32N3O14P2 [M-H]− 720.1, found: 720.2 m/z. If the less expensive mixture of 5- and 6-carboxyfluorescein succininidyl esters was used, it proved possible to separate the corresponding product isomers 3 and 3b, respectively. Thus, 2 (10 mg, 17.1 μmol) was suspended in water (0.45 mL), saturated sodium bicarbonate (0.06 mL) and THF (0.34 mL). 5(6)-Carboxyfluorescein succinimidyl esters (12.1 mg, 25.6 μmol) dissolved in 0.90 ml of THF were added, the mixture was stirred overnight and the solvent was removed under reduced pressure. The crude material was suspended in DMF (0.8 mL) and treated with piperidine (0.2 mL) then stirred for 2 h at rt. Evaporation at reduced pressure left a residue which was taken up in 2 ml of water, giving an orange suspension. The pH was adjusted to 7.5 with triethylamine to dissolve solids and the solution was subjected to HPLC (10 × 250 mm Phenomenix Luna C18 column) using 0.1 M triethylammonium bicarbonate buffers containing 10% and 70% methanol (A and B respectively), gradient: 0–1 min, 100% A; 1–3 min, 0–20% B; 3–6 min, 20% B; 6–14 min, 20–100% B. Peak retention times for the two isomers were 8.7 and 12 min, respectively. After solvent evaporation under reduced pressure, the product yields were determined by absorbance at 493 nm (PBS Buffer, pH 7.4, ε = 73,000): 5-FAM isomer 3: 4.96 μmol, 6-FAM isomer 3b: 1.95 μmol (40% combined yield). MS calcd for C30H32N3O14P2 [M-H]− 720.1, found: 720.4 (3), 720.3 (3a) m/z.
(S)-4-((5-(3-aminopropanamido)-6-((3-hydroxy-3,3-diphosphonopropyl)amino)-6-oxohexyl)carbamoyl)-2-(6-hydroxy-3-oxo-3H-xanthen-9-yl)benzoic acid, (4). To a solution of compound 3 (40.0 μmol) in THF (274 μL), water (113 μL) and saturated sodium bicarbonate solution (74 μL) was added N-Boc-β-alanine succinimidyl ester (0.3 M in THF, 267 μL, 80 μmol, 2 equiv). The reaction mixture was stirred at rt overnight. Solvents were removed under reduced pressure and the residue was dissolved in 0.1 M TEAB buffer containing 5% acetonitrile (pH = 8.5, 400 μL). The crude product was purified by reverse-phase HPLC (Hamilton® PRP-1 column, 21.2 × 250 mm, 7 μm) using 0.1 M TEAB buffers containing 5% and 70% acetonitrile (pH = 8.5, A and B, respectively), gradient 0–2 min, 20% B; 2–20 min, 20–60% B; 20–22 min, 60–100% B; flow rate, 6 mL/min. Fractions for the peak eluting at 15 min were pooled and concentrated under reduced pressure to give the Boc-protected 4 intermediate: MS calcd for C38H45N4O17P2 [M-H]− 891.2, found: 891.3. To this intermediate was added water (50 μL) and TFA (950 μL) and the resulting yellow solution was stirred at rt overnight. After removal of the solvents under reduced pressure, the residue was purified by reverse-phase HPLC (Hamilton® PRP-1 column, 21.2 × 250 mm, 7 μm) using 0.1 M TEAB buffers, A and B, gradient 0–2 min, 20% B; 2–20 min, 20–60% B; 20–22 min, 60–100% B; flow rate, 6 mL/min. Fractions for the peak eluting at about 9 min were pooled and concentrated under reduced pressure to give 4 (10.6 μmol, 27% by UV absorbance at 493 nm in PBS buffer. 1H NMR (400 MHz, D2O, pH 6.3) δ 8.06 (d, J = 1.8 Hz, 1H), 7.80 (d, J = 7.7 Hz, 1H), 7.25 (d, J = 7.9 Hz, 1H), 7.07 (d, J = 9.8 Hz, 2H), 6.65 – 6.51 (m, 4H), 4.13 (dd, J = 9.5, 4.7 Hz, 1H), 3.42 (t, J = 7.2 Hz, 2H), 3.33 (t, J = 6.8 Hz, 2H), 3.15 (dt, J = 13.9, 6.8 Hz, 2H), 2.64 (dt, J = 11.9, 6.6 Hz, 2H), 2.11 – 1.93 (m, 2H), 1.85 – 1.71 (m, 1H), 1.69 – 1.47 (m, 3H), 1.47 – 1.33 (m, 2H).31P NMR (243 MHz, D2O) δ 17.60. MS calcd for C33H38N4O15P2 [M-H]− 791.2, found: 791.0 m/z.
Activation of Boc-GH(Trt)PGGPQ(Trt)G-OSu, (6).
Boc-GH(Trt)PGGPQ(Trt)G-OH, 5, (68.4 mg, 53 μmol) was treated with a solution of triethylamine in anhydrous DMF (0.25 M, 636 μL, 159 μmol, 3 equiv) followed by N,N,N,N-tetramethyl-O-(N-succinimidyl)uronium tetrafluoroborate (TSTU) in anhydrous DMF (0.25 M, 233 μL, 58.3 μmol, 1.1 equiv). The reaction mixture was shaken vigorously and then left at rt for 30 min. Solvents were removed under reduced pressure and the residue, 6, was used immediately in the following step without purification. MS calcd for C76H83N12O14 [M+H]+ 1387.6, found: 1387.1 m/z.
5-{[(5S)-5-[3-(2-{2-[(1-{2-[2-({1-[2-(2-aminoacetamido) −3-(1H-imidazol-4-yl)propanoyl]pyrrolidin-2-yl}formamido)acetamido]acetyl}pyrrolidin-2-yl)formamido]-4-carbamoylbutanamido}acetamido)propanamido]-5-{[3-hydroxy-3,3-bis(hydroxyphospho)-propyl]-carbamoyl}pentyl]carbamoyl}−2-(6-hydroxy-3-oxo-3H-xan then-9-yl)benzoic acid, (7). To a solution of 4 (10.6 μmol) in water (108 μL), saturated sodium bicarbonate solution (27 μL), and THF (108 μL) was added activated peptide 6 (53 μmol, 5 eq) in THF (216 μL). The reaction mixture was shaken vigorously overnight. After removal of solvents at reduced pressure, the residue was dissolved in buffer B (2 mL) and purified by HPLC (Hamilton® PRP-1 column, 21.2 × 250 mm, 7 μm) using the 0.1 M TEAB buffers A and B, gradient 0–2 min, 50% A, 2–15 min, 50–100% B, 15–22 min, 100% B, flow rate, 6 mL/min. The product had a retention time of 16 min. The product fractions were pooled and concentrated to give the Boc- and Trtprotected intermediate. MS (ESI−) calcd for C105H113N15O26P2 [M-2H]2- 1030.9, found: 1031.2 m/z.
The intermediate was treated with a mixture of TFA, water and triisopropylsilane (TIS) (95:2.5:2.5, 400 μL). The reaction mixture was shaken at rt overnight. After removal of solvents at reduced pressure, the residue was dissolved in 0.1 M TEAB buffer B (500 μL), and purified by reverse-phase HPLC (Hamilton® PRP-1 column, 21.2 × 250 mm, 7 μm) using the 0.1 M TEAB buffers A and B, gradient 0–2 min, 20% B; 2–20 min, 20–60% B; 20–22 min, 100% B; flow rate, 6 mL/min. The product had a retention time of 8.5 min. The product fractions were pooled and concentrated to give 7 (4.00 μmol, 38%, determined by UV absorbance (fluorescein, 493 nm) in PBS buffer, pH 7.4, ε = 73,000. MS calcd for C62H77N15O24P2 [M-H]− 1478.5, found 1478.5 m/z.
OFS-1:
5-{[(5S)-5-[3-(2-{4-carbamoyl-2-[(1-{2-[2-({1-[3-(1H-imid azol-4-yl)-2-[2-(4-{[4-(2-{2-methoxy-5-methyl-4-[2-(2-nitrophenyl)diazen-1-yl]phenyl}diazen-1-yl)phenyl](methyl) amino}butanamido)acetamido]propanoyl]pyrrolidin-2-yl}f ormamido)acetamido]acetyl}pyrolidin-2-yl)formamido]butanamido}acetamido)propanamido]-5{[3-hydroxy-3,3-bis(hydroxyphospho)propyl]carbamoyl}-pentyl]carbamoyl}−2-(6-hydroxy-3-oxo-3H-xanthen-9-yl)-benzoic acid, (8). To 7 (1.00 μmol) in saturated sodium bicarbonate solution (24 μL) was added solid sodium bicarbonate until no more solid was dissolved. The succinimidyl ester of BHQ-1 (3.78 μmol, 3.8 equiv) as a 0.042 M solution in THF/DMF (2:1, 90 μL) was added and the mixture was shaken vigorously at rt overnight. After removal of solvents at reduced pressure the residue was dissolved in 500 μL of 50 mM ammonium acetate buffer containing 5% acetonitrile and purified by reverse-phase HPLC (Hamilton® PRP-1 column, 10 × 250 mm, 7 μm) using 50 mM ammonium acetate buffers containing 5% and 70% acetonitrile (pH = 7.4, A and B, respectively), gradient 0–3 min, 10% B; 3–13 min, 10–100% B; 13–32 min, 100% B. The product had a retention time of 14.5 min. The product fractions were combined and evaporated to give 8 (0.325 μmol, 33%), determined by UV absorbance in PBS Buffer, pH 7.4, ε = 34,660 at 534 nm (estimated by addition of BHQ-1 and carboxyfluorescein extinction coefficients). HRMS calcd for C88H103N21O28P2 [M-2H]2− 981.8384, found: 981.8386 m/z.
Cell Line:
Human myeloma cell line RPMI-8226 was previously modified to express firefly luciferase.41
Supplementary Material
ACKNOWLEDGMENT
Human multiple myeloma RPMI-8226-Luc cells were kindly provided by Dr. Patrick Frost, Greater Los Angeles Veteran Administration Healthcare System. We thank Ms. Inah Kang for her invaluable assistance in the preparation of this manuscript.
Funding Sources
This research was supported in part by NIH grants R21DE023410, R01DE022552 and C06RR014529. ETR was an NIH postdoctoral trainee (T90DE02198) and OS was a USC Dornsife Graduate Fellow.
ABBREVIATIONS
- HAp
Hydroxyapatite
- Ctsk
Cathepsin K
- FRET
Förster resonance energy transfer
- IQF
Internally quenched fluorescence
- SAR
Structure-activity relationship
- OFS
Osteoadsorptive Fluorogenic Sentinel
- BP
bisphosphonate
- ZOL
zoledronate
- RIS
risedronate
- BHQ-1
Black-hole quencher 1
- FAM
fluorescein
- ALA
alendronate
- PAM
pamidronate
- ODN
odanacatib
Footnotes
Publisher's Disclaimer: This document is confidential and is proprietary to the American Chemical Society and its authors. Do not copy or disclose without written permission. If you have received this item in error, notify the sender and delete all copies.
Supporting Information
Detailed methods for synthesis of OFS-2 and OFS-3 with NMR and MS data; HRMS spectrum of OFS-1; details of kinetics experiments; LC-MS analysis of Ctsk reaction products with 8; in vitro and vivo activation data; and time-lapse videos of osteoclast-mediated HAp-adsorbed activation of 8 fluorescence. The Supporting Information is available free of charge at htps://pubs.acs.org/doi/xyz.
REFERENCES
- 1.Divieti Pajevic P, and Krause DS (2019) Osteocyte regulation of bone and blood. Bone. 119, 13–18. [DOI] [PMC free article] [PubMed] [Google Scholar]
- 2.Novinec M, and Lenarcic B (2013) Cathepsin K: a unique collagenolytic cysteine peptidase. Biol Chem. 394, 1163–1179. [DOI] [PubMed] [Google Scholar]
- 3.Terpos E, Ntanasis-Stathopoulos I, Gavriatopoulou M, and Dimopoulos MA (2018) Pathogenesis of bone disease in multiple myeloma: from bench to bedside. Blood Cancer J. 8, 7. [DOI] [PMC free article] [PubMed] [Google Scholar]
- 4.Bhushan KR, Misra P, Liu F, Mathur S, Lenkinski RE, and Frangioni JV (2008) Detection of breast cancer microcalcifications using a dual-modality SPECT/NIR fluorescent probe. J Am Chem Soc. 130, 17648–17649. [DOI] [PMC free article] [PubMed] [Google Scholar]
- 5.Bhushan KR, Tanaka E, and Frangioni JV (2007) Synthesis of conjugatable bisphosphonates for molecular imaging of large animals. Angew Chem Int Ed Engl. 46, 7969–7971. [DOI] [PMC free article] [PubMed] [Google Scholar]
- 6.Hyun H, Wada H, Bao K, Gravier J, Yadav Y, Laramie M, Henary M, Frangioni JV, and Choi HS (2014) Phosphonated near-infrared fluorophores for biomedical imaging of bone. Angew Chem Int Ed Engl. 53, 10668–10672. [DOI] [PMC free article] [PubMed] [Google Scholar]
- 7.Fernandez A, Thompson EJ, Pollard JW, Kitamura T, and Vendrell M (2019) A Fluorescent Activatable AND-Gate Chemokine CCL2 Enables In Vivo Detection of Metastasis-Associated Macrophages. Angew Chem Int Ed Engl. 58, 16894–16898. [DOI] [PMC free article] [PubMed] [Google Scholar]
- 8.Widen JC, Tholen M, Yim JJ, Antaris A, Casey KM, Rogalla S, Klaassen A, Sorger J, and Bogyo M (2020) AND-gate contrast agents for enhanced fluorescence-guided surgery. Nat Biomed Eng. [DOI] [PMC free article] [PubMed] [Google Scholar]
- 9.Hashimoto R, Minoshima M, Kikuta J, Yari S, Bull SD, Ishii M, and Kikuchi K (2020) An Acid-Activatable Fluorescence Probe for Imaging Osteocytic Bone Resorption Activity in Deep Bone Cavities. Angew Chem Int Ed Engl. 59, 20996–21000. [DOI] [PMC free article] [PubMed] [Google Scholar]
- 10.McKenna CE, Haratipour P, Duro MVV, and Ebetino FH, Chemistry of Bisphosphonates. In Encyclopedia of Bone Biology, Zaidi M, Ed. Elsevier: 2020; pp 551–564. [Google Scholar]
- 11.Ebetino FH, Hogan AM, Sun S, Tsoumpra MK, Duan X, Triffitt JT, Kwaasi AA, Dunford JE, Barnett BL, Oppermann U, et al. (2011) The relationship between the chemistry and biological activity of the bisphosphonates. Bone. 49, 20–33. [DOI] [PubMed] [Google Scholar]
- 12.Cole LE, Vargo-Gogola T, and Roeder RK (2016) Targeted delivery to bone and mineral deposits using bisphosphonate ligands. Adv Drug Deliv Rev. 99, 12–27. [DOI] [PubMed] [Google Scholar]
- 13.Kashemirov BA, Bala JL, Chen X, Ebetino FH, Xia Z, Russell RG, Coxon FP, Roelofs AJ, Rogers MJ, and McKenna CE (2008) Fluorescently labeled risedronate and related analogues: “magic linker” synthesis. Bioconjug Chem. 19, 2308–2310. [DOI] [PubMed] [Google Scholar]
- 14.Sun S, Blazewska KM, Kadina AP, Kashemirov BA, Duan X, Triffitt JT, Dunford JE, Russell RG, Ebetino FH, Roelofs AJ, et al. (2016) Fluorescent Bisphosphonate and Carboxyphosphonate Probes: A Versatile Imaging Toolkit for Applications in Bone Biology and Biomedicine. Bioconjug Chem. 27, 329–340. [DOI] [PMC free article] [PubMed] [Google Scholar]
- 15.Sun S, Blazewska KM, Kashemirov BA, Roelofs AJ, Coxon FP, Rogers MJ, Ebetino FH, McKenna MJ, and McKenna CE (2011) Synthesis and characterization of novel fluorescent nitrogen-containing bisphosphonate imaging probes for bone active drugs. Phosphorus Sulfur Silicon Relat Elem. 186, 970–971. [DOI] [PMC free article] [PubMed] [Google Scholar]
- 16.Junankar S, Shay G, Jurczyluk J, Ali N, Down J, Pocock N, Parker A, Nguyen A, Sun S, Kashemirov B, et al. (2015) Real-time intravital imaging establishes tumor-associated macrophages as the extraskeletal target of bisphosphonate action in cancer. Cancer Discov. 5, 35–42. [DOI] [PMC free article] [PubMed] [Google Scholar]
- 17.Roelofs AJ, Coxon FP, Ebetino FH, Lundy MW, Henneman ZJ, Nancollas GH, Sun S, Blazewska KM, Bala JL, Kashemirov BA, et al. (2010) Fluorescent risedronate analogues reveal bisphosphonate uptake by bone marrow monocytes and localization around osteocytes in vivo. J Bone Miner Res. 25, 606–616. [DOI] [PMC free article] [PubMed] [Google Scholar]
- 18.Roelofs AJ, Stewart CA, Sun S, Blazewska KM, Kashemirov BA, McKenna CE, Russell RG, Rogers MJ, Lundy MW, Ebetino FH, et al. (2012) Influence of bone affinity on the skeletal distribution of fluorescently labeled bisphosphonates in vivo. J Bone Miner Res. 27, 835–847. [DOI] [PubMed] [Google Scholar]
- 19.Hokugo A, Sun S, Park S, McKenna CE, and Nishimura I (2013) Equilibrium-dependent bisphosphonate interaction with crystalline bone mineral explains anti-resorptive pharmacokinetics and prevalence of osteonecrosis of the jaw in rats. Bone. 53, 59–68. [DOI] [PMC free article] [PubMed] [Google Scholar]
- 20.Kempfle JS, Nguyen K, Hamadani C, Koen N, Edge AS, Kashemirov BA, Jung DH, and McKenna CE (2018) Bisphosphonate-Linked TrkB Agonist: Cochlea-Targeted Delivery of a Neurotrophic Agent as a Strategy for the Treatment of Hearing Loss. Bioconjug Chem. 29, 1240–1250. [DOI] [PMC free article] [PubMed] [Google Scholar]
- 21.Marras SA (2006) Selection of fluorophore and quencher pairs for fluorescent nucleic acid hybridization probes. Methods Mol Biol. 335, 3–16. [DOI] [PubMed] [Google Scholar]
- 22.Drake MT, Clarke BL, Oursler MJ, and Khosla S (2017) Cathepsin K Inhibitors for Osteoporosis: Biology, Potential Clinical Utility, and Lessons Learned. Endocr Rev. 38, 325–350. [DOI] [PMC free article] [PubMed] [Google Scholar]
- 23.Mukherjee K, and Chattopadhyay N (2016) Pharmacological inhibition of cathepsin K: A promising novel approach for postmenopausal osteoporosis therapy. Biochem Pharmacol. 117, 10–19. [DOI] [PubMed] [Google Scholar]
- 24.Lecaille F, Bromme D, and Lalmanach G (2008) Biochemical properties and regulation of cathepsin K activity. Biochimie. 90, 208–226. [DOI] [PubMed] [Google Scholar]
- 25.Lecaille F, Weidauer E, Juliano MA, Bromme D, and Lalmanach G (2003) Probing cathepsin K activity with a selective substrate spanning its active site. Biochem J. 375, 307–312. [DOI] [PMC free article] [PubMed] [Google Scholar]
- 26.Gauthier JY, Chauret N, Cromlish W, Desmarais S, Duong LT, Falgueyret JP, Kimmel DB, Lamontagne S, Leger S, LeRiche T, et al. (2008) The discovery of odanacatib (MK-0822), a selective inhibitor of cathepsin K. Bioorg Med Chem Lett. 18, 923–928. [DOI] [PubMed] [Google Scholar]
- 27.Perez-Castrillon JL, Pinacho F, De Luis D, Lopez-Menendez M, and Duenas Laita A (2010) Odanacatib, a new drug for the treatment of osteoporosis: review of the results in postmenopausal women. J Osteoporos. 2010. [DOI] [PMC free article] [PubMed] [Google Scholar]
- 28.Clezardin P (2011) Therapeutic targets for bone metastases in breast cancer. Breast Cancer Res. 13, 207. [DOI] [PMC free article] [PubMed] [Google Scholar]
- 29.Marras SA (2008) Interactive fluorophore and quencher pairs for labeling fluorescent nucleic acid hybridization probes. Mol Biotechnol. 38, 247–255. [DOI] [PubMed] [Google Scholar]
- 30.Law S, Andrault PM, Aguda AH, Nguyen NT, Kruglyak N, Brayer GD, and Bromme D (2017) Identification of mouse cathepsin K structural elements that regulate the potency of odanacatib. Biochem J. 474, 851–864. [DOI] [PubMed] [Google Scholar]
- 31.Abagyan R, Orry A, Raush E, and Totrov M (2020) ICM-Pro User Guide v.3.8 http://www.molsoft.com/icmpro/.
- 32.Brömme D, Cathepsin K In Handbook of Proteolytic Enzymes, Rawlings ND; Salvesen G, Academic Press: 2013; pp 1801–1807. [Google Scholar]
- 33.Palumbo A, and Anderson K (2011) Multiple myeloma. N Engl J Med. 364, 1046–1060. [DOI] [PubMed] [Google Scholar]
- 34.Derlin T, and Bannas P (2014) Imaging of multiple myeloma: Current concepts. World J Orthop. 5, 272–282. [DOI] [PMC free article] [PubMed] [Google Scholar]
- 35.Edwards CM, Zhuang J, and Mundy GR (2008) The pathogenesis of the bone disease of multiple myeloma. Bone. 42, 1007–1013. [DOI] [PMC free article] [PubMed] [Google Scholar]
- 36.Merrild DM, Pirapaharan DC, Andreasen CM, Kjaersgaard-Andersen P, Moller AM, Ding M, Delaisse JM, and Soe K (2015) Pit- and trench-forming osteoclasts: a distinction that matters. Bone Res. 3, 15032. [DOI] [PMC free article] [PubMed] [Google Scholar]
- 37.De La Rochere P, Guil-Luna S, Decaudin D, Azar G, Sidhu SS, and Piaggio E (2018) Humanized Mice for the Study of Immuno-Oncology. Trends Immunol. 39, 748–763. [DOI] [PubMed] [Google Scholar]
- 38.Gbyli R, Song Y, and Halene S (2020) Humanized mice as preclinical models for myeloid malignancies. Biochem Pharmacol. 174, 113794. [DOI] [PubMed] [Google Scholar]
- 39.Gastelum G, Chang EY, Shackleford D, Bernthal N, Kraut J, Francis K, Smutko V, and Frost P (2019) Multimodal Bioluminescent and Positronic-emission Tomography/Computational Tomography Imaging of Multiple Myeloma Bone Marrow Xenografts in NOG Mice. J Vis Exp. Jan 7. [DOI] [PMC free article] [PubMed] [Google Scholar]
- 40.Miyakawa Y, Ohnishi Y, Tomisawa M, Monnai M, Kohmura K, Ueyama Y, Ito M, Ikeda Y, Kizaki M, and Nakamura M (2004) Establishment of a new model of human multiple myeloma using NOD/SCID/gammac(null) (NOG) mice. Biochem Biophys Res Commun. 313, 258–262. [DOI] [PubMed] [Google Scholar]
- 41.Rozemuller H, van der Spek E, Bogers-Boer LH, Zwart MC, Verweij V, Emmelot M, Groen RW, Spaapen R, Bloem AC, Lokhorst HM, et al. (2008) A bioluminescence imaging based in vivo model for preclinical testing of novel cellular immunotherapy strategies to improve the graft-versus-myeloma effect. Haematologica. 93, 1049–1057. [DOI] [PubMed] [Google Scholar]
Associated Data
This section collects any data citations, data availability statements, or supplementary materials included in this article.