

SUMMARY
Adipose tissue mass and adiposity change throughout the lifespan. During aging, while visceral adipose tissue (VAT) tends to increase, peripheral subcutaneous adipose tissue (SAT) decreases significantly. Unlike VAT, which is linked to metabolic diseases, including type 2 diabetes, SAT has beneficial effects. However, the molecular details behind the aging-associated loss of SAT remain unclear. Here, by comparing scRNA-seq of total stromal vascular cells of SAT from young and aging mice, we identify an Aging-dependent Regulatory Cell (ARC) population that emerges only in SAT of aged mice and humans. ARC express adipose progenitor markers but lacks adipogenic capacity; they secrete high levels of pro-inflammatory chemokines, including Ccl6, to inhibit proliferation and differentiation of neighboring adipose precursors. We also found Pu.1 to be a driving factor for ARC development. We identify an ARC population and its capacity to inhibit differentiation of neighboring adipose precursors, correlating with aging-associated loss of SAT.
eTOC blurb:
Nguyen et al. identify an Aging-dependent Regulatory Cell (ARC) population that emerges specifically in subcutaneous adipose tissue (SAT) during aging. ARCs inhibit differentiation and proliferation of neighboring adipogenic precursors and may contribute to loss of SAT during aging. Pu.1 is critical for ARC development and phenotype of ARC.
INTRODUCTION
Adipose tissue mass, adiposity, is flexible and undergoes changes throughout the human lifespan. The total number of adipocytes in adipose tissue is set mainly during adolescence, and thus, changes in WAT mass mostly reflect alterations in lipid storage (Spalding et al., 2008). However, the adipocyte number can also increase via recruitment of precursors in the stromal vascular fraction (SVF) of adipose tissue to differentiate into adipocytes. Certain extrinsic factors, such as obesogenic signals and hyperphagia, can stimulate the proliferation and differentiation of these adipose precursors in mice (Wang et al., 2013; Jeffery et al., 2015). Precursors undergo adipogenic differentiation by a cascade of transcription factors, a transient increase in expression of C/ebpβ and C/ebpδ, followed by expression of Pparγ and C/ebpα (Gregoire et al., 1998; Jiang et al., 2017). Although adipose progenitors have been traditionally identified by certain markers, such as CD24, Pdgfrα, and Pref-1 (also called Dlk1), fluorescence-activated cell sorting (FACS) and genetic lineage tracing revealed heterogeneity of adipose precursors (Smas and Sul, 1993; Lee et al., 2003; Rodeheffer et al., 2008; Hudak and Sul, 2013; Berry and Rodeheffer, 2013; Hudak et al., 2014; Gulyaeva et al., 2018; Burl et al., 2018; Merrick et al., 2019). Recently, single-cell RNA-sequencing (scRNA-seq) has emerged as a tool to study heterogeneous adipose precursors, providing new insights into their developmental hierarchies from multipotent mesenchymal stem cells (MSC) to committed adipose precursor cells (APC). However, many scRNA-seq studies used SVF cells after initial FACS to eliminate immune cell types, and thus, they may not reflect all populations of adipose precursors to illustrate complete hierarchies of these cells.
During aging, visceral adipose tissue (VAT) and inter-muscular fat tend to increase. In contrast, peripheral subcutaneous adipose tissue (SAT) is known to be reduced significantly with aging in both mice (Kirkland et al., 2002) and human (Arner, 1995; Ibrahim, 2010; Wollina et al., 2017). While VAT is associated with pathological conditions, such as insulin resistance and cardiovascular diseases, SAT is protective against these diseases in human (Arner, 1995; Ibrahim, 2010; Mancuso and Bouchard, 2019). Although the developmental origin of VAT and SAT is known to differ, in general, the proliferation and differentiation capacities of adipose progenitors are believed to drastically decline during aging in human (Kirkland and Dobson, 1997; Caso et al., 2013). These cells may even undergo cell senescence and death, altering WAT mass and producing systemic consequences in both mice and human (Kirkland and Dobson, 1997; Tchkonia et al., 2010). However, the potential changes of SVF cell populations and interrelationship among different populations during aging that could lead to quiescence and/or impaired adipocyte differentiation are not well understood.
To investigate the aging-associated loss of SAT, we performed scRNA-seq to compare total cells of SVF of SAT from young and aging mice. We found a drastic decrease in adipose precursor populations in aging. More importantly, we detected the aging-dependent emergence and accumulation of a subpopulation in SAT, that we refer to as ‘Aging-dependent Regulatory Cells’ (ARC) in mice. We also detected the ARC population in SAT of older, but not young human volunteers. Even though these APCs are positive for adipose progenitor markers, they exhibit impaired differentiation capacity and have high expression of proinflammatory cytokines, such as Ccl6. ARC do not express pan-immune marker, CD45, but have high expression of proinflammatory genes. We find that, by secreting cytokines, ARC inhibit proliferation and differentiation of neighboring bona fide adipose precursors. Thus, ARC lead MSCs in SAT to become increasingly quiescent, and APCs and preadipocytes to lose their capacity to proliferate and differentiate into adipocytes. Moreover, we show that Pu.1 (also called Spi1) is involved in the development of ARC in SAT and that preadipocytes ectopically expressing Pu.1 can inhibit differentiation of neighboring cells in vivo. Taken together, the aging-dependent emergence of ARC may play a role in the decrease of adipose precursor number, inhibition of adipogenesis, the loss of SAT that we detect during aging.
RESULTS
Emergence of Aging-dependent Regulatory Cells (ARC) in Subcutaneous Adipose Tissue in Aged Mice
By performing scRNA-seq, we investigated the heterogeneity of SVF cell populations in inguinal WAT (iWAT), as a representative SAT, from 10 wk-old (young), 48 wk-old (aged), and 72 wk-old (old) mice. To prevent potential bias arising from cell sorting, we used total SVF of iWAT without depleting Lin+ cells (CD45+, CD31+, Ter119+) (Rodeheffer et al., 2008) comprised of immune and endothelial cells. iWAT pads of 2 mice from each age group were subjected to scRNA-seq. For analysis, Partek Flow was used to generate t-distributed stochastic neighbor embedding (t-SNE) plots. Unsupervised clustering of gene expression profiles identified 10 clusters in young mice and 11 clusters in aged and old mice, with each cluster containing ~500 to 2,500 cells with the average of approximately 190,000 reads per cell (Fig. 1a). We repeated our scRNA-seq three times to ensure reproducibility (Fig. S1a). Remarkably, this unbiased approach to scRNA-seq enabled us to visualize distinct subpopulations of iWAT. The comparable number of cells we obtained for both Lin+ and Lin− populations reflects an accurate representation of the SVF environment in iWAT.
Figure 1. Emergence of Aging-dependent Regulatory Cells (ARC) in subcutaneous adipose tissue in aged mice.
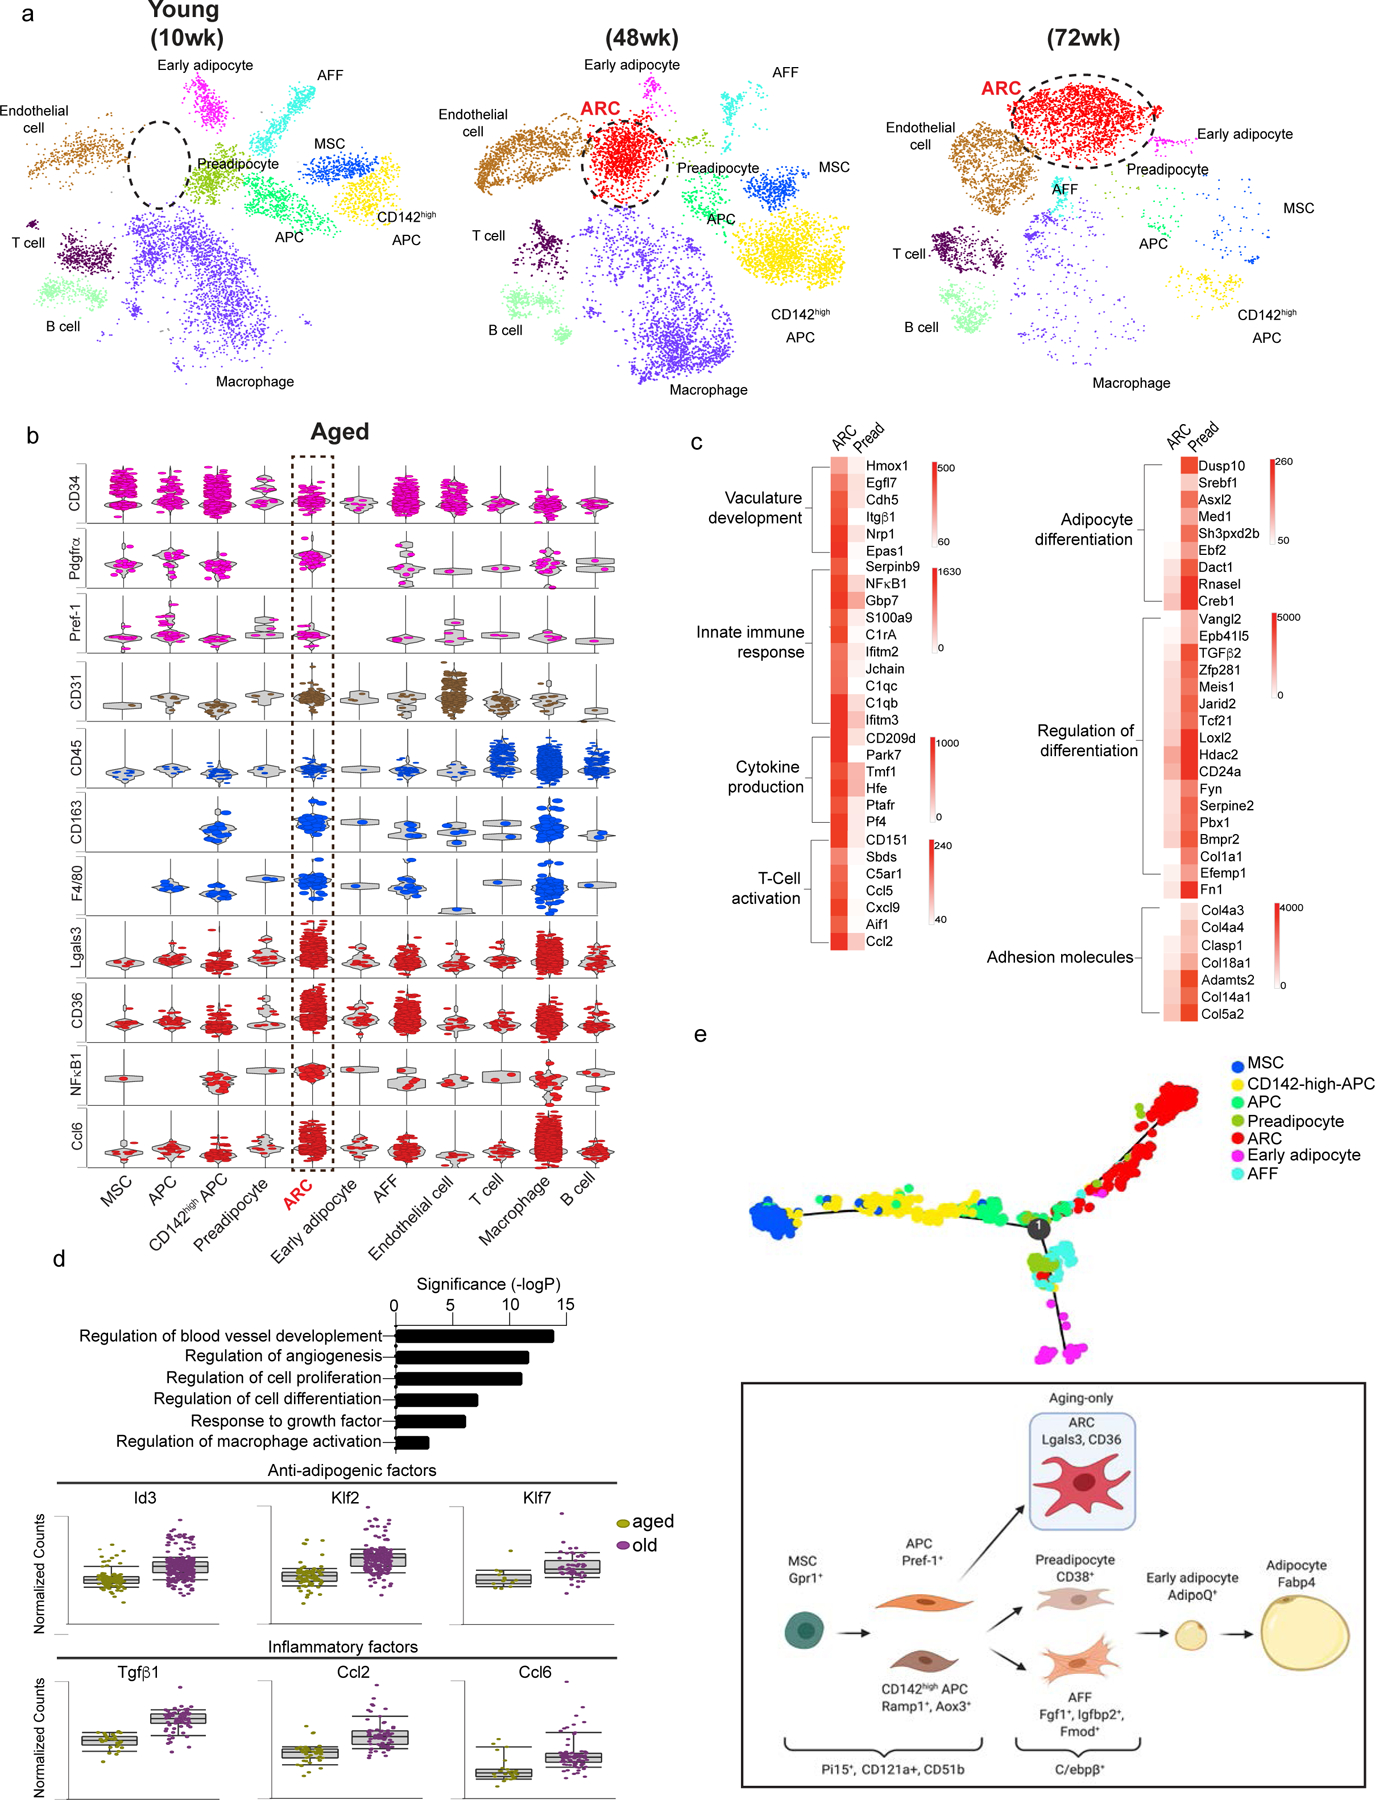
(a) tSNE-plot showing SVF populations isolated from iWAT of 10 (young), 48 (aged), and 72 (old) wk-old mice with ARC circled in red.
(b) Normalized gene expression values as violin plots of adipose lineage, endothelial, immune and inflammatory genes, and top genes expressed in ARC from aged mice.
(c) Heatmap of differentially expressed genes that are >2-fold higher (left) and <2-fold lower (right) in ARC compared to preadipocytes.
(d) Enriched pathways in old ARC are similar to ARC from aged mice.
(e) In silico cell trajectory of adipose-lineage populations.
(f) Schematic model depicting the lineage hierarchy of adipose-lineage cell populations. See also figure S1 and S1b.
We detected 3 immune subpopulations, including B cells, T cells, and macrophages, as well as endothelial cells, that were all Lin+ using B cell-, T cell- and macrophage-specific markers, such as Fcgr3, Cd79b, Ccl5 (Fig. S1b) (van Mourik et al., 1985; Kraus et al., 2001; Lau et al., 2004; Cho et al., 2014; Eberlein et al., 2020). Lin− cell populations in adipose tissue contained adipose progenitor populations marked by CD34. Among adipose lineage populations, in addition to the previously recognized 3 adipose precursor populations, mesenchymal stem cells (MSC), adipose precursor cells (APC), and CD142high APC (Lee et al., 2013; Merrick et al., 2019; Wang et al., 2013; Plikus et al., 2017; Hepler et al., 2018; Marangoni et al., 2015; Schwalie et al., 2018; Jiang et al., 2014; Berry et al., 2016; Xue et al., 2015), we detected 3 additional populations: adipose-specific ‘Adipogenic Fmod+ fibroblasts (AFFs)’, capable of differentiating into adipocytes (Fig. S1d); preadipocytes; and early adipocytes. AFFs are specific to SAT since we did not detect them in VAT by scRNA-seq (Data not shown). Overall, detection of these additional precursor populations may be resulted from the use of total SVF without FACS. The previous reports using SVF depleted of Lin+ populations or cells expressing certain specific markers for scRNA-seq may have missed the heterogeneity within cell populations. Apart from the previously known cell-type specific markers (Fig. S1b), we also identified new and more specific markers for adipose lineage populations: Pi15 (Peptidase inhibitor 15) and CD121a for both MSCs and APCs, Gpr1 specific for MSCs, Pref-1 for APCs, Ramp1 and Aox3 for CD142high APCs, and Fgf1 and Fmod for AFFs (Fig. S1c).
The most striking feature of SVF landscape in iWAT of aged mice was an additional cluster that emerged as a population that we named Aging-dependent Regulatory Cells (ARC). This cluster was detected only in SVF of iWAT from 48 wk-old aged but not young mice, and this cluster increased further in 72 wk-old mice (Fig.1a, 2a). These ARC were CD34+, Pdgfrα+, and Pref-1+, which are known to be expressed in adipose progenitor cells (Smas and Sul, 1993; Lee et al., 2003; Rodeheffer et al., 2008; Hudak and Sul, 2013; Berry and Rodeheffer, 2013; Lee et al., 2013; Hudak et al., 2014; Gulyaeva et al., 2018; Burl et al., 2018; Merrick et al., 2019; Oguri et al., 2020). Moreover, they expressed very low levels of an endothelial marker, CD31, and a panleukocyte marker, CD45, demonstrating that they were not endothelial or immune cells, respectively. Yet, these cells showed high levels of inflammatory markers, such as CD163, F4/80 (Adgre1), Lgals3, CD36, and NFκB1 (Lumeng et al., 2007b; Papaspyridonos et al., 2008; Cai et al., 2012; Tourniaire et al., 2013). They also expressed high levels of chemokines, such as Ccl6 and Ccl8 (Fig. 1b). Expression of these chemokines was increased further in 72 wk-old mice (Fig. 2a). Because mice gained weight as aging progressed, we tested whether high fat diet (HFD)-fed young mice that gained similar weight as aged mice develop ARC. However, we did not detect the ARC population in SVF from iWAT of HFD-fed young mice, reinforcing the notion that the emergence of ARC is indeed primarily dependent on aging (Fig. S2c). We next examined the potential origin of ARC or its relationship with other adipogenic clusters. We performed in silico cell trajectory analyses. The analyses predicted both CD142-high-APC and APC are derived from MSC. It also showed APCs give rise to preadipocytes and AFF, both of which can differentiate to early adipocytes. Importantly, ARC are inferred to derive from APC, but not CD142-high-APC. And ARC are predicted not to differentiate into adipocytes (Fig. 1e, S1e). To further verify that ARC are not derived from immune lineage, we performed cell trajectory analysis with adipose linage cells and immune cells. The analysis showed that immune cells all highly expressed CD45 markers while ARC did not. Even though immune cells do not share lineage with adipose populations, forced cell trajectory analysis further indicated that ARC is not derived from macrophage or other immune cells (Fig. S1f).
Figure 2. Isolation of ARC by Lgals3 and CD36 and their impairment in adipogenic differentiation.
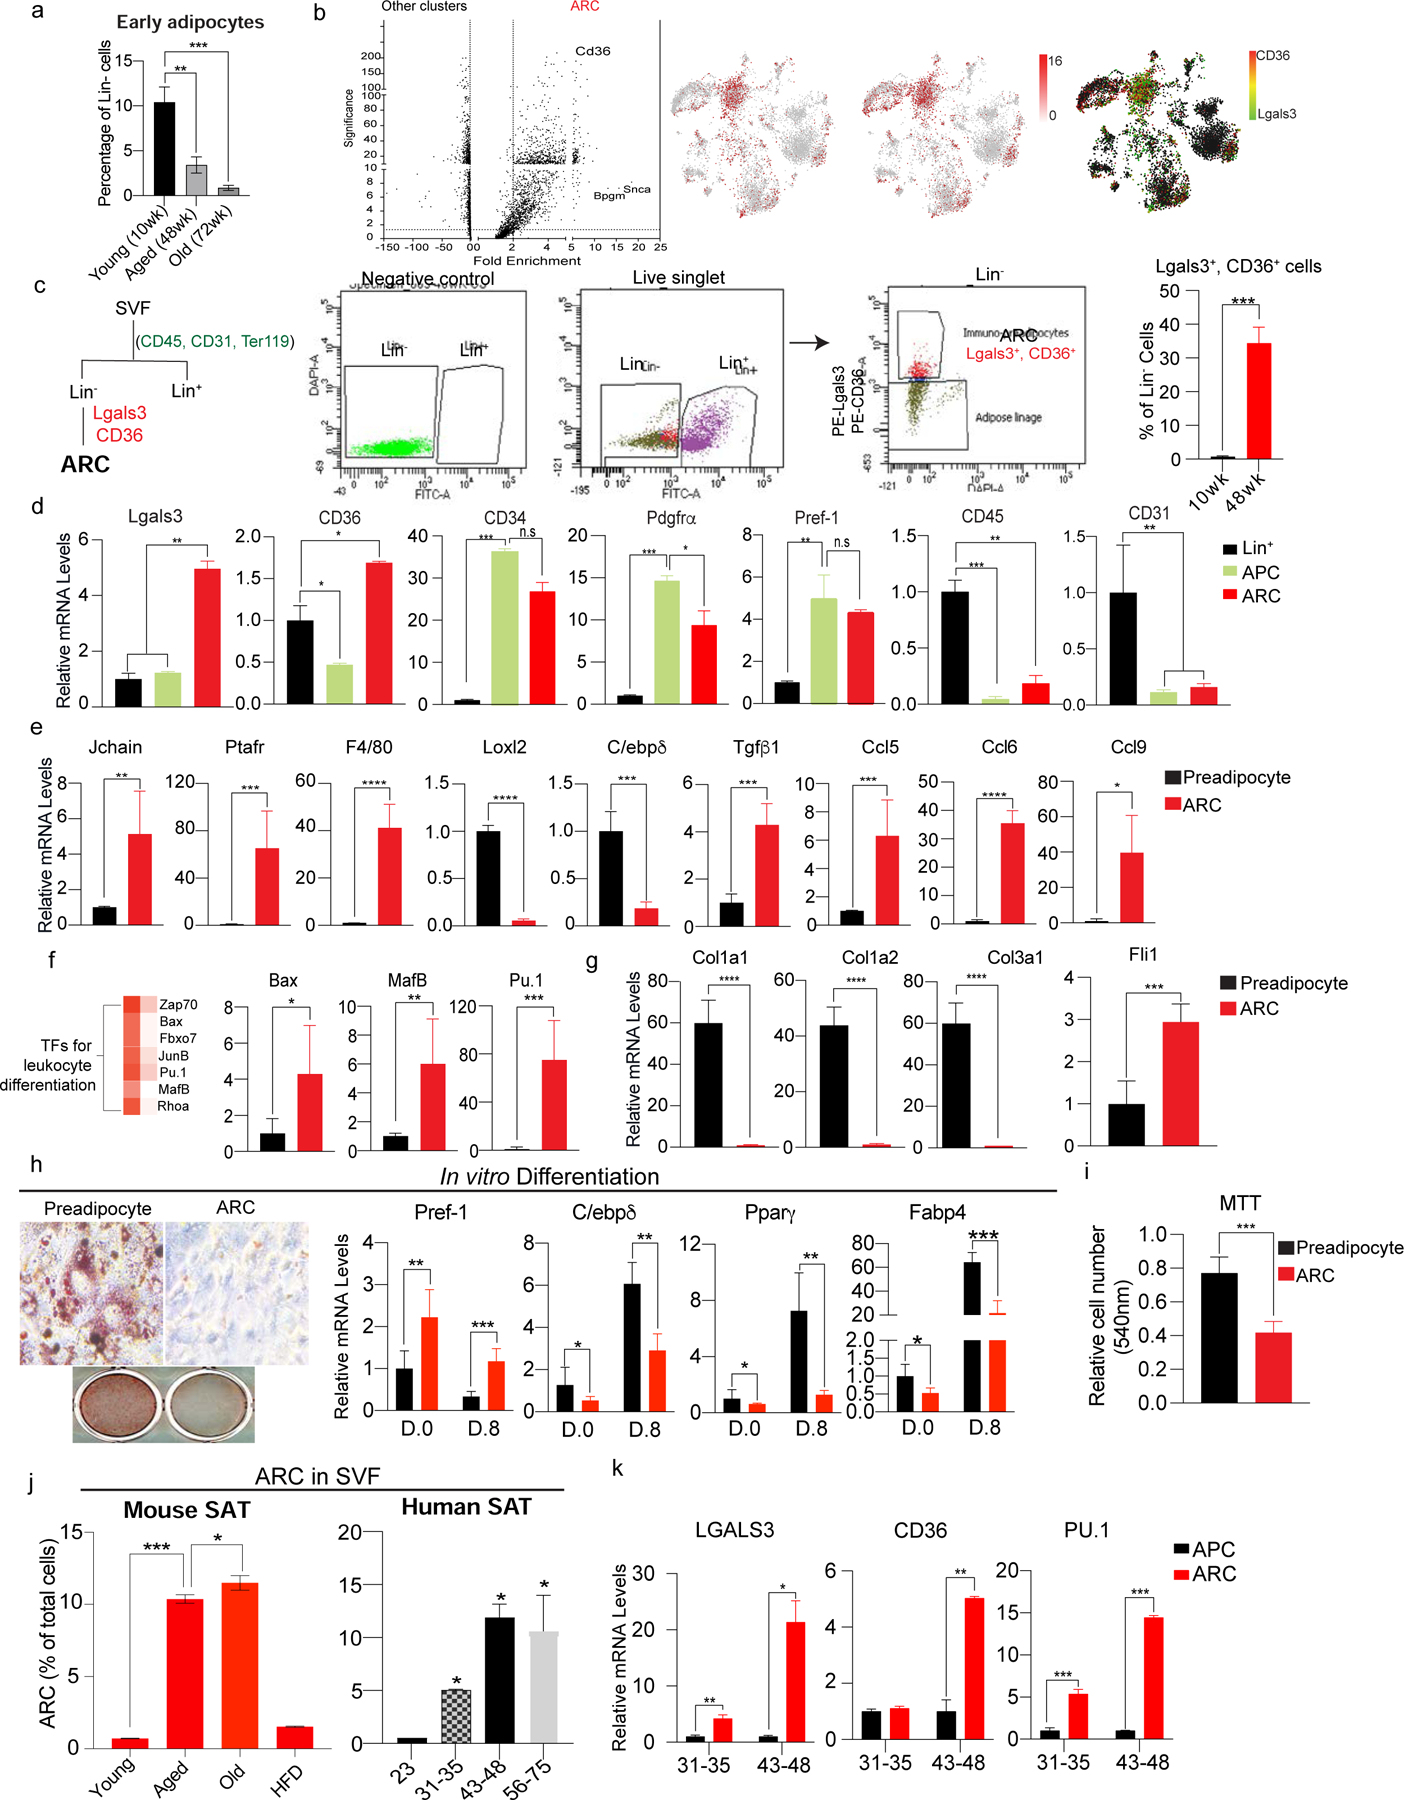
(a) FACS analysis for early adipocytes using FABP4 in iWAT of young (10wk), aged (48wk), and old (72wk) mice (n=6).
(b) (Left) Volcano plot of differential gene expression of ARC compared to other clusters in SVF of iWAT of aged mice. (Right) tSNE-plot showing co-localization of Lgals3 and CD36 in the ARC cluster.
(c) (Left) FACS gating strategy for isolation of ARC by FACS. ARC cells were isolated from Lin− cells with Lgals3 and CD36. (Right) Percentage of Lgals3+ and CD36+ cells in Lin− cells of iWAT of young and aged mice (n=6).
(d) RT-qPCR of FACS-sorted ARC, APC, and Lin+ cells. ARC markers: Lgals3 and CD36, adipose progenitor markers: CD34, Pdgfrα, and Pref-1, Immune cell marker: CD45, and endothelial cell marker: CD31 (n=4–6).
(e) RT-qPCR of FACS-sorted ARC and preadipocytes for genes involved in inflammation (Jchain, Prafr, and F4/80), regulation of adipocyte differentiation (Loxl2 and C/ebpδ), and chemokine production (Ccl5, Ccl6, Ccl9) (n=6).
(f) (Left) Heatmap of enriched transcription factors regulating leukocyte differentiation in ARC vs other clusters. (Right) RT-qPCR of FACS-isolated ARC and preadipocyte transcription factors, including Bax, MafB, and Pu.1.
(g) RT-qPCR of FACS-sorted ARC and preadipocyte for adhesion molecules, such as Col1a, Col2a, and Col3a1 and transcription factor, Fli1 (n=6).
(h) In vitro adipocyte differentiation of isolated preadipocytes using CD38 and ARC. (Left) Oil Red O staining, and (Right) RT-qPCR for Pref-1, C/ebpδ, Pparγ, and Fabp4 (n=8).
(i) MTT assay comparing cell numbers of cultured FACS-isolated preadipocytes and ARC (n=8).
(j) FACS analysis of the percentage of ARC in iWAT of young, aged, old, and HFD-fed mice (n=4).
(k) (Left) FACS analysis of the percentage of ARC in SAT of humans. (Right) RT-qPCR of LGALS3, CD36, and PU.1 (n=6).
Data are represented as mean ± S.D. *≤0.05, **≤0.01, ***≤0.001. See also Figure S2.
When compared gene expression of the ARC population to the preadipocytes, ARC of 48 wk-aged mice had remarkably high expression of genes involved in innate immune response, such as Jchain and C1qC (Complement C1Q C chain) (Brandtzaeg, 1983; van den Berg et al., 1996); cytokine production, such as CD209 and Tmf1 (TATA element modulatory factor 1) (Chen et al., 2006; Perry et al., 2004); T cell activation, such as CD151 and Ccl5 (Eberlein et al., 2020; Seu et al., 2017); and cytokines, such as Tgfβ1, Ccl2 and Ccl6. They had exceedingly low expression of pro-adipogenic factors, such as Dusp10, yet expressed high levels of anti-adipogenic factors, including Id3, Klf2, and Klf7, suggesting that these cells may lack adipocyte differentiation capacity (Choi et al., 2013; Moldes et al., 1997; Banerjee et al., 2003; Kawamura et al., 2006). Interestingly, unlike preadipocytes, these cells expressed very low levels of adhesion molecules, such as Col4a3, Col4a4, and Col5a2 (Fig. 1c) (Dai et al., 2017). Also expression of anti-adipogenic and inflammatory markers in ARC was increased further in 72 wk-old mice, suggesting amplification of their pro-inflammatory effects and impairment of adipocyte differentiation as aging progresses (Fig. 1d). Compared to ARC of 48 wk-old mice, those of 72 wk-old mice showed further enrichment of genes involved in immune activation and angiogenesis (Fig. 1c). Overall, these results demonstrate the aging-dependent emergence and accumulation of ARC in SAT.
Isolation of ARC by Lgals3 and CD36 and their Impairment of Adipogenic Differentiation
To isolate and characterize the ARC from SVF, we identified two highly enriched cell surface proteins, Lgals3 and CD36, as markers (Fig. 2b). We first separated SVF of iWAT into Lin+ and Lin− populations using CD45, CD31, and Ter119. From the Lin− cells, we selected Lgals3+, CD36+ cells as ARC. Lgals3+ CD36+ cells were approximately 33% of Lin- population, a similar percentage estimated from scRNA-seq data (Fig. 2c). To document aging-dependent changes in SAT, we sorted adipocytes from Lin− population by FACS using FABP4. As expected, percentage of early adipocytes were significantly lower in SAT of 48-wk-old mice (3%) compared to 10-wk-old mice (10%). And adipocyte percentage further decreased in 72-wk-old mice (0.8%) (Fig. 2a). We also compared weight of SAT of young (20wk-old) and old mice (72wk-old). Indeed, SAT mass decreased approximately 50% in old mice while VAT mass and total body weight increased upon aging(Fig. S2a). These results clearly illustrate the decrease of newly formed adipocytes, ultimately resulting in the loss of SAT in mice during aging. Next, to verify the identity of ARC, we examined gene expression of FACS-sort ARC by RT-qPCR, which indicated increased levels of Lgals3 and CD36 by approximately 5-fold compared to Lin− cells. ARC also showed as high levels of adipose progenitor markers, such as CD34, Pdgfrα, and Pref-1, as those of APCs sorted by Pdgfrα and Pref-1. In contrast, ARC did not express pan-immune marker, CD45, or endothelial cell marker, CD31, compared to Lin+ populations (Fig. 2d). Further examination revealed increased expression levels of immune-related genes, such as Jchain, Ptafr, Adgre1 (F4/80) by 5-, 60-, and 40-fold, respectively. In contrast, expression of adipogenic markers, such as Loxl2 and C/ebpβ, was decreased. Interestingly, ARC also had a 5-fold increase in Tgfβ1 previously shown to inhibit differentiation of APCs and preadipocytes. The sorted ARC also showed increased expression of chemokines, such as Ccl5, Ccl6, and Ccl9, by 6-, 35-, and 40-fold, respectively (Fig. 2e). These ARC highly expressed transcription factors known to regulate leukocyte differentiation, such as Bax, Mafb, and Pu.1, by 4-, 6-, and 80-fold, respectively (Fig. 2f). To examine whether ARC is a distinctive cell population, we compared FACS-sorted ARC to APC and to CD142-high-APC. By RT-qPCR, we confirmed that in ARC, expression levels of ARC-specific genes, including Pu.1, Ccl6, and Tgfb, were significantly higher than in APC or CD142-high-APC (Fig. S2e). The overall gene expression pattern clearly illustrates that ARC exhibit proinflammatory characteristics while lacking expression of adipogenic genes.
We next tested the differentiation capacity of these cells in vitro. After FACS, we attempted to culture ARC, but they did not adhere to the plates. Indeed, RT-qPCR analysis revealed that, compared to CD38-sorted preadipocytes, expression of adhesion molecules, such as Col5a2, Col14a1, Col1a1, Col1a2, Col3a1 decreased significantly, whereas Fli1, a transcription factor reported to inhibit collagen synthesis in fibroblasts, was approximately 3-fold higher in ARC (Fig. 2g) (Asano et al., 2009; Carriere et al., 2017). Therefore, we cultured the ARC on collagen-coated plates to confluency. ARC and preadipocytes were subjected to adipocyte differentiation protocol. At day 0, gene analysis showed ARC having significantly lower levels of C/ebpδ, Pparγ, and Fabp4 and higher levels of Pref-1, suggesting ARC may have lower differentiation capacity. Indeed, Oil Red O staining revealed lower lipid accumulation in ARC compared to preadipocytes. RT-qPCR showed while, there was a 2.5-fold increase in the expression of Sox9, a transcription factor known to inhibit adipocyte differentiation (Gulyaeva et al., 2018; Wang and Sul, 2009) and a >2-fold decrease in expression of adipogenic factors, such as C/ebpδ, Pparγ, and Fabp4 (Fig. 2h), demonstrating impaired capacity of ARC for adipocyte differentiation. When ARC were cultured in lower density, these cells had 2-fold higher proliferative capacity than preadipocytes, as estimated by MTT assay (Fig. 2i). Overall, we found that ARC express markers of adipose progenitors, but they cannot undergo adipogenesis.
We next isolated and compared ARC from SVF of young, aged, old, and HFD-fed young mice. FACS analysis revealed that, while ARC numbers were almost undetectable in SVF of young mice and ARC numbers were significantly higher in aged mice and were further increased in old mice (Fig. 2j, left). Moreover, when young mice were on HFD, they did not have ARC (Fig. S2c). Tissue staining of iWAT by ARC markers, Lgals3 and CD36, confirmed presence of ARC in iWAT of aged, but not young, mice (Fig. S2d). To test whether the ARC population we detected in mice is present also in humans during aging, SAT from donors of varying ages without any underlying health issues were subjected to SVF isolation followed by FACS protocol as performed in mice. Indeed, we clearly detected ARC in SAT samples of older humans (Fig. 2j, right). Similar to mice, we detected increasing ARC numbers in humans with age, as demonstrated by higher number of ARC in the middle-age and elderly groups compared to younger individuals. RT-qPCR showed significantly higher levels of LGALS3, CD36, and PU.1 in FACS-isolated human ARC compared to APCs, with their expression increasing in older individuals (Fig. 2k). Overall, these results demonstrate ARC indeed exist in SAT of aged mice and humans, and the presence of ARC is a function of age.
ARC Secrete Chemokines to Inhibit Proliferation and Differentiation of Neighboring Adipose Precursors
With high immune characteristics and secretion of various cytokines, ARC may potentially affect neighboring adipose progenitor cells. We tested effects of ARC on the differentiation of adipose-lineage cells by co-culture experiments. ARC isolated from iWAT of aged mice by FACS using Lgals3 and CD36 were subjected to irradiation to prevent their potential differentiation into adipocytes. These cells were mixed with 3T3-L1 cells, co-cultured on Matrigel, and then subjected to adipocyte differentiation. Oil Red O staining and brightfield imaging revealed that control 3T3-L1 cells on Matrigel fully differentiated into adipocytes. In contrast, cells co-cultured with irradiated ARC showed significantly lower lipid accumulation. RT-qPCR showed Sox9 mRNA levels in 3T3-L1 cells co-cultured with ARC increased by 2-fold, while expression of adipogenic markers C/ebpβ, C/ebpδ, Pparγ, and Fabp4, was decreased by approximately 50% (Fig. S3a). We also tested ARC effect on adipocyte differentiation of 3T3-L1 cells, by using conditioned media from ARC or from APCs. 3T3-L1 cells subjected to differentiation protocol in conditioned media from ARC had lower lipid accumulation compared to cells in conditioned media from APCs (Fig.3a). And RT-qPCR revealed 3T3-L1 cells in conditioned media of ARC already had lower expression levels of C/ebpβ, C/ebpδ, Pparγ, and Fabp4. Furthermore, at Day 8 of differentiation, 3T3-L1 cells in conditioned media from ARC had approximately 2-fold lower expression of adipogenic genes than cells in conditioned media from APCs (Fig. 3b). These results demonstrate that ARC can prevent differentiation of neighboring adipose precursors into adipocytes. We also examined whether CD142-high-APCs could inhibit adipogenesis of neighboring precursors. Gene analysis showed that CD142-high-APCs did not have higher levels of anti-adipogenic genes, such as Ddk3, Meox2, Spink1 which were reported by Schwalie et al. When 3T3-L1 cells were subjected to differentiation in conditioned media from either APCs or CD142-high-APCs, lipid staining showed no differences between the two treatments. 3T3-L1 cells in conditioned media from CD142-high-APCs showed similar levels of adipogenic markers compared to cells treated with conditioned media from APCs (Fig. S3b). Taken together, we conclude that in SAT of aged mice, only ARC, but not CD142-high-APC, can inhibit adipogenesis of neighboring cells.
Figure 3. ARC secrete cytokines to inhibit proliferation and differentiation of neighboring adipose precursors.
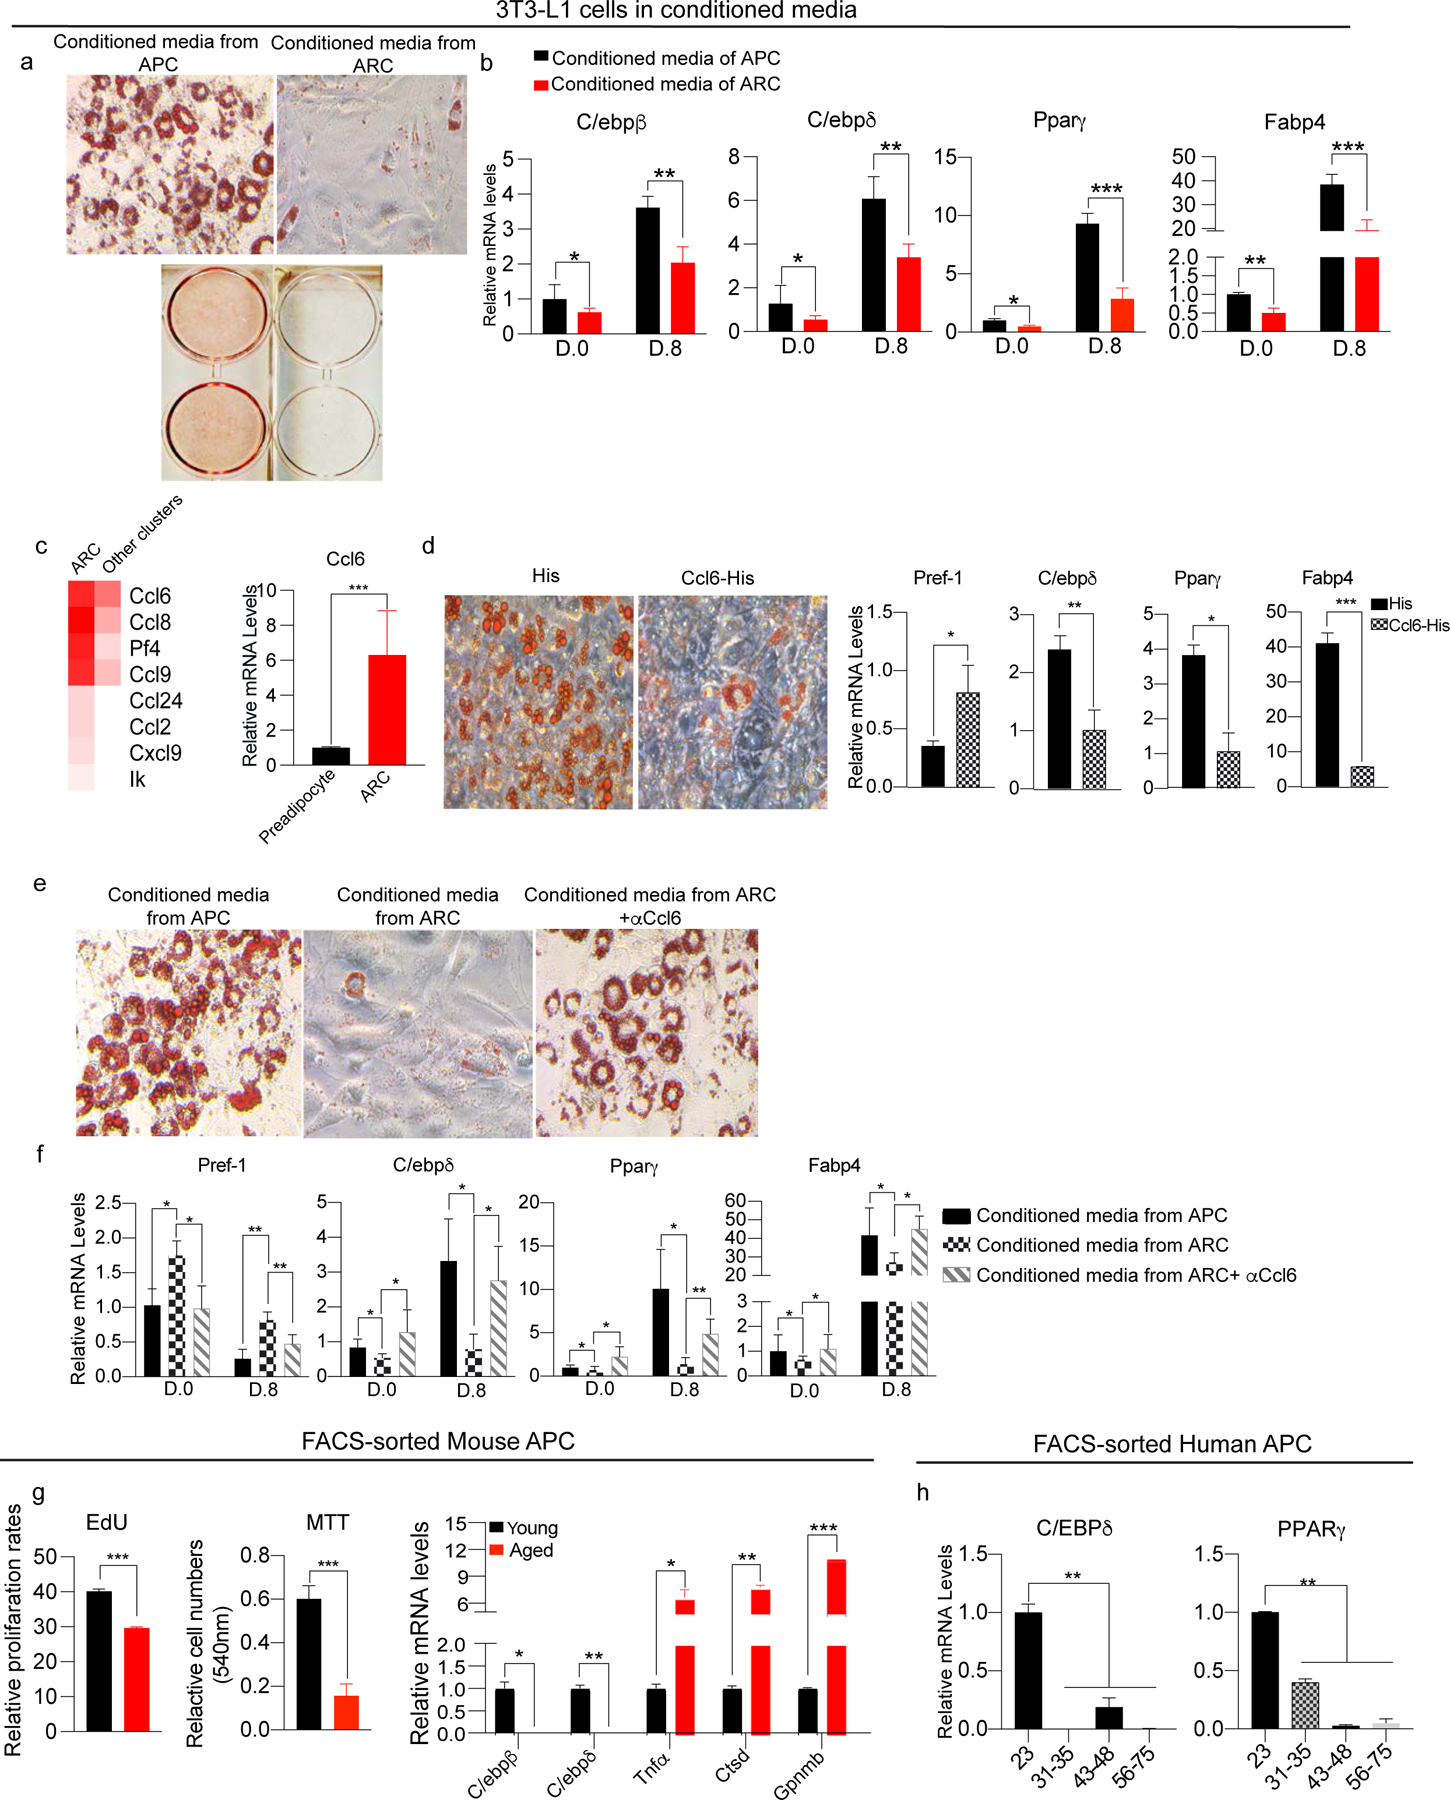
(a) Oil Red O staining of differentiated 3T3-L1 cells cultured in conditioned media from either FACS-isolated APCs or ARC.
(b) RT-qPCR of 3T3-L1 cells cultured in conditioned media from either FACS-isolated APCs or ARC, for C/ebpβ, C/ebpδ, Pparγ, and Fabp4 (n=6).
(c) (Left) Heatmap of enriched chemokines in ARC. (Right) RT-qPCR for Ccl6 (n=4–6).
(d) Adipocyte differentiation of 3T3-L1 cells cultured with either His-peptide or recombinant Ccl6 in media. (Left) Oil Red O staining, (Right) RT-qPCR for Pref-1, C/ebpδ, Pparγ, and Fabp4 (n=8).
(e) Adipocyte differentiation of 3T3-L1 cells cultured in APC, ARC, or ARC media with Ccl6 neutralizing antibody. Oil Red O staining in each condition post-induction of adipocyte differentiation.
(f) RT-qPCR for Pref-1, C/ebpδ, Pparγ, and Fabp4 of adipocyte differentiation of 3T3-L1 cells cultured in APC, ARC, or ARC media with Ccl6 neutralizing antibody (n=6).
(g) (Left) FACS analysis of EdU incorporation into APCs from iWAT of young and aged mice. Cell numbers were measured after 48hr culturing by MTT assay. (Right) RT-qPCR of adipogenic genes, C/ebpβ and C/ebpδ as well as inflammatory genes, Tnfα, Ctsd, and Gpnmb in FACS-isolated young and aged APCs (n=4–6).
(h) RT-qPCR of C/ebpβ and Pparγ in FACS-isolated APCs by Pdgfrα and Pref-1 of different age groups isolated from human SAT by FACS (n=4).
Data are represented as mean ± S.D. *≤0.05, **≤0.01, ***≤0.001. See also figure S3.
As shown in ANOVA in Figure 1c, ARC had high levels of numerous cytokines. In this regard, certain chemokines and chemokine receptors, such as Cxcl3 and Cxcr2, have been reported to promote adipocyte differentiation of 3T3-L1 cells (Kabir et al., 2014; Kusuyama et al., 2016). Thus, we hypothesized that ARC may affect differentiation of nearby adipose precursor cells via secretion of chemokines. RT-qPCR indicated Ccl6 was the chemokine expressed at highest levels in ARC compared to all other cell populations that are known to highly express chemokines, such as macrophages (Fig. 3c). Therefore, we tested the effects of Ccl6 on differentiation by plating 3T3-L1 cells to confluency and subjecting them to the adipocyte differentiation protocol in the presence of Ccl6 or control His-peptide. Oil Red O staining revealed lower lipid staining in Ccl6 treated cells compared to control cells. Ccl6 treated cells had approximately 2-fold higher expression of Pref-1, while having significantly lower expression of adipogenic markers, such as C/ebpδ, Pparγ, and Fabp4 (Fig. 3d). To determine whether inhibitory effects of ARC on adipogenesis of neighboring cells depend on Ccl6, we cultured 3T3-L1 cells in conditioned media from ARC in the presence of Ccl6 neutralizing antibody. 3T3-L1 cells in conditioned media from ARC had significantly lower levels of adipogenic markers, such as C/ebpδ, Pparγ, and Fabp4, and higher levels of Pref-1. 3T3-L1 cells in media from ARC along with Ccl6 neutralizing antibody showed similar lipid staining as cells treated with conditioned media from APCs, demonstrating the inhibitory effect of ARC on adipocyte differentiation of neighboring cells was due to the presence of Ccl6 in the ARC conditioned media. Gene analysis revealed similar decrease in expression levels of C/ebpδ, Pparγ, and Fabp4, and increased levels of Pref-1 in 3T3-L1 cells in conditioned media from ARC. In contrast, cells treated with conditioned media from ARC along with Ccl6 neutralizing antibody showed similar levels of adipogenic markers, compared to cells in conditioned media from APCs (Fig. 3f). Overall, these results clearly demonstrate the inhibitory effects of ARC on differentiation of adipose precursors through chemokine secretion.
In this regard, by our scRNA-seq analysis, APCs, AFFs, and preadipocytes of SAT of aged mice expressed lower levels of pro-adipogenic factors than young mice (Fig.S3e–g). We next isolated APCs by FACS using Pdgfrα and Pref-1 and analyzed gene expression of these cells without culturing. Gene analysis showed that APCs from iWAT of aged mice had lower levels of C/ebpβ and C/ebpδ compared to APCs of young mice, confirming that, as aging progresses, APCs from old compared to young mice have decreased adipogenic differentiation capacity. These results implicate inhibitory effect of ARC on adipogenesis of APCs in SAT of aged mice. In contrast, APCs of aged mice showed increased expression of inflammatory factors, such as TNFα, Ctsd (Cathepsin D), Gpnmb (Transmembrane glycoprotein NMB), that might further decrease adipogenic differentiation capacity (Fig. 3g, right). We also examined APCs isolated from SAT of human individuals. Indeed, adipogenic genes, such as C/EBPδ and PPARγ, all decreased with aging in Lin− cells of human samples. These results demonstrate decrease in adipogenic capacity of APCs in aging, not only from their intrinsic difference, but more likely due to emergence of ARC (Fig. 3h).
Interestingly, when 3T3-L1 cells were cultured at a low density for 48 hrs in conditioned media from either ARC or preadipocytes, 3T3-L1 cells in media from ARC had a 50% reduction in cell proliferation compared to those in media from preadipocytes (Fig. S3c). Similarly, incubation of 3T3-L1 cells at a low density with recombinant His-Ccl6 for 48 hrs showed a 50% lower cell numbers compared to those incubated with control, His-peptide (Fig. S3d). These results suggest that ARC, not only inhibit adipogenic differentiation of precursor cells as shown above but may also decrease proliferation of these cells.
Indeed, the scRNA-seq detected that each adipose lineage populations, such as MSCs, APCs, AFFs, preadipocytes, and early adipocytes, all showed a decrease in their numbers in aged mice and became more drastic in old mice (Fig. 1a). Moreover, the MSCs of aged mice had increased expression of stem cell quiescence genes, while APCs had decreased levels of proliferation-related genes (Fig. S3e). Similarly, CD142high APCs, AFFs, and preadipocytes exhibited lower expression of proliferation-related genes, correlating with the drastic decrease in their cell numbers in aged mice.
We next verified the decreased capacity of proliferation of adipose precursors in vivo. First, mice were injected with EdU, and APCs were selected from Lin− cells by FACS using Pref-1 and Pdgfrα. FACS analysis of APCs stained with EdU revealed a significantly lower percentage of EdU+ APCs of aged compared to young mice (Fig. 3g, left). We also performed MTT assay to further confirm the decrease in proliferative capacity. After FACS, the same number of APCs from young and aged mice were seeded at a low density and cultured for 48 hrs. The cell number of APCs from aged mice after culture was consistently lower compared to young mice, verifying reduced proliferation of APCs, demonstrating that APCs do not proliferate as aging progresses.
Overall, we conclude that the adipose precursors are decreased in their numbers, with lower expression of adipogenic genes and that emergence and action of ARC may contribute to limited adipogenesis.
The Role of Pu.1 in ARC Generation and function
During examination of the gene expression profile of ARC (Fig. 2d), expression of Pu.1 was 90-fold higher in ARC than in preadipocytes, the highest among all transcription factors. Pu.1 has previously been shown to transform fibroblasts into macrophage-like cells (Feng et al., 2008). We speculated that Pu.1 might be involved in the emergence of ARC during aging. To test this hypothesis, we overexpressed GFP-tagged Pu.1 in 3T3-L1 cells, and GFP+ cells were isolated by FACS. Overexpression of Pu.1 was verified by RT-qPCR and immunoblotting (Fig. 4a). Upon Pu.1 overexpression, an ARC marker, Lgals3 increased approximately by 3.5-fold, indicating the phenotypic shift of 3T3-L1 cells to ARC-like cells. Moreover, expression of macrophage markers, such as Rhoa and Sp3, increased in Pu.1-overexpressing 3T3-L1 cells. Furthermore, we detected increased levels of leukocyte differentiation-related transcription factors, such as Bax and NFkB1, as well as chemokines, such as Ccl6. Fli1 levels also increased. In contrast, Col1a1 and Col3a1 levels decreased significantly upon Pu.1 overexpression (Fig. 4b). We performed RNA-seq of Pu.1 overexpressing 3T3-L1 preadipocytes to document global gene expression pattern (Fig. 4c). Most of the enriched genes were those of immune cell regulation, such as leukocyte differentiation, chemokine production, leukocyte aggregation, and inflammatory mediation. Pu.1 overexpression also increased expression of chemokines, such as Ccl12 and Ccl6. In contrast, most of decreased genes were those involved in adipogenesis, such as C/ebpβ and C/ebpδ, as well as adhesion molecules, including Col1a2, Col3a1, and Col5a2. Overall, the gene expression changes upon Pu.1 overexpression revealed characteristics of ARC (Fig. 4d), establishing that Pu.1 is a driving factor behind the development of ARC.
Figure 4. The Role of Pu.1 in generation and function of ARC.
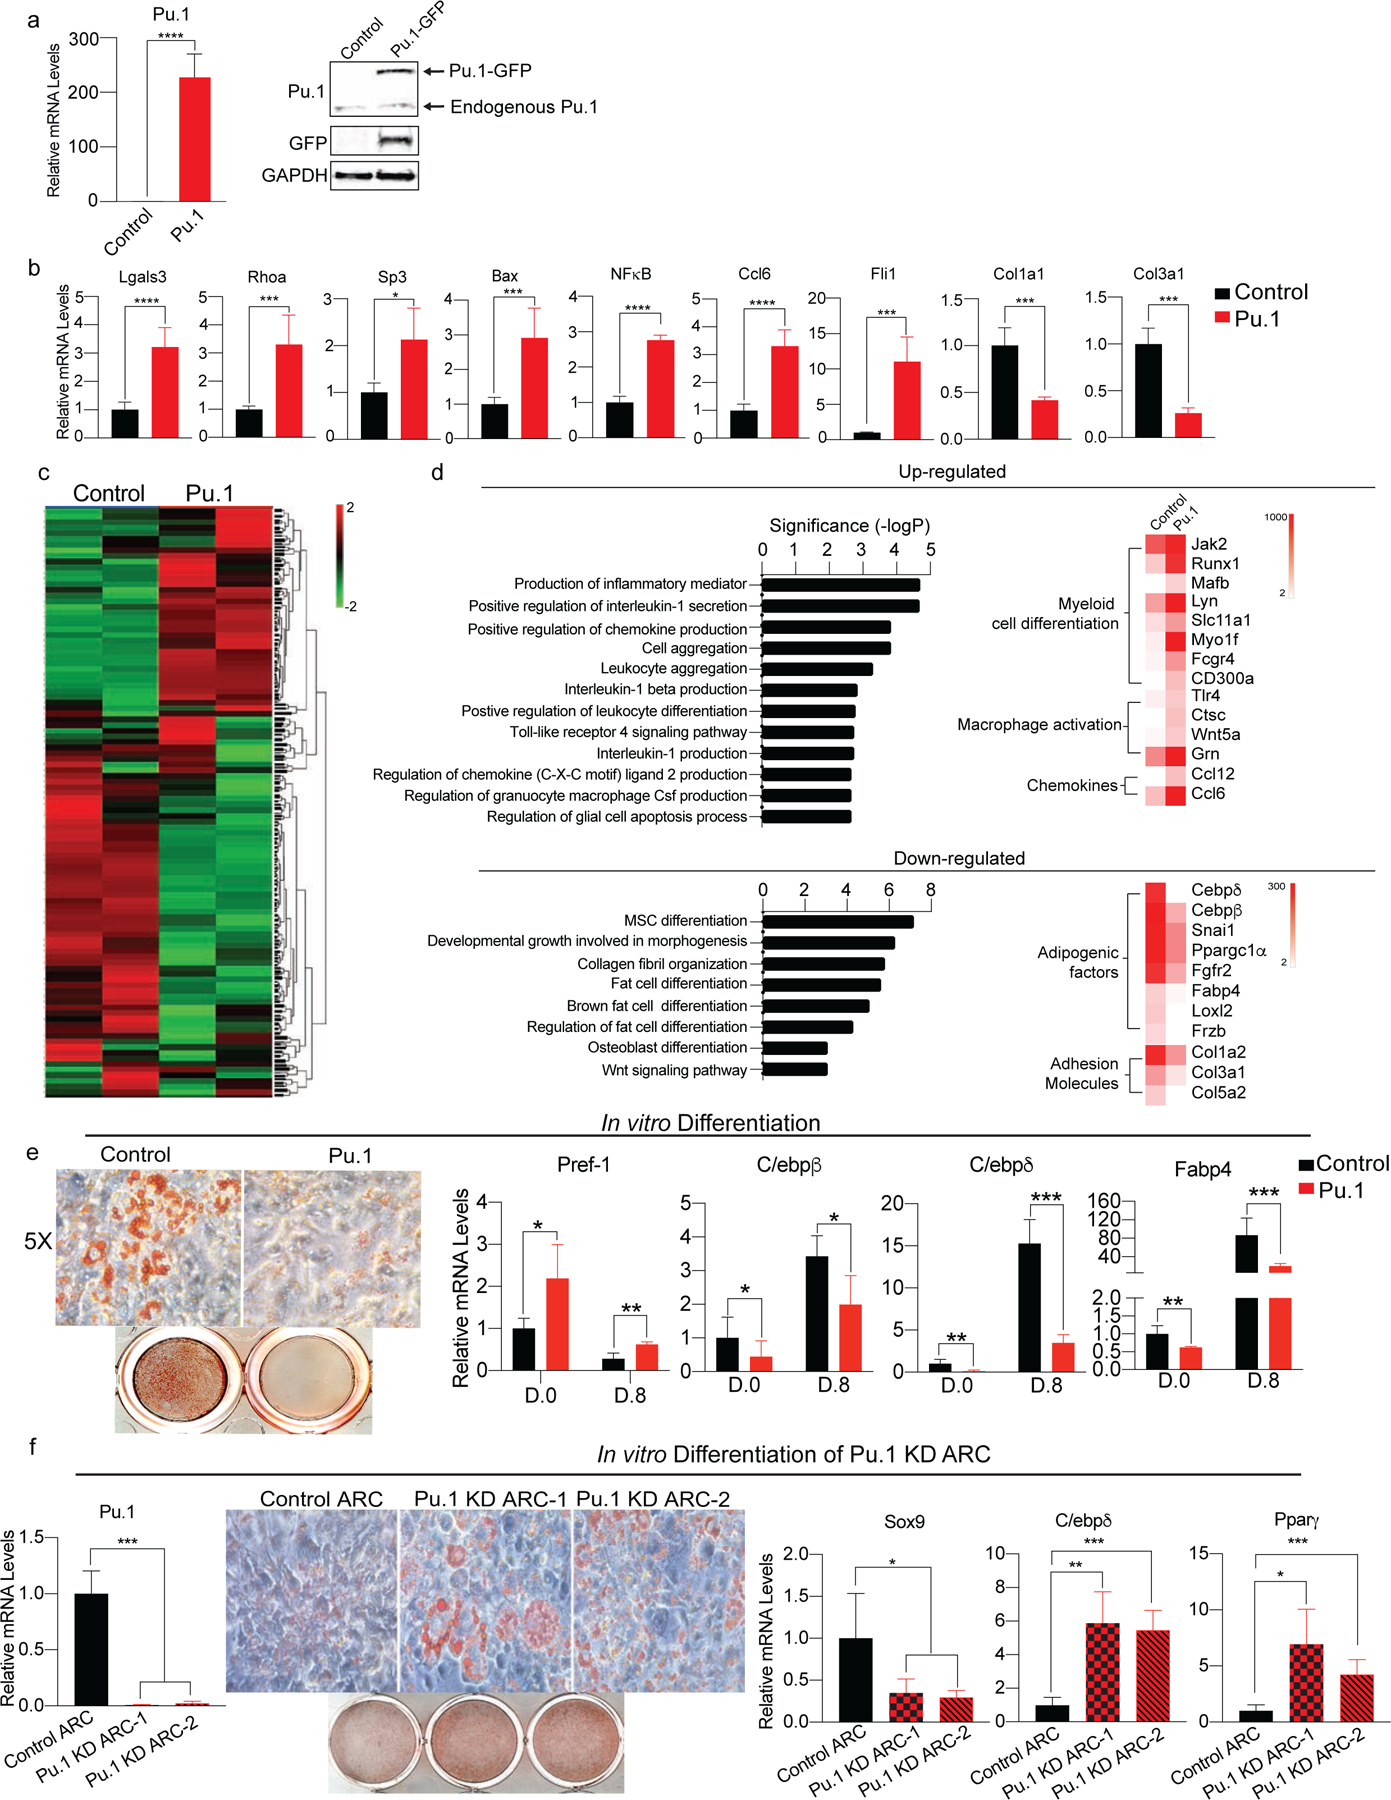
(a) Pu.1 was overexpressed in 3T3-L1 cells. (Left) RT-qPCR for Pu.1, (Right) immunoblotting for Pu.1 and GFP (n=6–8).
(b) RT-qPCR for genes enriched in ARC such as Lgals3, Rhoa, Sp3, Bax, NFκB1, Ccl2, Ccl5, and Fli1 as well as collagen genes decreased in ARC such as Col1a1, Col1a2, and Col3a1 (n=6).
(c) RNA-seq of Pu.1 overexpressing 3T3-L1 cells. Heatmap of global gene expression profile (n=3).
(d) (Top) Upregulated pathways and representative genes. (Bottom) Downregulated pathways and representative genes.
(e) In vitro adipocyte differentiation of Pu.1 overexpressing 3T3-L1 cells. (Left) Oil Red O staining, (Right) RT-qPCR for Pref-1, C/ebpβ, C/ebpδ, and Fabp4 (n=6).
(f) In vitro adipocyte differentiation of Pu.1 KD ARC. (Left) RT-qPCR for Pu.1 in control ARC and Pu.1 KD ARC. (Right) Oil Red O staining and RT-qPCR for Sox9, C/ebpδ, and Pparγ (n=4–8).
Data are represented as mean ± S.D. *≤0.05, **≤0.01, ***≤0.001. See also figure S4.
Since ARC had impairment in adipocyte differentiation (Fig. 2f), we next tested whether 3T3-L1 cells upon Pu.1 overexpression can undergo adipocyte differentiation. Remarkably, unlike control 3T3-L1 cells, Pu.1 overexpressing cells did not adhere to culture plates (Data not shown), reflecting their decreased expression of adhesion proteins. We therefore tested the differentiation capacity of Pu.1 overexpressing cells on collagen-coated plates. Oil Red O staining showeed lower lipid accumulation in Pu.1 overexpressing cells subjected to differentiation protocol. Pref-1 mRNA level was higher by 4-fold, while expression of adipogenic genes, such as C/ebpδ, Pparγ, and Fabp4, were lower in Pu.1-overexpressing cells than control cells, indicating impaired adipocyte differentiation (Fig. 4e). Taken together, Pu.1 is a critical driver for ARC phenotype.
To examine whether Pu.1 is involved in the development of ARC, we performed Pu.1 KD in FACS-sorted ARC using two different Pu.1 shRNA lentivirus. By RT-qPCR, we detected approximately 90% reduction in Pu.1 expression level in both Pu.1 shRNA. After adipocyte differentiation, both Pu.1 shRNA lentivirus treated ARC showed higher lipid accumulation compared to control shRNA treated ARC. Pu.1 KD cells had 2-fold decrease in Sox9 levels and more than 4-fold increase in adipogenic markers, such as C/ebpδ, and Pparγ compared to control ARC (Fig. 4f). Overall, these data clearly demonstrate that Pu.1 is critical for the development of ARC during aging.
Pu.1 is Critical for ARC Function in Inhibiting Adipogenesis of Neighboring Cells
We next tested whether Pu.1 is required for ARC inhibitory effect on neighboring cells, we cultured 3T3-L1 cells in conditioned media of control ARC and Pu.1 KD FACS-sorted ARC. After subjecting these cells to adipocyte differentiation protocol, cells cultured in conditioned media of Pu.1 KD ARC had higher levels of lipid accumulation than cells in control ARC. RT-qPCR also showed, even at day 0, 3T3-L1 cells in media of Pu.1 KD ARC had lower levels of Sox9 and higher levels of C/ebpβ, Pparγ, and Fabp4 than control cells. At day 8, cells in media of Pu.1 KD ARC showed approximately 3-fold lower of Sox9 levels and 4-fold higher than cells cultured in control ARC (Fig. 5a). These results further demonstrate that Pu.1 is critical for ARC function in inhibiting adipogenesis of neighboring cells.
Figure 5. Pu.1 stably expressing cells are differentiation-defective and inhibit adipogenesis of nearby preadipocytes in vivo.
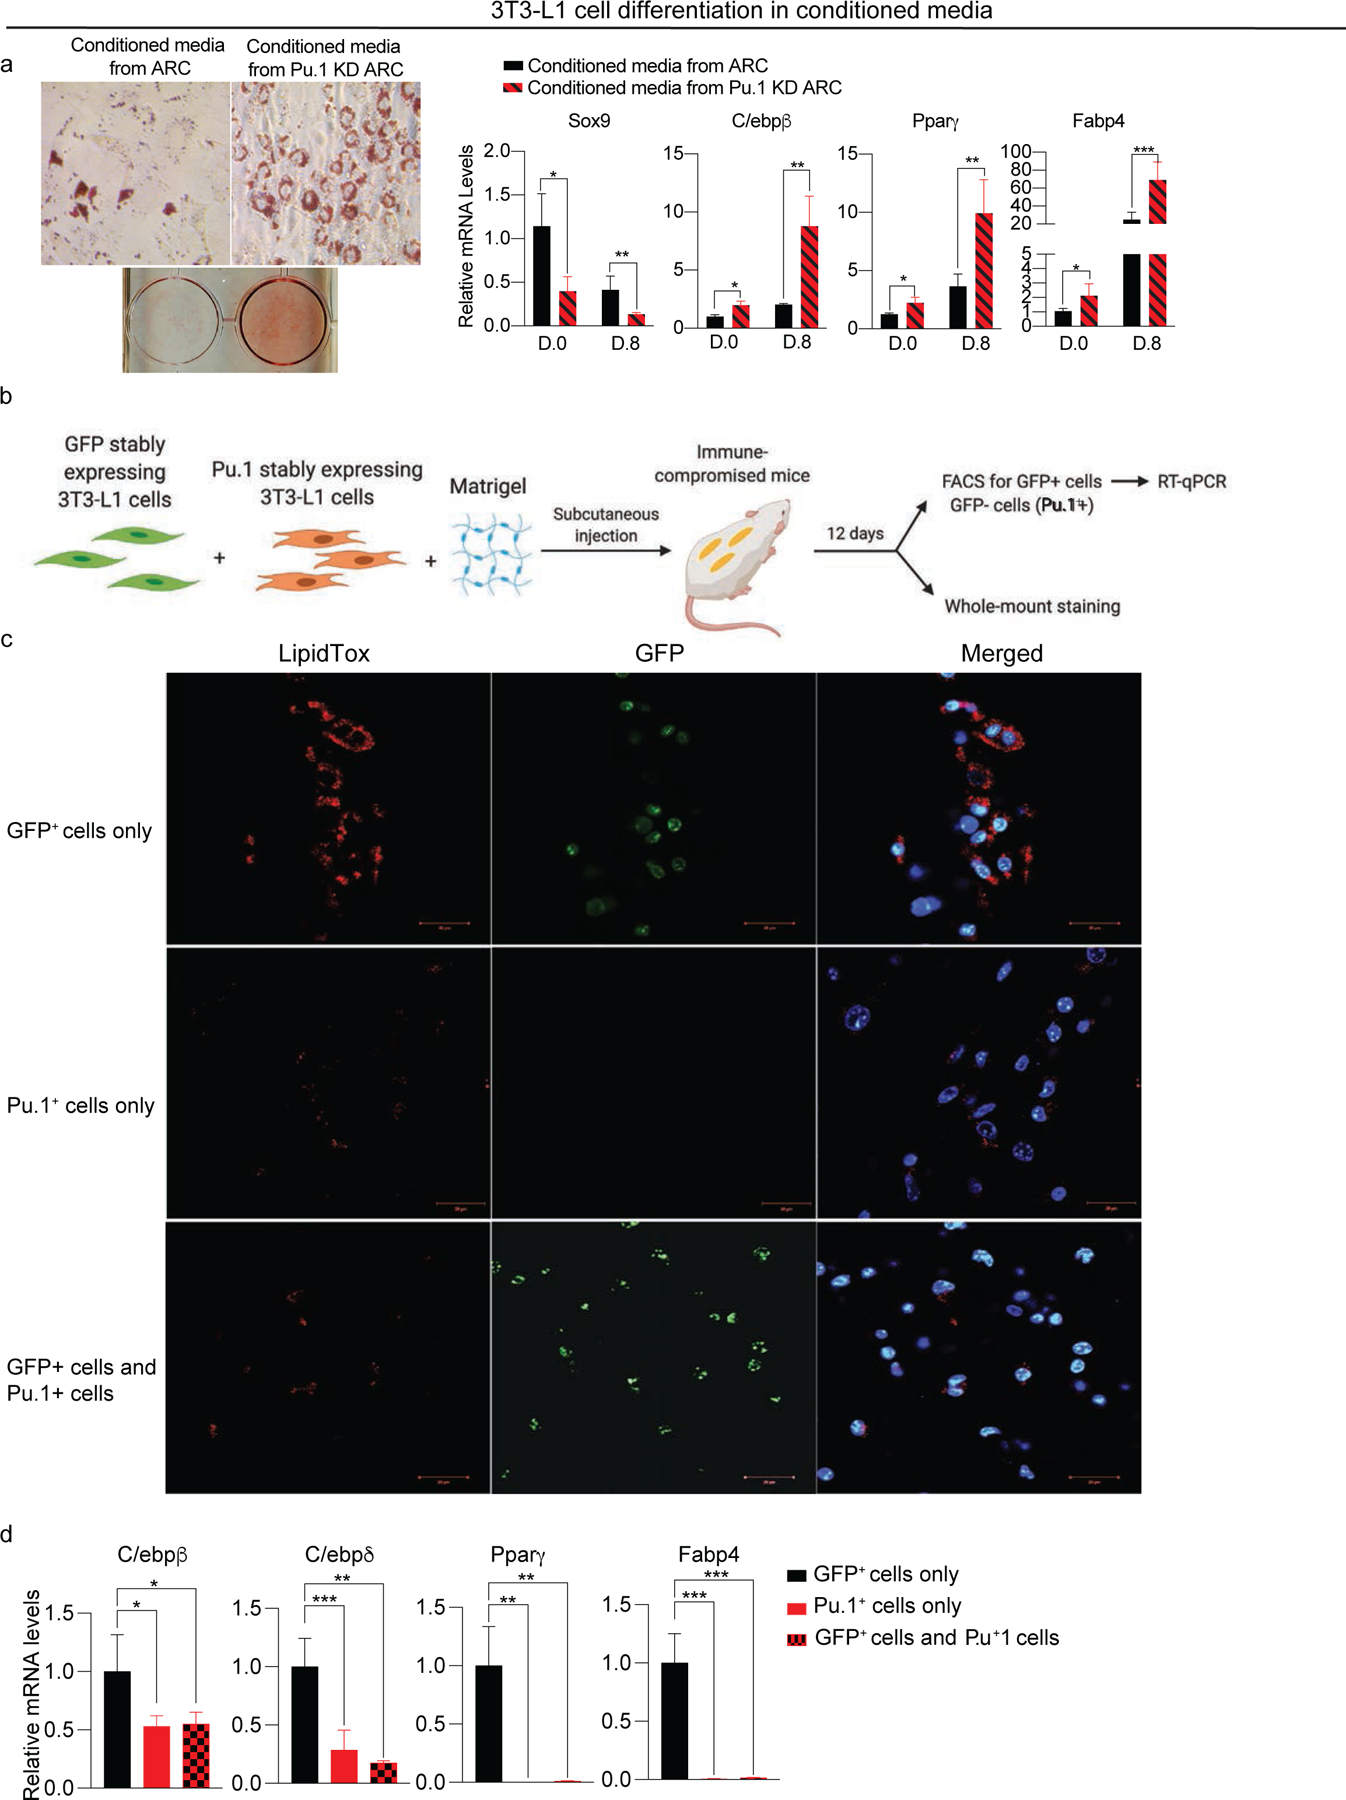
(a) Adipocyte differentiation of 3T3-L1 cells cultured in conditioned media from ARC or Pu.1 KD ARC. (Left) Oil Red O staining, (Right) RT-qPCR for Sox9, C/ebpβ, Pparγ, and Fabp4 (n=6).
(b) Schematic of the implantation experiment (n=4).
(c) Whole-mount staining of implants with LipidTox (Red), DAPI (blue) and GFP (Green).
(d) RT-qPCR for C/ebpβ, C/ebpδ, Pparγ, and Fabp4 (n=8).
Data are represented as mean ± S.D. *≤0.05, **≤0.01, ***≤0.001.
To further examine whether Pu.1 is critical for inhibitory effect of ARC on neighboring cells, we performed in vivo implantation experiments. We first generated 3T3-L1 cells stably overexpressing Pu.1 by transducing Pu.1 lentivirus followed by antibiotic selection. Cells stably expressing Pu.1 not only showed high level of Pu.1 but also increased levels of Lgals3, Tnfα, Ccl6, and Fli1 and decreased expression of adhesion proteins, such as Col1a1 and Col5a1 (Fig. S4). Thus, these 3T3-L1 cells stably expressing Pu.1 showed similar gene expression pattern to 3T3-L1 cells transiently expressing Pu.1 in Figure 4. Next, the GFP expressing 3T3-L1 cells mixed with either Pu.1 expressing 3T3-L1 cells or Pu.1 expressing cell. They then mixed with Matrigel and subcutaneously injected into immune-compromised SCID mice. After 12 days, the implants were collected for immunofluorescence and for RT-qPCR after FACS (Fig. 5b). For whole-mount staining, the implants were treated similarly to adipose pads using the same methods as in Figure S2 in which the implants were flattened for Z-def reduction for staining with LipidTox or DAPI prior to imaging. The control GFP+ 3T3-L1 cells formed substantial number of adipocytes with lipid staining. In contrast, Pu.1 overexpressing 3T3-L1 cells formed cells with significantly lower lipid staining indicating resistance to adipogenesis. More importantly, when GFP+ 3T3-L1 cells were implanted along with Pu.1 stably expressing cells, the GFP+ cells formed cells with much lower lipid staining than when GFP+ cells alone were implanted (Fig. 5c). RT-qPCR also showed greatly lower levels of adipogenic genes, such as C/ebpβ, C/ebpδ, Pparγ, and Fabp4 in cells formed upon injection of Pu.1 expressing cells or 3T-L1 cells co-injected with Pu.1 overexpressing cells, compared to cells formed from injection of control 3T3-L1 cells alone (Fig. 5d). These results clearly demonstrate that ectopic expression of Pu.1 not only inhibits adipogenesis but also impairs adipocyte differentiation of neighboring preadipocytes in vivo. Overall, we conclude that Pu.1 is the critical factor for ARC’s development and that ARC can inhibit differentiation of neighboring adipose precursors.
DISCUSSION
Identification of Adipose Precursor Populations and their Specific Markers
Several groups have attempted to characterize the adipose progenitor populations found in non-immune stromal cells of adipose tissue by scRNA-seq analysis. All adipose progenitor populations have been characterized to express surface markers, including Pdgfrα, CD29 (Itgb1), CD34, and Sca-1 (Ly6a) in mice (Burl et al., 2018; Hepler et al., 2018; Merrick et al., 2019). In general, previous studies have identified three different progenitor populations; ASC1a, an adipogenic precursors derived from ASC2 which are mesenchymal-like progenitor cells, and ASC1b, also known as Aregs, which is highly enriched in SAT of mice, but of which its effect on differentiation of adipose precursors is still in debate (Schwalie et al., 2018). We detected the three populations of adipose lineage cells that were previously reported. Moreover, our scRNA-seq of total SVF cells without elimination of Lin+ cells revealed, not only 3 additional adipose precursor populations, but also new and highly specific markers for each subpopulation.
We found CD121a and Pi15 to mark all adipose precursors, including MSCs and APCs. Our first population, MSC, corresponds to the ASC2 population characterized by several groups as a mesenchymal progenitor population that is less committed to the adipose lineage (Rondini and Granneman, 2020). This population is enriched of mesenchymal progenitor markers, such as Fn1 and CD55, while lacking adipocyte markers. While our MSCs are overall analogous with MSCs characterized by other researchers, there are certain discrepancies. This cluster to be highly marked with Gpr1, which has been reported to modulate neural stem cell proliferation. We also did not detect Dpp4, previously reported by Merrick et al. to be enriched in this population. Our second population, APC, is enriched with preadipocyte markers, Pref-1 and Pdgfrα, corresponding to the ASC1a population of committed and adipogenic precursor cells. Merrick et al. reported that this population arises from Dpp4+ progenitors but lost expression of Dpp4 to acquire Icam1 (Merrick et al., 2019). They also reported that Icam1+ cells are marked by Pref-1 and could then acquire CD142. We did not detect high levels of Icam1 in our APC population. Instead, we observed increasing expression of Icam1 as cells commit to preadipocytes and further undergo early differentiation. The third subpopulation that we termed CD142high APC is similar to the ASC1b population. Our CD142high APCs are highly marked with Ramp1 and Aox3. Previously, this population was reported to be enriched in VAT than SAT, being refractory to adipogenesis but exerting an inhibitory effect on the differentiation of other APCs, and thus, termed ‘Aregs’ (Schwalie et al., 2018). However, this population was characterized by Merrick et al. to be adipogenic and to exert no anti-adipogenic effects (Merrick et al., 2019). Indeed, similar to Merrick et al, our CD142high APC population exhibits high levels of adipogenic markers and can differentiate to adipocytes (Fig. S2f). And our CD142-high-APC does not highly express anti-adipogenic genes, such as Dkk3, Meox2, and Spink1 shown by Schwalie et al and they do not possess anti-adipogenic effect on neighboring cells (Fig. S3b).
Importantly, we also identified three additional adipose lineage populations, a preadipocyte, an early adipocyte, and adipogenic Fmod+ fibroblast (AFF) populations, in addition to the three previously reported populations as described above. Our preadipocytes are derived from APCs and is highly enriched in early adipogenic transcription factors, such as C/ebpβ and C/ebpδ, compared to other adipose progenitors. These cells highly express CD38, a preadipocyte marker identified recently in mice by Carriere et al. (Carriere et al., 2017). Our early adipocytes are distinguished from our preadipocyte population by the high expression of terminal adipocyte differentiation genes, such as Fabp4 and ATGL (Villena et al., 2004). Lastly, AFF, a previously unidentified population of fibroblast-like cells, is detected in our scRNA-seq. AFF in general are distinctive stroma cells with high collagen secretion for tissue remodeling and wound healing. In our study, the AFF population showed moderate expression of C/ebpβ, as well as adipogenic potential, and thus, we named ‘Adipogenic Fmod+ Fibroblasts’ (AFF). While both preadipocytes and AFFs to be enriched in Fgf1 (Fibroblast growth factor 1), only AFFs express Fmod (Fibromodulin), Col18a1, and Igfbp2 (Insulin growth factor binding protein 2), clearly distinguishing AFFs from preadipocytes. Interestingly, AFF population is a SAT-specific population, since we did not detect this population in VAT by scRNA-seq (Data not shown). Overall, these newly identified markers could provide additional tools to study specific adipose precursor subpopulations in the future.
Our detection of these additional precursor populations may have resulted from the use of total SVF without FACS. In fact, previous reports of scRNA-seq in identifying adipose precursor cells utilized SVF that were depleted of Lin+ populations or cells expressing certain specific markers, which may have missed the heterogeneity within cell populations. For example, in our total SVF analysis by scRNA-seq, we found expression of CD81 in all cell populations including both Lin− and Lin+ cells, although CD81 was recently reported to mark beige precursors in mice(Oguri et al., 2020). FACS to eliminate Lin+ cells may also have depleted populations that were low but still positive for certain lineage markers. For example, unlike our APC population, the preadipocyte population expresses low levels of CD31, a marker for endothelial cells (Fig. 1b). Apart from the different methods employed, specific adipose depot and age of mice employed could explain the differences in population characteristics. In fact, we studied SAT from adult mice, whereas Merrick et al. used SAT from developing mice at P12. The Dpp4+ MSC population characterized by Merrick may represent an earlier developmental precursor population compared to our MSC population, suggesting a potential loss of Dpp4 during developmental maturation (Merrick et al., 2019). We did not detect the inflammatory MSC population characterized by Hepler et al., which may be specific to VAT after HFD feeding (Hepler et al., 2018).
Decrease in Adipose Precursor Populations and their Impaired Differentiation Capacity in Aging
During aging, there is major changes in WAT, through loss of SAT from the limbs and gain of VAT around the abdominal and trunk areas in both mice (Cartwright et al., 2007) and human (Raguso et al., 2006; Rabkin, 2007; Kuk et al., 2009). The chronic positive energy intake may partly contribute to increase in VAT. Besides, altered characteristics of adipose tissue, such as the number of adipose progenitors and their capacity for proliferation and adipogenesis may also be factors (Karagiannides et al., 2001; Xu et al., 2002; Unger, 2002; Zhu et al., 2007; Schipper et al., 2008). In fact, a previous study characterizing total Lin− cells of SVF as adipose precursors of human SAT suggested lower proliferation and differentiation, of those from aged compared to young patients (Caso et al., 2013). Others, by using CD34+ cells from abdominal and subcutaneous fat, reported a 2-fold lower rate of proliferation of those from aged and old compared to young patients (Alt et al., 2012). However, likely due to limited technology, these studies did not consider the heterogeneity of adipose precursor populations. Our scRNA-seq allowed us to capture the entire landscape of SVF of adipose tissue and to detect distinctive populations, providing understanding of the aging-associated changes in these cell populations. We found that, in SAT, there is a significant aging-dependent decrease in the cell numbers of MSCs, as well as adipose lineage populations, including APCs, preadipocytes, and AFFs. Moreover, MSCs in aged mice remain quiescent, resisting proliferation, and all adipose progenitors and preadipocytes from aged mice demonstrated to have lower proliferative and differentiative capacity. Thus, the decrease in MSCs and adipose linage cell populations may lead to a decrease in newly forming adipocytes during aging, contributing to aging-associated loss of SAT.
Emergence of ARC in Aging and their Effects on Neighboring Adipose Precursors
Most importantly, comparison of scRNA-seq of SVF from SAT of mice during aging allowed us to discover a population of adipose precursors only present in SAT of old, but not young mice. Interestingly, this population is subcutaneous-specific, and undetectable in visceral fat even of aged mice (Data not shown). We named this population “Aging-dependent Regulatory Cells” (ARC). ARC are distinct from various other cell types in SVF, such as preadipocytes and macrophages, which are known to secrete cytokines that affect adipogenesis and adipocyte function during HFD feeding (Lumeng et al., 2007a) or obesity (Trayhurn and Wood, 2004; Hotamisligil et al., 1993). ARC emerge and increase only in SAT of aged mice, but not in young mice on HFD. ARC are not senescent stem cells that acquire alterations in their secretome to be enriched in pro-inflammatory cytokines, referred as Senescence-Associated Secretory Phenotype (SASP) (Coppe et al., 2008; Kuilman et al., 2010; Rodier and Campisi, 2011). Moreover, ARC do not express several known senescence factors, such as p53, p21, and Bmi1, although express high level of NFkB which is also known to be involved in inflammation. Regardless, in contrast to senescent stem cells, ARC show no senescence phenotype and are capable of rapid proliferation (Fig. 2h). We propose that ARC is a newly identified population whose emergence is aging-dependent and might contribute to aging-associated loss of subcutaneous fat.
The Role of Pu.1 in Generation and Function of ARC
Pu.1, which belongs to E-twenty-six (ETS) family, is known as a master transcription factor for the leukocyte differentiation program and is most prominent in myeloid cells for the development and maturation of B cells, macrophages, and neutrophils in mice (Scott et al., 1997; DeKoter and Singh, 2000; Dahl et al., 2003; Dahl and Simon, 2003; Lawrence and Natoli, 2011). Recent studies have shown that Pu.1 increases Mac-1 expression in fibroblasts to induce a macrophage-like phenotype in fibroblast cell lines and primary embryonic and adult fibroblasts (Feng et al., 2008). Interestingly, we observed increased Pu.1 expression in the ARC. Pu.1 overexpression in preadipocytes indeed allow these cells to acquire a more proinflammatory phenotype. Ectopic expression of Pu.1 also inhibits preadipocyte differentiation, potentially by restraining C/ebpβ expression in mice (Wang and Tong, 2008). Interestingly, Lazar and coworkers showed that even in terminally differentiated adipocytes, as a master regulator, PU.1 can remodel the cistrome of master regulator of adipogenesis, PPARγ, dampening Pparγ binding at 75% of the adipocyte binding regions in mice (Dispirito et al., 2013). In our study, upon Pu.1 overexpression, we detected a decrease in expression of adipogenic transcription factors, such as C/ebpβ, C/ebpδ, and Pparγ. ChIP-seq database indicates Pu.1 binding site at the promoter regions of various genes, including inflammatory cytokines, such as Ccl2 and Ccl6 and collagens, such as Col14a1, as well as those genes regulating adipogenesis, such as Pparγ, C/ebpβ, Tgfβ1, and Tnfα. Remarkably, not only overexpression of Pu.1 in preadipocytes generates ARC-like cells with impaired adipogenesis, but these cells also inhibit adipogenesis of neighboring cells. Further examination of how Pu.1 is induced early during aging might uncover the underlying molecular details of aging-related loss of SAT. Overall, we propose that Pu.1 contributes to emergence of ARC during aging, increasing inflammatory gene expression and chemokine secretion that, in turn, can inhibit the proliferation and differentiation of neighboring adipose precursor populations.
In contrast to expansion of VAT, SAT is known to decline with age and this decline in SAT contributes to metabolic dysregulation in human (Mancuso and Bouchard, 2019). Here, we propose that the loss of SAT accompanies the decline in adipose progenitor number and function. More importantly, ARC emerges in SAT only during aging and thus the emergence of ARC is correlated with the decrease in SAT, not only are ARC defective in adipogenesis, but they can also inhibit differentiation of neighboring bona fide adipose precursor population by secreting chemokines, such as Ccl6.
LIMITATIONS OF THE STUDY
Our results clearly show that Pu.1 is a critical driver for ARC development and phenotype in SAT during aging. However, other transcription factors, that are detected to be highly expressed in ARC compared to other population in SVF, might also affect the emergence of ARC.
Lead contact
Further information and requests for resources and reagents should be directed to and will be fulfilled by the Lead Contact, Hei SookSul (hsul@berkeley.edu). All plasmids generated in this study will be made available on request, but we may require a payment and/or a completed Materials Transfer Agreement if there is potential for commercial application.
Material availability
This study did not generate new unique reagents, mouse line, and plasmids.
Data and code availability
The scRNA-seq data generated during this study are available at ArrayExpression of EMBL-EBI: E-MTAB-1022.
Experimental model and subject details
All animal studies were carried out in accordance with UC Berkeley ACUC and OLAC regulations. Mice were housed in a 12:12 light-dark cycle, and chow and water were provided ad libitum. Only adult male mice were used for single-cell RNA sequencing. Specific age of mice used is indicated in figure legends.
Method Details
Cell Culture
Adipocyte differentiation of 3T3-L1 cells was performed as previously described (Wang and Sul, 2009). Cells were then harvested for RNA isolation or fixed with paraformaldehyde for Oil Red O (ORO) staining. For Pu.1 overexpression experiment, sub-confluent 3T3-L1 cells were transfected with Pu.1-GFP tagged plasmid using Lipofectamine LTX. After 48 hrs, GFP+ cells were then isolated using FACS, expanded as a pool and used for RT-qPCR and ORO in differentiation experiment.
For the co-culture experiment, ARC, isolated using FACS, were irradiated as described in (Lee et al., 2010). After ARC were washed with cold PBS, they were overlaid with PBS. The cells were then irradiated using a Vilber-Lourmat UV table centered on 365 nm for one hour. Irradiated cells were then mixed with 3T3-L1 cells and subjected to adipocyte differentiation together.
Implantation of 3T3-L1 cells were performed as described in (12). Cells (1×10⁶) suspended in 50 ul of cold media were mixed with 200ul Matrigel (Corning). The mixture was then injected subcutaneously into SCID mice. The implants were then collected after 12. Cells were recovered by Cell Recovery Solution (Corning) and were subjected for mRNA isolation and RT-qPCR. The implants were also subjected for whole-mount staining protocol described below.
FACS-isolated ARC cells were sorted into DMEM media supplemented with 10%FBS and then plated into collagen-coated tissue culture plates. And cells were transduced withPu.1 shRNA lentivirus (MOI=100) and then selected by antibiotics.
EdU incorporation
EdU was injected subcutaneously at 10 ug/g of body weight and EdU incorporation into SVF cells from SAT was assessed by FACS 3 days later according to manufacturer’s protocol.
Separation of SVF
SVF fractionation was carried out as previously described (Nguyen et al., 2020). Subcutaneous mouse adipose tissue depots were dissected from 10 wk-old, 48 wk-old, and 72 wk-old wild-type C57BL/6J mice into ice-cold PBS. The tissue was finely minced using scissors and digested with Collagenase type II in 3% BSA-HBSS buffer at 37°C for 45 min with gentle shaking. The cell suspension was then passed through 100μm cell strainer and spun at 500g for 5 min. The cell pellet was resuspended in HBSS buffer and passed through 70μm and 40μm cell strainers to ensure a single cell preparation. The cells were spun at 500g for 5 min to pellet, and the red blood cells in the pellet were then lysed by incubating the pelleted cells in red blood cell lysis buffer on ice for 5 min with shaking. The remaining cells were washed twice with HBSS and spun at 500g for 5 min to pellet. The pelleted cells were resuspended in PBS or complete media. Cells were then stained with desired antibodies, and subjected to FACS or scRNA-seq.
Single-Cell RNA Sequencing
SVF were isolated from 10, 48, or 72 wk-old wild-type mice fed with normal chow diet and 13 wk-old wild-type mice fed with HFD for 8 wks. We performed scRNA-seq three times. For each scRNA-seq, 2 mice from each age group were used to submit for sequencing. Red blood cells were removed from SVF fraction with a red blood cell lysis, and the cells were suspended in PBS (without CaCl2 or MgCl2) before submission for scRNA-seq. The scRNA-seq experiment was carried out by DNA Technology and Expression Analysis core at Genome Center at UC Davis. It was performed using the Chromium Single Cell Gene Expression Solution from 10x Genomics on default parameters and the mouse NCBI38/mm10 genome. The cells were loaded onto a GemCode instrument to generate single-cell barcoded droplets in emulsion (GEMs), and single-cell RNA-seq libraries were obtained following the 10x Genomics protocol using regents included in the Chromium Single Cell 3’ v2 Reagent Kit. The resulting libraries were sequenced on an Illumina HiSeq 2500 instrument with the HiSeq rapid sequencing by synthesis (SBS) kit.
FASTQ files containing 100-bp-long single-end sequenced tags (reads) from each sample were trimmed and filtered. Since we utilized the Partek Documentation Analysis, which has built-in method to eliminate ambient RNA and empty droplets. We used the cell barcode QA/QC task report that is a knee plot with EmptyDrop. The resulting reads were aligned, and gene-level unique molecular identifier (UMI) counts were obtained by using Partek Flow. Partek Flow was then used for analysis of the sequencing. The number of tags per gene was calculated, and cells that appeared as doublets or those that had <30% aligned reads were excluded, which resulted in approximately 6000–8000 cells, with 125,000–350,000 mean reads/cell and 800–1,404 median genes detected per cell. Ambient RNA was removed using built-in empty drop removal method in Partek Flow. Gene expression from these cells was used to obtain a 2D representation of the stromal vascular cell population using the t-stochastic neighboring embedding method (t-SNE). Cluster analysis was performed on differentially expressed genes, and top 200–400 genes expressed in each cluster was used for cell type identification. Differentially expressed genes (DEGs) were used to identify each cluster, and two-way ANOVA with Bonferroni test was utilized for multiple comparisons to calculate statistical significance of upregulated genes and pathways. We used known cell-type specific markers curated from literature and previous studies in SVF and from Immgen (Immgen.org)
RNA isolation and RT-qPCR
Total RNA from sorted cells or cultured cells was extracted using RNeasy Mini Kit. Reverse transcription was performed with 1μg of total RNA using Superscript III or with 100ng RNA from sorted cells using SuperScript VILO cDNA Synthesis Kit. qRT-PCR was performed on CFX96 Touch Real-Time PCR Detection System (BioRad) using Sybr Green. Statistical analysis was performed using ddct method with U36B4 or 18S rRNA primers as control (see primer sequences in Table S1.) Gene expression assays show mean values over n=4–6 biological replicates.
FACS
SVF cells were incubated with indicated antibody for 20 min in the dark, washed, spun at 300g for 5 min, resuspended in PBS and passed through a 40μm filter prior to FACS analysis. FACS was performed on ARIA Fusion Cell Sorter. Cells were initially chosen based on forward and side scatter (FFS, and CCS). Cells that were not incubated with antibody were used as a control to determine background fluorescence levels. Different cell types were stained with different antibodies (see Table S2). Cells were collected in PBS for RNA isolation or in DMEM+20% FBS for cell culture.
Whole-mount immunofluorescence
iWAT from young and aged mice was dissected and flattened for Z-def reduction. The flattened tissues were blocked in 3% BSA-PBST for 4 hrs before incubation with Lgals3, CD36, or both overnight at 4°C. The images were captured using confocal microscopy.
Statistical Analysis
Statistical analysis was performed using two tailed t-test. The error bars represent standard deviation (SD). Data are expressed as mean ± SD and p-value<0.05 was considered statistically significant. Number of mice or replicates used in each experiment was indicated in figure legends. Experiments were repeated at least three times.
Supplementary Material
KEY RESOURCES TABLE
| REAGENT or RESOURCE | SOURCE | IDENTIFIER |
|---|---|---|
| Antibodies | ||
| FITC anti-mouse CD45 antibody | BioLegend | AB_312972 |
| CD31 Monoclonal Antibody (390), FITC | Thermo Fisher | AB_10373983 |
| FITC anti-mouse TER-119/Erythroid Cells antibody | BioLegend | AB_313707 |
| PE anti-mouse/human Mac-2 (Galectin-3) antibody | BioLegend | AB_1134012 |
| Alexa Fluor(R) 647 anti-mouse CD36 antibody | BioLegend | AB_528794 |
| APC anti-mouse CD38 antibody | BioLegend | AB_312933 |
| PE anti-mouse CD140a antibody | BioLegend | AB_1953269 |
| Mouse Coagulation Factor III/TF Phycoerythrin Aff Pur PAb antibody | R&D Systems | AB_11130032 |
| PU.1 Antibody | Cell Signaling Technology | AB_10692379 |
| Anti-GFP antibody | Abcam | AB_298911 |
| Rabbit Anti-GAPDH Monoclonal Antibody | Cell Signaling Technology | AB_561053 |
| Biological Samples | ||
| Human Flash Frozen Subcutaneous Adipose Tissue | Zen-Bio | Cat#T-SQFX-FF |
| Chemicals, Peptides, and Recombinant Proteins | ||
| Recombinant Mouse CCL6/C10 Protein | R&D Systems | Cat#487-C-050/CF |
| Critical Commercial Assays | ||
| MTT assay kit | Abeam | Cat#ab211091 |
| Click-iT™ EdU Alexa Fluor™ 488 Flow Cytometry Assay Kit | Thermo Fisher | Cat#C10420 |
| Experimental Models: Cell Lines | ||
| 3T3-L1 cells | ATCC | Cat#ATCC CL-173 |
| Oligonucleotides | ||
| See Table S1 for primer sequences | ||
| Recombinant DNA | ||
| Spi1 Mouse Tagged ORF Clone | Origene | Cat#MG203632 |
| Software and Algorithms | ||
| Partek Flow Genomic Analysis Software | Partek | N/A |
Highlights:
Aging-dependent Regulatory Cells (ARC) emerge only in subcutaneous fat during aging
ARCs secrete pro-inflammatory chemokines and are resistant to adipogenesis
ARCs inhibit differentiation and proliferation of neighboring adipogenic precursors
Pu.1 is a driving factor for development and phenotype of ARCs
ACKNOWLEDGEMENTS
The work was supported in part by NIH DK123843 to H.S.S. Imaging was supported in part by NIH S10RR026866-01. The content is solely the responsibility of the authors and does not necessarily represent the official views of the NIH.
Footnotes
Publisher's Disclaimer: This is a PDF file of an unedited manuscript that has been accepted for publication. As a service to our customers we are providing this early version of the manuscript. The manuscript will undergo copyediting, typesetting, and review of the resulting proof before it is published in its final form. Please note that during the production process errors may be discovered which could affect the content, and all legal disclaimers that apply to the journal pertain.
DECLERATION OF INTERESTS
The authors declare no competing interests.
REFERENCES
- ALT EU, SENST C, MURTHY SN, SLAKEY DP, DUPIN CL, CHAFFIN AE, KADOWITZ PJ & IZADPANAH R 2012. Aging alters tissue resident mesenchymal stem cell properties. Stem Cell Res, 8, 215–25. [DOI] [PubMed] [Google Scholar]
- ARNER P 1995. Differences in lipolysis between human subcutaneous and omental adipose tissues. Ann Med, 27, 435–8. [DOI] [PubMed] [Google Scholar]
- ASANO Y, MARKIEWICZ M, KUBO M, SZALAI G, WATSON DK & TROJANOWSKA M 2009. Transcription factor Fli1 regulates collagen fibrillogenesis in mouse skin. Mol Cell Biol, 29, 425–34. [DOI] [PMC free article] [PubMed] [Google Scholar]
- BANERJEE SS, FEINBERG MW, WATANABE M, GRAY S, HASPEL RL, DENKINGER DJ, KAWAHARA R, HAUNER H & JAIN MK 2003. The Kruppel-like factor KLF2 inhibits peroxisome proliferator-activated receptor-gamma expression and adipogenesis. J Biol Chem, 278, 2581–4. [DOI] [PubMed] [Google Scholar]
- BERRY DC, JIANG Y & GRAFF JM 2016. Emerging Roles of Adipose Progenitor Cells in Tissue Development, Homeostasis, Expansion and Thermogenesis. Trends Endocrinol Metab, 27, 574–585. [DOI] [PMC free article] [PubMed] [Google Scholar]
- BERRY R & RODEHEFFER MS 2013. Characterization of the adipocyte cellular lineage in vivo. Nat Cell Biol, 15, 302–8. [DOI] [PMC free article] [PubMed] [Google Scholar]
- BRANDTZAEG P 1983. Immunohistochemical characterization of intracellular J-chain and binding site for secretory component (SC) in human immunoglobulin (Ig)-producing cells. Mol Immunol, 20, 941–66. [DOI] [PubMed] [Google Scholar]
- BURL RB, RAMSEYER VD, RONDINI EA, PIQUE-REGI R, LEE YH & GRANNEMAN JG 2018. Deconstructing Adipogenesis Induced by beta3-Adrenergic Receptor Activation with Single-Cell Expression Profiling. Cell Metab, 28, 300–309 e4. [DOI] [PMC free article] [PubMed] [Google Scholar]
- CAI L, WANG Z, JI A, MEYER JM & VAN DER WESTHUYZEN DR 2012. Scavenger receptor CD36 expression contributes to adipose tissue inflammation and cell death in diet-induced obesity. PLoS One, 7, e36785. [DOI] [PMC free article] [PubMed] [Google Scholar]
- CARRIERE A, JEANSON Y, COTE JA, DROMARD C, GALINIER A, MENZEL S, BARREAU C, DUPUIS-CORONAS S, ARNAUD E, GIROUSSE A, CUMINETTI V, PAUPERT J, COUSIN B, SENGENES C, KOCH-NOLTE F, TCHERNOF A & CASTEILLA L 2017. Identification of the ectoenzyme CD38 as a marker of committed preadipocytes. Int J Obes (Lond), 41, 1539–1546. [DOI] [PubMed] [Google Scholar]
- CARTWRIGHT MJ, TCHKONIA T & KIRKLAND JL 2007. Aging in adipocytes: potential impact of inherent, depot-specific mechanisms. Exp Gerontol, 42, 463–71. [DOI] [PMC free article] [PubMed] [Google Scholar]
- CASO G, MCNURLAN MA, MILEVA I, ZEMLYAK A, MYNARCIK DC & GELATO MC 2013. Peripheral fat loss and decline in adipogenesis in older humans. Metabolism, 62, 337–40. [DOI] [PMC free article] [PubMed] [Google Scholar]
- CHEN CH, FLOYD H, OLSON NE, MAGALETTI D, LI C, DRAVES K & CLARK EA 2006. Dendritic-cell-associated C-type lectin 2 (DCAL-2) alters dendritic-cell maturation and cytokine production. Blood, 107, 1459–67. [DOI] [PMC free article] [PubMed] [Google Scholar]
- CHO KW, MORRIS DL & LUMENG CN 2014. Flow cytometry analyses of adipose tissue macrophages. Methods Enzymol, 537, 297–314. [DOI] [PMC free article] [PubMed] [Google Scholar]
- CHOI HR, KIM WK, KIM EY, HAN BS, MIN JK, CHI SW, PARK SG, BAE KH & LEE SC 2013. Dual-specificity phosphatase 10 controls brown adipocyte differentiation by modulating the phosphorylation of p38 mitogen-activated protein kinase. PLoS One, 8, e72340. [DOI] [PMC free article] [PubMed] [Google Scholar]
- COPPE JP, PATIL CK, RODIER F, SUN Y, MUNOZ DP, GOLDSTEIN J, NELSON PS, DESPREZ PY & CAMPISI J 2008. Senescence-associated secretory phenotypes reveal cell-nonautonomous functions of oncogenic RAS and the p53 tumor suppressor. PLoS Biol, 6, 2853–68. [DOI] [PMC free article] [PubMed] [Google Scholar]
- DAHL R & SIMON MC 2003. The importance of PU.1 concentration in hematopoietic lineage commitment and maturation. Blood Cells Mol Dis, 31, 229–33. [DOI] [PubMed] [Google Scholar]
- DAHL R, WALSH JC, LANCKI D, LASLO P, IYER SR, SINGH H & SIMON MC 2003. Regulation of macrophage and neutrophil cell fates by the PU.1:C/EBPalpha ratio and granulocyte colony-stimulating factor. Nat Immunol, 4, 1029–36. [DOI] [PubMed] [Google Scholar]
- DAI J, MA M, FENG Z & PASTOR-PAREJA JC 2017. Inter-adipocyte Adhesion and Signaling by Collagen IV Intercellular Concentrations in Drosophila. Curr Biol, 27, 2729–2740 e4. [DOI] [PubMed] [Google Scholar]
- DEKOTER RP & SINGH H 2000. Regulation of B lymphocyte and macrophage development by graded expression of PU.1. Science, 288, 1439–41. [DOI] [PubMed] [Google Scholar]
- DISPIRITO JR, FANG B, WANG F & LAZAR MA 2013. Pruning of the adipocyte peroxisome proliferator-activated receptor gamma cistrome by hematopoietic master regulator PU.1. Mol Cell Biol, 33, 3354–64. [DOI] [PMC free article] [PubMed] [Google Scholar]
- EBERLEIN J, DAVENPORT B, NGUYEN TT, VICTORINO F, JHUN K, VAN DER HEIDE V, KULESHOV M, MA’AYAN A, KEDL R & HOMANN D 2020. Chemokine Signatures of Pathogen-Specific T Cells I: Effector T Cells. J Immunol, 205, 2169–2187. [DOI] [PMC free article] [PubMed] [Google Scholar]
- FENG R, DESBORDES SC, XIE H, TILLO ES, PIXLEY F, STANLEY ER & GRAF T 2008. PU.1 and C/EBPalpha/beta convert fibroblasts into macrophage-like cells. Proc Natl Acad Sci U S A, 105, 6057–62. [DOI] [PMC free article] [PubMed] [Google Scholar]
- GREGOIRE FM, SMAS CM & SUL HS 1998. Understanding adipocyte differentiation. Physiol Rev, 78, 783–809. [DOI] [PubMed] [Google Scholar]
- GULYAEVA O, NGUYEN H, SAMBEAT A, HEYDARI K & SUL HS 2018. Sox9-Meis1 Inactivation Is Required for Adipogenesis, Advancing Pref-1(+) to PDGFRalpha(+) Cells. Cell Rep, 25, 1002–1017 e4. [DOI] [PMC free article] [PubMed] [Google Scholar]
- HEPLER C, SHAN B, ZHANG Q, HENRY GH, SHAO M, VISHVANATH L, GHABEN AL, MOBLEY AB, STRAND D, HON GC & GUPTA RK 2018. Identification of functionally distinct fibro-inflammatory and adipogenic stromal subpopulations in visceral adipose tissue of adult mice. Elife, 7. [DOI] [PMC free article] [PubMed] [Google Scholar]
- HOTAMISLIGIL GS, SHARGILL NS & SPIEGELMAN BM 1993. Adipose expression of tumor necrosis factor-alpha: direct role in obesity-linked insulin resistance. Science, 259, 87–91. [DOI] [PubMed] [Google Scholar]
- HUDAK CS, GULYAEVA O, WANG Y, PARK SM, LEE L, KANG C & SUL HS 2014. Pref-1 marks very early mesenchymal precursors required for adipose tissue development and expansion. Cell Rep, 8, 678–87. [DOI] [PMC free article] [PubMed] [Google Scholar]
- HUDAK CS & SUL HS 2013. Pref-1, a gatekeeper of adipogenesis. Front Endocrinol (Lausanne), 4, 79. [DOI] [PMC free article] [PubMed] [Google Scholar]
- IBRAHIM MM 2010. Subcutaneous and visceral adipose tissue: structural and functional differences. Obes Rev, 11, 11–8. [DOI] [PubMed] [Google Scholar]
- JEFFERY E, CHURCH CD, HOLTRUP B, COLMAN L & RODEHEFFER MS 2015. Rapid depot-specific activation of adipocyte precursor cells at the onset of obesity. Nat Cell Biol, 17, 376–85. [DOI] [PMC free article] [PubMed] [Google Scholar]
- JIANG Y, BERRY DC, JO A, TANG W, ARPKE RW, KYBA M & GRAFF JM 2017. A PPARgamma transcriptional cascade directs adipose progenitor cell-niche interaction and niche expansion. Nat Commun, 8, 15926. [DOI] [PMC free article] [PubMed] [Google Scholar]
- JIANG Y, BERRY DC, TANG W & GRAFF JM 2014. Independent stem cell lineages regulate adipose organogenesis and adipose homeostasis. Cell Rep, 9, 1007–22. [DOI] [PMC free article] [PubMed] [Google Scholar]
- KABIR SM, LEE ES & SON DS 2014. Chemokine network during adipogenesis in 3T3-L1 cells: Differential response between growth and proinflammatory factor in preadipocytes vs. adipocytes. Adipocyte, 3, 97–106. [DOI] [PMC free article] [PubMed] [Google Scholar]
- KARAGIANNIDES I, TCHKONIA T, DOBSON DE, STEPPAN CM, CUMMINS P, CHAN G, SALVATORI K, HADZOPOULOU-CLADARAS M & KIRKLAND JL 2001. Altered expression of C/EBP family members results in decreased adipogenesis with aging. Am J Physiol Regul Integr Comp Physiol, 280, R1772–80. [DOI] [PubMed] [Google Scholar]
- KAWAMURA Y, TANAKA Y, KAWAMORI R & MAEDA S 2006. Overexpression of Kruppel-like factor 7 regulates adipocytokine gene expressions in human adipocytes and inhibits glucose-induced insulin secretion in pancreatic beta-cell line. Mol Endocrinol, 20, 844–56. [DOI] [PubMed] [Google Scholar]
- KIRKLAND JL & DOBSON DE 1997. Preadipocyte function and aging: links between age-related changes in cell dynamics and altered fat tissue function. J Am Geriatr Soc, 45, 959–67. [DOI] [PubMed] [Google Scholar]
- KIRKLAND JL, TCHKONIA T, PIRTSKHALAVA T, HAN J & KARAGIANNIDES I 2002. Adipogenesis and aging: does aging make fat go MAD? Exp Gerontol, 37, 757–67. [DOI] [PubMed] [Google Scholar]
- KRAUS M, PAO LI, REICHLIN A, HU Y, CANONO B, CAMBIER JC, NUSSENZWEIG MC & RAJEWSKY K 2001. Interference with immunoglobulin (Ig)alpha immunoreceptor tyrosine-based activation motif (ITAM) phosphorylation modulates or blocks B cell development, depending on the availability of an Igbeta cytoplasmic tail. J Exp Med, 194, 455–69. [DOI] [PMC free article] [PubMed] [Google Scholar]
- KUILMAN T, MICHALOGLOU C, MOOI WJ & PEEPER DS 2010. The essence of senescence. Genes Dev, 24, 2463–79. [DOI] [PMC free article] [PubMed] [Google Scholar]
- KUK JL, SAUNDERS TJ, DAVIDSON LE & ROSS R 2009. Age-related changes in total and regional fat distribution. Ageing Res Rev, 8, 339–48. [DOI] [PubMed] [Google Scholar]
- KUSUYAMA J, KOMORIZONO A, BANDOW K, OHNISHI T & MATSUGUCHI T 2016. CXCL3 positively regulates adipogenic differentiation. J Lipid Res, 57, 1806–1820. [DOI] [PMC free article] [PubMed] [Google Scholar]
- LAU SK, CHU PG & WEISS LM 2004. CD163: a specific marker of macrophages in paraffin-embedded tissue samples. Am J Clin Pathol, 122, 794–801. [DOI] [PubMed] [Google Scholar]
- LAWRENCE T & NATOLI G 2011. Transcriptional regulation of macrophage polarization: enabling diversity with identity. Nat Rev Immunol, 11, 750–61. [DOI] [PubMed] [Google Scholar]
- LEE J, LEE J, JUNG E, KIM YS, ROH K, JUNG KH & PARK D 2010. Ultraviolet A regulates adipogenic differentiation of human adipose tissue-derived mesenchymal stem cells via up-regulation of Kruppel-like factor 2. J Biol Chem, 285, 32647–56. [DOI] [PMC free article] [PubMed] [Google Scholar]
- LEE K, VILLENA JA, MOON YS, KIM KH, LEE S, KANG C & SUL HS 2003. Inhibition of adipogenesis and development of glucose intolerance by soluble preadipocyte factor-1 (Pref-1). J Clin Invest, 111, 453–61. [DOI] [PMC free article] [PubMed] [Google Scholar]
- LEE YH, PETKOVA AP & GRANNEMAN JG 2013. Identification of an adipogenic niche for adipose tissue remodeling and restoration. Cell Metab, 18, 355–67. [DOI] [PMC free article] [PubMed] [Google Scholar]
- LUMENG CN, BODZIN JL & SALTIEL AR 2007a. Obesity induces a phenotypic switch in adipose tissue macrophage polarization. J Clin Invest, 117, 175–84. [DOI] [PMC free article] [PubMed] [Google Scholar]
- LUMENG CN, DEYOUNG SM, BODZIN JL & SALTIEL AR 2007b. Increased inflammatory properties of adipose tissue macrophages recruited during diet-induced obesity. Diabetes, 56, 16–23. [DOI] [PubMed] [Google Scholar]
- MANCUSO P & BOUCHARD B 2019. The Impact of Aging on Adipose Function and Adipokine Synthesis. Front Endocrinol (Lausanne), 10, 137. [DOI] [PMC free article] [PubMed] [Google Scholar]
- MARANGONI RG, KORMAN BD, WEI J, WOOD TA, GRAHAM LV, WHITFIELD ML, SCHERER PE, TOURTELLOTTE WG & VARGA J 2015. Myofibroblasts in murine cutaneous fibrosis originate from adiponectin-positive intradermal progenitors. Arthritis Rheumatol, 67, 1062–73. [DOI] [PMC free article] [PubMed] [Google Scholar]
- MERRICK D, SAKERS A, IRGEBAY Z, OKADA C, CALVERT C, MORLEY MP, PERCEC I & SEALE P 2019. Identification of a mesenchymal progenitor cell hierarchy in adipose tissue. Science, 364. [DOI] [PMC free article] [PubMed] [Google Scholar]
- MOLDES M, LASNIER F, FEVE B, PAIRAULT J & DJIAN P 1997. Id3 prevents differentiation of preadipose cells. Mol Cell Biol, 17, 1796–804. [DOI] [PMC free article] [PubMed] [Google Scholar]
- NGUYEN HP, YI D, LIN F, VISCARRA JA, TABUCHI C, NGO K, SHIN G, LEE AY, WANG Y & SUL HS 2020. Aifm2, a NADH Oxidase, Supports Robust Glycolysis and Is Required for Cold- and Diet-Induced Thermogenesis. Mol Cell, 77, 600–617 e4. [DOI] [PMC free article] [PubMed] [Google Scholar]
- OGURI Y, SHINODA K, KIM H, ALBA DL, BOLUS WR, WANG Q, BROWN Z, PRADHAN RN, TAJIMA K, YONESHIRO T, IKEDA K, CHEN Y, CHEANG RT, TSUJINO K, KIM CR, GREINER VJ, DATTA R, YANG CD, ATABAI K, MCMANUS MT, KOLIWAD SK, SPIEGELMAN BM & KAJIMURA S 2020. CD81 Controls Beige Fat Progenitor Cell Growth and Energy Balance via FAK Signaling. Cell. [DOI] [PMC free article] [PubMed] [Google Scholar]
- PAPASPYRIDONOS M, MCNEILL E, DE BONO JP, SMITH A, BURNAND KG, CHANNON KM & GREAVES DR 2008. Galectin-3 is an amplifier of inflammation in atherosclerotic plaque progression through macrophage activation and monocyte chemoattraction. Arterioscler Thromb Vasc Biol, 28, 433–40. [DOI] [PubMed] [Google Scholar]
- PERRY E, TSRUYA R, LEVITSKY P, POMP O, TALLER M, WEISBERG S, PARRIS W, KULKARNI S, MALOVANI H, PAWSON T, SHPUNGIN S & NIR U 2004. TMF/ARA160 is a BC-box-containing protein that mediates the degradation of Stat3. Oncogene, 23, 8908–19. [DOI] [PubMed] [Google Scholar]
- PLIKUS MV, GUERRERO-JUAREZ CF, ITO M, LI YR, DEDHIA PH, ZHENG Y, SHAO M, GAY DL, RAMOS R, HSI TC, OH JW, WANG X, RAMIREZ A, KONOPELSKI SE, ELZEIN A, WANG A, SUPAPANNACHART RJ, LEE HL, LIM CH, NACE A, GUO A, TREFFEISEN E, ANDL T, RAMIREZ RN, MURAD R, OFFERMANNS S, METZGER D, CHAMBON P, WIDGEROW AD, TUAN TL, MORTAZAVI A, GUPTA RK, HAMILTON BA, MILLAR SE, SEALE P, PEAR WS, LAZAR MA & COTSARELIS G 2017. Regeneration of fat cells from myofibroblasts during wound healing. Science, 355, 748–752. [DOI] [PMC free article] [PubMed] [Google Scholar]
- RABKIN SW 2007. Epicardial fat: properties, function and relationship to obesity. Obes Rev, 8, 253–61. [DOI] [PubMed] [Google Scholar]
- RAGUSO CA, KYLE U, KOSSOVSKY MP, ROYNETTE C, PAOLONI-GIACOBINO A, HANS D, GENTON L & PICHARD C 2006. A 3-year longitudinal study on body composition changes in the elderly: role of physical exercise. Clin Nutr, 25, 573–80. [DOI] [PubMed] [Google Scholar]
- RODEHEFFER MS, BIRSOY K & FRIEDMAN JM 2008. Identification of white adipocyte progenitor cells in vivo. Cell, 135, 240–9. [DOI] [PubMed] [Google Scholar]
- RODIER F & CAMPISI J 2011. Four faces of cellular senescence. J Cell Biol, 192, 547–56. [DOI] [PMC free article] [PubMed] [Google Scholar]
- RONDINI EA & GRANNEMAN JG 2020. Single cell approaches to address adipose tissue stromal cell heterogeneity. Biochem J, 477, 583–600. [DOI] [PMC free article] [PubMed] [Google Scholar]
- SCHIPPER BM, MARRA KG, ZHANG W, DONNENBERG AD & RUBIN JP 2008. Regional anatomic and age effects on cell function of human adipose-derived stem cells. Ann Plast Surg, 60, 538–44. [DOI] [PMC free article] [PubMed] [Google Scholar]
- SCHWALIE PC, DONG H, ZACHARA M, RUSSEIL J, ALPERN D, AKCHICHE N, CAPRARA C, SUN W, SCHLAUDRAFF KU, SOLDATI G, WOLFRUM C & DEPLANCKE B 2018. A stromal cell population that inhibits adipogenesis in mammalian fat depots. Nature, 559, 103–108. [DOI] [PubMed] [Google Scholar]
- SCOTT EW, FISHER RC, OLSON MC, KEHRLI EW, SIMON MC & SINGH H 1997. PU.1 functions in a cell-autonomous manner to control the differentiation of multipotential lymphoid-myeloid progenitors. Immunity, 6, 437–47. [DOI] [PubMed] [Google Scholar]
- SEU L, TIDWELL C, TIMARES L, DUVERGER A, WAGNER FH, GOEPFERT PA, WESTFALL AO, SABBAJ S & KUTSCH O 2017. CD151 Expression Is Associated with a Hyperproliferative T Cell Phenotype. J Immunol, 199, 3336–3347. [DOI] [PMC free article] [PubMed] [Google Scholar]
- SMAS CM & SUL HS 1993. Pref-1, a protein containing EGF-like repeats, inhibits adipocyte differentiation. Cell, 73, 725–34. [DOI] [PubMed] [Google Scholar]
- SPALDING KL, ARNER E, WESTERMARK PO, BERNARD S, BUCHHOLZ BA, BERGMANN O, BLOMQVIST L, HOFFSTEDT J, NASLUND E, BRITTON T, CONCHA H, HASSAN M, RYDEN M, FRISEN J & ARNER P 2008. Dynamics of fat cell turnover in humans. Nature, 453, 783–7. [DOI] [PubMed] [Google Scholar]
- TCHKONIA T, MORBECK DE, VON ZGLINICKI T, VAN DEURSEN J, LUSTGARTEN J, SCRABLE H, KHOSLA S, JENSEN MD & KIRKLAND JL 2010. Fat tissue, aging, and cellular senescence. Aging Cell, 9, 667–84. [DOI] [PMC free article] [PubMed] [Google Scholar]
- TOURNIAIRE F, ROMIER-CROUZET B, LEE JH, MARCOTORCHINO J, GOURANTON E, SALLES J, MALEZET C, ASTIER J, DARMON P, BLOUIN E, WALRAND S, YE J & LANDRIER JF 2013. Chemokine Expression in Inflamed Adipose Tissue Is Mainly Mediated by NF-kappaB. PLoS One, 8, e66515. [DOI] [PMC free article] [PubMed] [Google Scholar]
- TRAYHURN P & WOOD IS 2004. Adipokines: inflammation and the pleiotropic role of white adipose tissue. Br J Nutr, 92, 347–55. [DOI] [PubMed] [Google Scholar]
- UNGER RH 2002. Lipotoxic diseases. Annu Rev Med, 53, 319–36. [DOI] [PubMed] [Google Scholar]
- VAN DEN BERG RH, FABER-KROL MC, VAN DE KLUNDERT JA, VAN ES LA & DAHA MR 1996. Inhibition of the hemolytic activity of the first component of complement C1 by an Escherichia coli C1q binding protein. J Immunol, 156, 4466–73. [PubMed] [Google Scholar]
- VAN MOURIK JA, LEEKSMA OC, REINDERS JH, DE GROOT PG & ZANDBERGEN-SPAARGAREN J 1985. Vascular endothelial cells synthesize a plasma membrane protein indistinguishable from the platelet membrane glycoprotein IIa. J Biol Chem, 260, 11300–6. [PubMed] [Google Scholar]
- VILLENA JA, ROY S, SARKADI-NAGY E, KIM KH & SUL HS 2004. Desnutrin, an adipocyte gene encoding a novel patatin domain-containing protein, is induced by fasting and glucocorticoids: ectopic expression of desnutrin increases triglyceride hydrolysis. J Biol Chem, 279, 47066–75. [DOI] [PubMed] [Google Scholar]
- WANG F & TONG Q 2008. Transcription factor PU.1 is expressed in white adipose and inhibits adipocyte differentiation. Am J Physiol Cell Physiol, 295, C213–20. [DOI] [PubMed] [Google Scholar]
- WANG QA, TAO C, GUPTA RK & SCHERER PE 2013. Tracking adipogenesis during white adipose tissue development, expansion and regeneration. Nat Med, 19, 1338–44. [DOI] [PMC free article] [PubMed] [Google Scholar]
- WANG Y & SUL HS 2009. Pref-1 regulates mesenchymal cell commitment and differentiation through Sox9. Cell Metab, 9, 287–302. [DOI] [PMC free article] [PubMed] [Google Scholar]
- WOLLINA U, WETZKER R, ABDEL-NASER MB & KRUGLIKOV IL 2017. Role of adipose tissue in facial aging. Clin Interv Aging, 12, 2069–2076. [DOI] [PMC free article] [PubMed] [Google Scholar]
- XU H, UYSAL KT, BECHERER JD, ARNER P & HOTAMISLIGIL GS 2002. Altered tumor necrosis factor-alpha (TNF-alpha) processing in adipocytes and increased expression of transmembrane TNF-alpha in obesity. Diabetes, 51, 1876–83. [DOI] [PubMed] [Google Scholar]
- XUE R, LYNES MD, DREYFUSS JM, SHAMSI F, SCHULZ TJ, ZHANG H, HUANG TL, TOWNSEND KL, LI Y, TAKAHASHI H, WEINER LS, WHITE AP, LYNES MS, RUBIN LL, GOODYEAR LJ, CYPESS AM & TSENG YH 2015. Clonal analyses and gene profiling identify genetic biomarkers of the thermogenic potential of human brown and white preadipocytes. Nat Med, 21, 760–8. [DOI] [PMC free article] [PubMed] [Google Scholar]
- ZHU M, LEE GD, DING L, HU J, QIU G, DE CABO R, BERNIER M, INGRAM DK & ZOU S 2007. Adipogenic signaling in rat white adipose tissue: modulation by aging and calorie restriction. Exp Gerontol, 42, 733–44. [DOI] [PMC free article] [PubMed] [Google Scholar]
Associated Data
This section collects any data citations, data availability statements, or supplementary materials included in this article.
Supplementary Materials
Data Availability Statement
The scRNA-seq data generated during this study are available at ArrayExpression of EMBL-EBI: E-MTAB-1022.