

Abstract
Initial cases of COVID-19 trace back to the end of 2019 which has laid foundations for the extensive spread of the disease risking lives worldwide. In response to the global coronavirus pandemic, early diagnosis of the disease is vital to prevent the virus from being spread to a larger population. Because of the unavailability of precise diagnostic toolkits, there arises a crying need to find efficient techniques that can be implemented for faster disease prediction while ensuring the accuracy of the prediction. Artificial intelligence (AI)–based solutions have the potential to help diagnose COVID-19 pandemic in an effective way. Automated image analysis with AI techniques can support clinical decision-making, improve workflow efficiency, and allow accurate and fast diagnosis of infection in a large number of patients. In the present study, existing convolutional neural network (CNN) models such as ResNeXt, Channel Boosted CNN, DenseNet, AlexNet, and VGG 16 were repurposed to assist in identifying the presence of COVID-19 before they reach mass scale. The dataset used in the study comprises of computed tomography (CT) images taken from 275 healthy individuals and 195 COVID-19 samples collected from 216 affected individuals. The proposed AI-based approach using deep learning models classifies COVID-19 affected cases by analyzing CT images and provides rapid detection of COVID-19 in a shorter time span. Ensemble classifier employed in this study proved to predict the presence of infection with a greater accuracy of 90.67% compared to the other similar works in the literature.
Keywords: COVID-19, Deep CNN, Disease diagnosis, Ensemble classification, Image processing, Transfer learning
1. Introduction
Coronavirus-19 (COVID-19) problem was first discovered on December 31, 2019 in Wuhan state of China. COVID-19 originated from a virus named severe acute respiratory syndrome coronavirus 2 (SARS-CoV-2). Coronavirus represents a family of viruses that cause diseases resulting in cough, shortness of breath, and fever such as Middle East Respiratory Syndrome (MERS-CoV) and severe acute respiratory syndrome (SARS-CoV). Human coronavirus is classified into four main categories namely alpha, beta, gamma, and delta. Coronavirus was first spotted in 1960 [1]. Coronavirus that infects people include 229E (alpha), NL63 (alpha), OC43 (beta), and HKU1 (beta). Some coronavirus infects animals first and then transmits to human beings. Coronavirus (COVID-19) is a new virus that was discovered in 2019 and has not been previously identified in humans [2]. On January 13, 2020, COVID-19 was first identified in Thailand after being discovered in China. After that, COVID-19 has spread to all the parts of the globe. The World Health Organization (WHO) announced the COVID-19 outburst as a Public Health Emergency of International Concern on January 30, 2020. COVID-19 was then identified as an epidemic by WHO on March 11, 2020.
Milder symptoms of COVID-19 are seen in 82% of infected cases, while others are severe or dangerous. More than 2.7 million cases of COVID-19 were confirmed worldwide as on April 24, 2020. Approximately 95% of the infected persons can survive the disease, while the remaining 5% of the persons have a serious condition [3].
Common infection signs of COVID-19 include shortness of breath, fever, cough, and dyspnea. Complications could also embody respiratory illness, acute metabolic process distress syndrome, and even death in critical cases [4]. The hatching period of COVID-19 usually revolves around 2 weeks or longer. Throughout the period of latent infection, the disease is still dangerous. It has been found that old age people are more infected with the disease while there are no deaths observed in children at the age of 0–10. It has also been found that people with COVID-19 infection suffer from smell disorders and high-respiratory rates [5]. COVID-19 spreads from people to people through close contact via the droplets produced by the infected persons during cough, sneeze, or even talking. People get infection by touching a contaminated surface, and then touching their eyes, nose, or even mouth [6]. The virus can get by on surfaces for as long as 72 h. It is more pandemic during the first 3 days after the start of symptoms, though unfolding is also potential before symptoms are seen and in later stages of the sickness. As of now, no drug or treatment has been found for COVID-19 [7]. The health system of people has collapsed in many developed countries because of the increasing requirements of intensive care units. The worldwide distribution of COVID-19 cases from February 1, 2020–April 6, 2020 is shown in Fig. 7.1 .
Figure 7.1.

Worldwide distribution of COVID-19 for the period February 1, 2020 to April 6, 2020.
The researchers found that 2019-nCoV is likely related to bat SARS-like coronaviruses, from which SARS-CoV developed and more likely correlated to MERS coronaviruses. At the start of the occurrence, solely MERS-CoV and SARS-CoV were found to be routinely capable of spreading severe infection. It's now found that COVID-19, the pandemic disease arising from most SARS-CoV-2 infections is typically quite acute.
The SARS-CoV outbreak started in China in 2002 and spread to all parts of the world markedly to Toronto, Canada [8]. The WHO announced 8437 SARS cases and 813 deaths from November 2002 to July 2003. At the end of 2003, no cases of SARS were found. SARS-CoV is disseminated from one person to another through respiratory droplets and close contact. The evolution period of SARS-CoV was usually four days which may lie in the range 1–13 days [9]. Common symptoms of SARS were fever, cold, and shortness of breath. The death rate of SARS-CoV risk was estimated to be around 10%.
MERS-CoV is a respiratory infection caused by a virus named MERS coronavirus which was first reported in 2012 in Saudi Arabia. Most people who suffer from MERS-CoV have severe respiratory problems in addition to the following symptoms namely cold, fever, vomit, diarrhea, and shortness of breath. As of now, nearly 2400 cases of MERS-CoV have been reported in Middle East countries [10]. MERS-CoV does not spread easily from person to person unless there is a close contact between them. In 2015, there was a significant outbreak of MERS-CoV in South Korea because of the arrival of MERS-CoV infected persons from other countries. The evolution period of SARS-CoV was usually five days which may lie in the range of 1–15 days. The death rate of SARS-CoV risk was estimated to be around 15% [11].
Diagnosis of COVID-19 has been started since the emergence of the virus. Nucleic acid–based testing was initially followed in many countries, although there are no proper results. The identification of COVID-19 ought to be confirmed by gene sequencing for respiratory samples as a key measure for reverse transcription polymerase chain reaction (RT-PCR). As RT-PCR has low sensitivity, it is very difficult to identify the COVID-19 patients and may not receive any correct treatment. Also, there is a higher chance of infection of COVID-19 for larger populations because of their infectious nature. Hence it is proposed to rely on data processing for identifying the COVID-19 patients.
Data processing plays a major role in the process of identification and diagnosis of various diseases. Data processing involves collection and conversion of data into useful information. It is usually performed by a team of experts who are well versed in processing of raw data. Because of the crucial spread of COVID-19, a massive amount of data is generated every day, which can be used to track spreading pattern of the disease, number of people affected, recovered, death cases, and many such information can be obtained using data processing techniques.
Statistical methods are mainly used to analyze and interpret the numeric data. The proper selection of statistical methods plays a major role in the data analysis process as the wrong selection may lead to inaccurate results. Researchers must possess knowledge on various statistical methods and their use and also the problem domain to apply the correct statistical methods to get highly accurate results [15].
Gaussian distribution theory was used to build a model for transmission of coronavirus. The proposed model stimulated the COVID-19 propagation process and the output curves matched with the official output curve published by China. The work also explained the various causes for transmission of coronavirus and its life cycle. It also helped to forecast the evolution trend of coronavirus across various parts of the world [3].
In today's scenario, Artificial Intelligence (AI) plays a huge role in health care sectors. The benchmarking applications of AI in healthcare include early detection, disease diagnosis, predicting risk factors of a disease, and AI-assisted medical imaging systems. During the global outbreak, when clinicians and biomedical scientists were busy finding ways to stop the pandemic spread, AI researchers had started their research toward diagnosis and prevention of COVID-19, as an initiative to fight against the coronavirus. Various machine learning techniques and deep learning models are applied on the available datasets to predict the presence of COVID-19 and identify the risk factors of coronavirus [27,28].
Initially a set of researchers had succeeded in working with case statistics collected from hospitals and had shown good results in predicting COVID-19. But when it comes to image processing, there are some challenges in predicting the disease because of the nature of data. Therefore the proposed system is designed to implement deep learning architecture for COVID-19 image datasets and overcome the drawbacks of the existing learning systems.
1.1. Problem statement
As an initiative to the global outbreak, it is intended to identify a suitable deep learning classification model for coronavirus identification through data processing. The data chosen for the proposed approach are CT image samples of the affected cases. With the image data as input, the model performs a classification task and identifies whether the given sample is affected with coronavirus.
1.2. Objective
Owing to the adverse consequences of the global outbreak, as an initiative toward the preventive measures for COVID-19, it is proposed to implement Deep CNN-based image classification model for COVID-19 detection. The various image datasets available for COVID-19 diagnosis contains X-ray images and CT images of affected and healthy individuals. The proposed model makes use of CT image dataset, as they offer greater performance when compared to the use of X-ray images in COVID-19 image classification. The outcomes of various deep learning techniques used by the researchers imply that it is viable to identify and remove radiological features for error-free coronavirus identification. The proposed system utilizes the ensemble classification to make best use of the results obtained from various models on the same dataset. This ensemble method is one of the consistent methods for producing possibly the best predictions.
The remaining sections of the chapter are organized as follows: Section 2 explains the overview of data processing and statistical methods for data processing, Section 3 outlines the numeric datasets and image datasets available for COVID-19, Section 4 summarizes the background study of various image processing techniques for COVID-19 diagnosis, Section 5 describes the proposed system for COVID-19 detection using image classification, Section 6 states the materials (dataset used) and methods (learning framework, preprocessing techniques, data preparation, and augmentation) of the proposed framework, Section 7 clarifies about model training (feature extraction using pretrained models and classification), Section 8 deals with results and discussion, and Section 9 concludes the chapter.
2. Overview of data processing
Data processing consists of the following stages namely, data collection, data preparation, data input, processing, data interpretation, and data storage [12]. Data collection involves collecting data from the available sources. The collected data must be of high quality and must be from legitimate sources. The collected data is then transferred to the next stage called as data preparation. Data preparation involves cleaning of raw data and checking errors in the raw data. It is very necessary to prepare the data before processing to discard the unwanted data and to get the result with high accuracy. Data preparation is also called data preprocessing. The prepared data is then sent to the destination in which it gets converted to machine understandable format.
The next stage of data processing involves processing in which various machine learning algorithms are applied to get the desired output. This process depends on the source of data and its expected results. The next stage of the data processing involves interpretation of the output in various forms like charts, graphs, images, and videos that can be understandable by the people. The last stage involves the storage of the processed data for the future use which can be used by the data scientist in future.
Data processing is a useful technique in the medical field as it helps to gather the required information from the given data. Data processing plays a major role in disease diagnosis as it fetch the main causes of disease and various disease carriers.
As the volume of data increases in gigabytes, it is difficult to process them using the conventional data processing techniques to gather the useful information. As a result, computer-based data processing techniques are used to diagnose the various diseases with its causes [13]. Knowledge discovery in databases (KDDs) and intelligent data analysis (IDA) are the most commonly used data processing techniques. These techniques are iterative in nature. KDD is mostly applied over a large amount of datasets whereas in IDA, this is not exactly the same. IDA is an AI-based technique in which it uses information about the domain of problem. Because of the iterative nature of these two techniques, only specific data mining tools can be used for both KDD and IDA [14].
The main reasons behind IDA for disease diagnosis are to extract the main symptoms of the disease and interpretation of the data in human understandable format. Various intelligent data processing techniques have been applied to make critical decisions related to disease diagnosis and treatment. All these techniques mostly encompass the majority of machine learning and deep learning algorithms to get highly accurate results.
2.1. Statistical methods for data processing
Statistical methods are mainly classified into two categories: descriptive and prescriptive methods. Descriptive methods analyze the stored past data to draw useful conclusions from it. Descriptive methods always give precise results. The main idea behind the descriptive analytics process is to summarize and convert the data into useful information for monitoring and reporting. It is broadly classified into parametric and nonparametric methods. If the variable is continuous, parametric methods can be used, unless nonparametric methods can be applied. The below Table 7.1 shows a summary of various parametric and nonparametric methods.
Table 7.1.
Summary of descriptive statistical methods.
| Description | Parametric methods | Nonparametric methods |
|---|---|---|
| Descriptive statistics | Mean, standard deviation | Median, interquartile range |
| Sample with population | T-test–one sample | One sample Wilcoxon signed rank test |
| Unpaired groups-two | T-shirt–paired samples | Wilcoxon rank sum test |
| Paired groups-two | T-shirt–paired samples | Related samples Wilcoxon signed rank test |
| Unpaired groups-three or more | One-way ANOVA | Kruskal–Wallis H test |
| Paired groups-three or more | Repeated measures ANOVA | Friedman test |
| Measure of linear relationship between two variables | Pearson's correlation coefficient | Spearman rank correlation coefficient |
| Forecast one outcome variable by at least one independent variable | Linear regression model | Nonlinear regression model/log linear regression model on log normal data |
Predictive methods outline the future trend with the help of knowledge gathered from the past historical data. It uses supervised learning methods to predict the future behavior. It does not give accurate results as it is a proactive approach. The below Table 7.2 shows the summary of available predictive methods and their applications.
Table 7.2.
Summary of predictive statistical methods.
| Application | Method | Category of data analysed |
|---|---|---|
| Loans-approval and rejection | Decision tree | Quantitative and qualitative |
| Customer credit rating | Multiple linear regression | Quantitative |
| Forecasting document topics | Topic modeling | Text |
| Opinion mining | Sentiment analysis | Text |
| Weather forecasting | Math calculations/neural networks | Quantitative time series |
| Self-driving cars | Deep learning/neural networks | Images |
In Ref. [16], authors have attempted to prove the use of ANOVA and regression analysis for detection of cancer. The proposed work mainly focuses on early detection of cancer with increased accuracy. It uses a dataset that consists of cancer information of each state in India. The main limitations in the proposed methodology include less sample size, and the chosen sample does not consider the common cancer screening patients.
It was proved in Ref. [17] that 2-sample Welch's t-test can be used to detect the patients affected with heart disease. This work uses Cleveland (303 records) datasets to detect the affected patients. The main drawbacks of the proposed work include low accuracy for large sized dataset.
A hybrid model was proposed in Ref. [18] using a combination of statistical method and machine learning algorithm to diagnose lung cancer. Statistical method is used to summarize the given input datasets. Training datasets are used to develop computer aided diagnosis algorithms and validation datasets are treated with random forest classifiers to forecast lung cancer. The prediction accuracy of the proposed model is studied using receiver operating characteristic curve. The proposed model suffers from the following advantages: the sample was taken only from the patients who encountered lung biopsy and works best for small samples of data only.
3. Overview on COVID-19 datasets
The current section outlines the various COVID-19 datasets available for research. Since the disease is considered as a global outbreak, the data are collected across various countries and available in different repositories. The efficacy of the datasets lies in monitoring the geographical growth and spread of the disease and thereby helping healthcare workers in the prediction and prevention of the pandemic. The datasets are collected and available in different patterns like the country-wise record of corona patients, X-ray, and computed tomography (CT) images of the affected and social media. All such datasets are summarized and interpreted in the form of numeric and image datasets.
3.1. Numeric data for COVID-19 diagnosis
Johns Hopkins University compiled a time series dataset known to be 2019 Novel Coronavirus COVID-19 (2019-nCoV), collected from the sources like WHO, European Center for Disease Prevention and Control, National Health Commission (NHC) of the People's Republic of China, and many other countries, which is available in github [22]. Countries like the USA and Korea have distributed their country data in the New York Times dataset and COVID-19 Korea dataset [23,24]. The various attributes of the dataset are gender, age, patient routine, number of suspected cases, number of confirmed cases, and diagnosed date. Similar to that of 2019-nCoV, another set case statistics is available as COVID-19 Hospital Impact Model for Epidemics (CHIME) in github [25]. Both CHIME and 2019-nCoV maintain the updated data of confirmed cases, recovered cases, and death count. The COVID-19 Open Research Dataset (CORD) is also available in Kaggle [26] for carrying out COVID-19 related research activities. The dataset is distributed across community groups and forums for challenges like identifying the disease transmission, diagnostics, and risk factors.
A mathematical model to detect the spread of COVID-19 was proposed in Ref. [19], which assumes a tree-based structure with constraints like quarantined people and travel history of both infected and uninfected people. The results of the proposed model matches with the simulated results and showed that social distancing and lock down are important to avoid the spread of COVID-19.
A simple time series forecasting method was to detect the global pandemic COVID-19. The forecasting was done by exponential smoothing models as it gives very high-prediction accuracy when compared with other forecasting models [20]. This method gives a real-time forecasting by taking the interval of samples continuously. The main drawbacks of the method lies in collection of real-time sample data continuously [21].
3.2. Medical data for COVID-19 diagnosis
Image datasets are available in the form of CT scan and X-ray images of lungs and chest. Corona is identified as a pulmonary virus; the images of lungs and chest play a vital role in diagnosis. In the United States, the very first corona victim was identified using chest X-ray. In another scenario, a patient from Washington was diagnosed with the disease using CT images of lungs; it is also found that diagnosis with CT images shows improved performance when compared with X-ray images. According to contemporary research, CT scan shows the indication of the disease even before the signs become evident. When a set of COVID-19 patents with positive results were tested for the disease using X-ray, some of the abnormalities were not identified. Yet it is evident that certain pulmonary cankers are so clear in X-ray images than CT images. Doctors and radiologists have come to a conclusion of utilizing CT when diagnosing with accused corona cases.
An open dataset containing the X-ray and CT images of the affected, along with the demographics data is available in github for research. In addition to that, there is another dataset of corona cases containing the 349 CT images collected from 216 patients is also available in github [27]. A set of radiologists deployed in an open database known as COVID-19 medical segmentation dataset [28], comprising the CT imaging of 40 patients. The database is substantially helpful for researchers trying to predict corona using AI. To help doctors and researchers in identifying the disease more precisely, British Society of Thoracic Imaging, in partnership with Cimar UK's Imaging Cloud Technology (cimar.co.uk), has developed an online repository containing the CT scans of patients with either accused or confirmed COVID-19 cases [29]. Italy contributed a dataset called COVID-19 database [30], which contains the X-ray images of lungs and chest of the corona patients. RCSB protein data bank shares the protein data of the corona virus that can be helpful in deep understanding about the virus and identifying drugs [31].
These datasets will be helpful in identifying a suitable learning model for predicting the corona disease and thereby the task of monitoring the spread of the pandemic becomes easier.
4. Background study
The following is the summary of the existing research of machine learning and deep learning models utilized in image processing of COVID-19 detection.
A screening model for detection of COVID-19 disease was designed in Ref. [32] with the help of pulmonary CT images. 334 CT image samples from coronavirus and Influenza-A viral pneumonia patients and 175 CT image samples from healthy cases were collected. A three-dimensional deep learning model was used to segment out the infected regions, and their probabilities were calculated using bayesian function. The features from the segmented regions were extracted using the traditional ResNet-18 structure. The segmented regions were analyzed using location-attention classification model to categorize between COVID-19 and Influenza-A viral pneumonia. The deep learning model had an accuracy of 86.7% in classifying the affected and healthy cases.
In [18], the authors tried to prove the use of CT image features for detection of pulmonary nodules. The proposed work mainly focuses on early stage detection of lung cancer with increased positive predictive value and decreased false-positive rate. The paper is chosen for the study as it involves disease diagnosis using CT images. There exist certain limitations in the proposed technique: less sample size and the chosen sample does not consider the common lung screening patients.
To regulate the spread of COVID-19 pandemic, Ref. [33] proposed a deep learning method to figure out the graphical features of COVID-19 for clinical diagnosis. This paper emphasized the use of transfer learning neural network model for accurate prediction of COVID-19 by the use of radio graphical features. The accuracy of the model was tested against the prediction given by a radiologist professional. Also the classification performance of the model and comparison with manual prediction were evaluated using a set of metrics like accuracy, F-measure, sensitivity, youden Index, kappa value, and area under curve (AUC).The test results proved that the manual prediction using eye recognition was less accurate compared to the deep learning model used.
A probabilistic classifier was proposed in Ref. [34], which classifies and predicts the existence of COVID-19 by using composite hybrid feature extraction and stack hybrid classification system. The hybrid model is developed by combining the traditional statistical methods and available ML tools like weka for extracting the features from the input CT images. The proposed model contains an integration of four image filters, cross feature selection models with Naive Bayes as a Meta classifier provided better accuracy and optimizes the genetic algorithm.
An automated CT image analysis tool designed in Ref. [35] demonstrates the utilization of two-dimensional and three-dimensional deep learning models developed by combining existing AI models and clinical knowledge for COVID-19 detection and tracking. CT images were analyzed using deep learning algorithms to differentiate between patients affected by Coronavirus and those who are not affected by the disease.
In another work [36], CT scans were investigated using deep learning algorithms by employing VB-Net neural networks to identify the infected portions of lungs in COVID-19 patients. The system was validated with data from 249 COVID-19 patients for training phase and 300 patients in testing phase. An effective human-in-the-loop strategy used in the proposed work helps radiologists to automatically annotate every case. Furthermore, to conduct performance evaluation, calculations based on dice similarity coefficient and the differences of volume and percentage of infection were carried out on the results obtained from the validation phase. The quantitative estimation of the system proved to be highly accurate in performing automatic delineation of infected regions in CT scan images.
Authors in Ref. [37] applied machine learning methods to classify the CT images of abdominal portions to illustrate early stage detection of COVID-19. 150 CT images were taken into consideration for the formation of datasets into four categories based on the size of the patches. The performance of the support vector machine classifier has been improved by employing several feature extraction techniques. Performance analysis was carried out based on metrics such as precision, F-score metrics, specificity, sensitivity. Classification performance evaluation showed better accuracy for Grey-Level Size Zone Matrix feature extraction method.
Convolutional neural network (CNN) is a computationally efficient model with special convolution and pooling operations for the detection of health-related problems by analyzing images. One such work has been implemented in Ref. [38] using CNN-based models such as InceptionResNetV2, InceptionV3, and ResNet50 to detect people affected by COVID-19. The models were trained and tested for 50 COVID-19 patients and 50 nonpatients using the X-ray radiographs of Chest portions. Besides using these models, authors have also adapted the transfer learning method to train the data with lesser datasets and minimize the cost incurred for calculations. Fivefold cross validation technique has been applied to assess the model performance. The ResNet50 model proved to be best compared to the other two models that were involved. The main constraints in the proposed model is the use of limited data and lack of utilization of CT images, as it shows greater accuracy in terms of disease prediction when compared with X-ray images.
From the literature survey, it is evident that for the very first time in the chronicle of a widespread disease, AI is playing a significant role in handling the COVID-19 outbreak by offering remarkable measures to diagnosis, disease monitoring and prevention, risk assessment and drug devising. It is also proved that X-ray and CT samples of the affected can be used in the disease diagnosis and the system offers better performance similar to that of the numeric data and text data. CT image samples were found to be the most prominently used data in all research, which shows the greater compatibility of the CT samples for the data processing models when compared with X-ray samples. Choosing the right data among the CT and X-ray samples is very essential because failure to quickly identify and medicate COVID-19 may intensify the mortality rate. Also various challenges that lie in image processing for COVID-19 detection are identified from the survey. Thus, the background study summarizes the various applications of machine learning and deep learning for COVID-19 diagnosis.
5. Proposed system for COVID-19 detection using image classification
The proposed system is planned to implement a deep learning model for coronavirus diagnosis. One of the main challenges identified from the survey is the use of machine learning classifiers, which incurs more time and the system learns the features that are manually formulated. These drawbacks can be overcome using deep learning models as they offer more accuracy in limited time and great power among the various neural network prototypes. Deep learning models can learn the diverse patterns and functional features by itself from the raw data. The well-known deep learning architecture for image processing is CNN, and it is widely applied in disease diagnosis. The detailed description about CNN architecture [39,40] and various techniques involved in diagnosing COVID-19 are explained in the rest of the chapter.
5.1. Convolutional neural network architecture
The CNN framework is influenced by the association and functionality of the visual cortex and conceived to do an impression of the connectivity pattern of neurons enclosed in the human brain. The usefulness of CNN lies in shrinking the input images to a simplified form (with retaining its features) for prediction. CNN is made up of neurons comprising learnable weights and biases, which are assigned to various points of the input images. The various layers and their functionalities of CNN are explained below.
5.1.1. Input layer
The input layer stores a set of input images as an array of numbers, nothing but the pixels of the image. Images are converted as a matrix array, calculated based on the size and pixels of the image. The below Fig. 7.2 is the example for the conversion of a sample image into an array of pixels.
Figure 7.2.
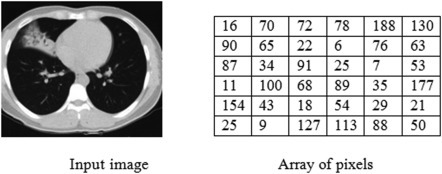
Matrix representation of sample image.
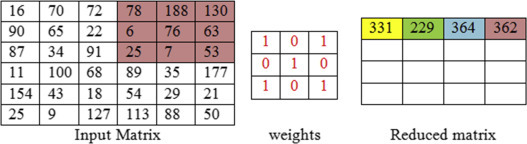
5.1.2. Convolution layer
The convolution layer is responsible for extracting recognized features from the input image. The input matrix gets converted into small sets of reduced matrix usually of size 3 × 3, which are called filters. By applying the filters to all parts of the input matrix in the convolution layer, a tensor of feature maps are produced. The main purpose of convolving the input matrix is to shrink the amount of weights to be learned, i.e., the set of high-level features and low-level features like colors, orientation, edges, and padding. The number of convolution layers can be extended depending on the features to be extracted. The minimal layer extracts the low-level features and the final layer has the maximum range of features extracted, as the number of layers increase, more number of features can be extracted.
The above Figure 7.3, Figure 7.4, Figure 7.5, Figure 7.6, Figure 7.7 clearly explains the step by step convolution process. The 6 × 6 input matrix is multiplied with the 3 × 3 weight matrix, having the default stride value as 1. The filter shares the same set of weights across the entire input, so as to achieve sharing of parameters in the CNN.
Figure 7.3.
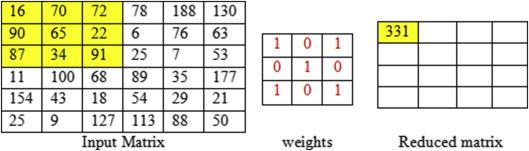
Convolution of first feature map with filter 3 × 3, stride one.
Figure 7.4.

Convolution of second feature map with filter 3 × 3, stride one.
Figure 7.5.

Convolution of third feature map with filter 3 × 3, stride one.
Figure 7.6.
Convolution of fourth feature map with filter 3 × 3, stride one.
Figure 7.7.

6 × 6 matrix convolved into a 4 × 4 matrix.
5.1.3. Pooling layer
The word pooling refers to the synonym combination. To achieve a combination of features, convolution layer feeds the feature maps to the pooling layer. In other words, the process of feature extraction is implemented by convolution layer and pooling layer. Pooling is performed by considering smaller portions of the matrix as input and is put together into single numbers representing each portion as explained in below Fig. 7.8 .
Figure 7.8.

Pooling operation.
Pooling is applied to reduce the parameters used in the network, and it is executed solitarily on all feature maps. Pooling can be done as max pooling, average pooling, min pooling. The most habitually used pooling is max pooling, which outputs the maximum number in every single portion that the filter convolves around.
5.1.4. Activation function
Activation functions are mainly used to originate non-linear variations in the neural network. A linear activation function lacks to perform back propagation and hence it is not recommended to use in neural networks. A model without activation function can perform the given task in a linear manner, but it lacks efficiency and accuracy. The adequacy of activation function lies in making the system learn and execute difficult tasks; thereby the neural network becomes more powerful. The feature maps from the convolution layer passes on to the activation functions to make the network adapt to nonlinear features from the input images. The following Table 7.3 synopsizes the features of the most widely used activation functions.
Table 7.3.
Summary of activation function.
| Activation function | Range | Features | Drawback |
|---|---|---|---|
| Sigmoid | [0,1] | It can be applied in the output layer of binary categorization | Vanishing gradient problem |
| Tanh | [−1,1] | It can be applied in the hidden layers of the network | Vanishing gradient problem occurs, and it takes more time to attain precise prediction |
| ReLU | [0,∞] | Rectified linear unit activation function includes understandable mathematical calculations. It activates the neurons based on the output, i.e., if the output falls below zero, the neurons will be disconnected from the network. | There are chances for the model to lack the ability to train from the input data and the network might lack the ability to perform back propagation. |
| Softmax | NA | Conjunction of sigmoids. It returns the probability of the feature maps or data points connected to a particular class. Applicable for multiclassification tasks. | Softmax can be performed very easily when compared with other activation functions. Softmax has no such major drawbacks as mentioned above. |
From the above table, the features of various activation functions are clear, and it can be chosen depending on the type of learning tasks.
5.1.5. Fully connected layer
It is used in the final stage of the network structure. It globally takes features from the previous layers and combines into a single vector and calculates the probability of the feature maps belonging to a particular class and the same is illustrated in the below Fig. 7.9 . This layer supports back propagation, it can iterate to the previous layers of the network to obtain the most precise weights. Finally it classifies the images based on the class labels.
Figure 7.9.
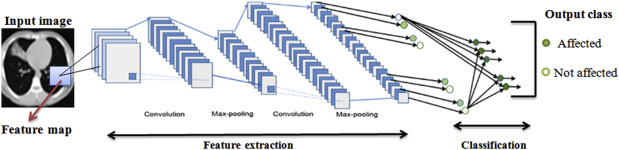
Sample convolutional neural network architecture for image classification.
Image courtesy: Modification in the design M.Z. Alom, T.M. Taha, C. Yakopcic, S. Westberg, P. Sidike, M.S. Nasrin, M. Hasan, B.C. Van Essen, A. Abdul, S. Awwal, V.K. Asari, A state-of-the-art survey on deep learning theory and architectures, Electronics (2019).
6. Materials and methods
In this section, a detailed description of the experiments and evaluation metrics that was adopted to verify the novelty of the proposed system is discussed. To develop and train the CNN model, an open-source deep learning framework, Keras, was deployed along with the backend as Tensorflow. All experiments were run on a standard PC with an Nvidia GeForce GTX TITAN Xp GPU card of 12 GB, cuDNN v7.0 library, and CUDA Toolkit 9.0.
Problem statement is formulated and discussed followed by a description of the dataset and the models used for detecting COVID-19 disease affected patients using COVID-CT images. This section provides a detailed description of the adopted methodology.
6.1. Datasets
In the proposed study, a set of images from two different datasets are combined for inputs. The dataset COVID-CT is used for implementing the proposed model, and it is available in Github [27]. The dataset consists of CT images of 275 healthy individuals and 195 Covid patients collected from 216 affected individuals. A sample of CT images from the two classes are shown in the below Fig. 7.10 .
Figure 7.10.

Sample images of Covid positive and healthy individuals.
The following Table 7.4 shows the details about the data split for training, validation, and testing.
Table 7.4.
Organization of dataset.
| Category | Covid | Noncovid |
|---|---|---|
| Train data | 183 | 146 |
| Validation data | 57 | 15 |
| Test data | 35 | 34 |
| Total | 275 | 195 |
6.2. Learning frameworks
In deep learning, an important advantage is the ability to reuse the knowledge gained from one set of problems to other related problems. Most often the training data of the real world applications will not have the similar feature space as the data that will be used in the testing phase. Different domains may be experienced during training and classification of the dataset.
In such scenarios, transfer learning may be employed to improve the performance of the deep learning models. This technique involves using the same weights of one or more than one layers that were applied in a pretrained network model to upcoming new models. The weights may be kept fixed or fine-tuned according to the requirement. This type of learning framework helps to reduce the time taken to train the deep learning model and thus results in a minimized generalization error. A detailed explanation of the proposed work is depicted in the above Fig. 7.11.
Figure 7.11.

Architecture of the proposed framework for COVID-19 diagnosis.
6.3. Preprocessing of datasets
CNN is used in applications for classifying images mainly with an intention to lower the complexity involved in large computations to be accomplished in the model. This is more likely to happen if the sizes of the images are larger. The original images in the dataset were changed to 224 × 224 pixels to minimize the computation complexity and for better processing using JPEG compression. This algorithm is particularly used for compressing images as it minimizes the size of the image without affecting the original image details. To achieve a lossless compression, discrete cosine transform technique is applied. The other preprocessing steps include the use of Histogram Equalization, Median Filter, Wiener Filter, contrast limited adaptive histogram equalization (CLAHE), and Gamma correction.
6.3.1. Median filter
Median filters are included to remove noise from the input images, similar to removing unwanted noise from signal. These filters progress across the different regions of the image in terms of pixel by pixel. The other applications of median filters are edge detection, improving the contrast of the image, and highlighting the contour regions.
6.3.2. Wiener filter
Wiener filters are extensively applied in image processing and signal processing. Image restoration processes like removal of motion blurs and optimal blurs can be performed using wiener filters.
6.3.3. Histogram equalization
Histogram is a type of data structure that can be utilized in stretching out the magnitude of the image. This method normally maximizes the contrast of images globally, when its operational data is characterized by adjacent contrast values, which enables the images of low contrast to gain more contrast.
6.3.4. Adaptive histogram equalization and contrast limited adaptive histogram equalization
Similar to histogram equalization, adaptive histogram equalization (AHE) can also be utilized in enhancing the contrast of the input images. The salient feature of AHE is that it creates a variety of histograms, representing the clear-cut portions of the image and utilizes them to redistribute the lightness values for strengthening the different edges of each section of the image. AHE likely to over amplify the contrast feature in neighbor-constant portions, as the histogram in such segments of the image are exceedingly concentrated. Also this results in amplifying the noise in neighbor-constant portions, which can be avoided using CLAHE. CLAHE is an alternative to ADE that can restrict the contrast amplification; thereby the difficulty of noise amplification can be resolved.
6.3.5. Gamma correction
Gamma correction is a nonlinear adaptation applied to each and every pixel value. Generally linear methods like addition, subtraction, and multiplication are applied on all the pixels. Gamma correction is responsible for performing nonlinear methods on the pixels of the input image and thereby remodeling the saturation of the image. It is necessary to maintain the stable gamma value, i.e., it should neither be too minimum or maximum. The various techniques utilized in the proposed model is depicted in the below Fig. 7.12 .
Figure 7.12.

Techniques used in image preprocessing.
Image enhancement by removing noise, sharpening images, makes it easier to find the key features and to obtain more suitable images for further analysis. The effects of preprocessing on the sample image are shown in Fig. 7.13 .
Figure 7.13.

Data preprocessing.
6.4. Data preparation and augmentation
The size and trait of the dataset was changed by employing few data augmentation methods. This technique helps to overcome the problems incurred because of overfitting and also provides a generalized nature to the dataset during the training phase. Rotation operation was performed by rotating the image by sheer angles to modify the size of the final image. In this case, the image was rotated by 30°. Images were rescaled to either enlarge or shrink the image. Image shift is the process of moving the image pixels in horizontal or vertical direction; during this process, the dimensions of the image will be kept unchanged. In this work, Width shift (horizontal shift) is applied by 0.3% and Height shift (Vertical Shift) is applied by 0.3%. Brightness of the image can be changed to obtain darkened or brightened images. Brightness was specified to be 1.3 to generate brightened images, as a value greater than 1.0 will only brighten the image. Alternatively, a value less than 1.0 can be used to darken the image. Zoom augmentation is applied to add new pixels to the image to zoom in the image. Zoom value 0.3 is used to enlarge/shrink the image between the range zoom in of 70% and zoom out of 130%. The setup used for image augmentation is tabulated in Table 7.5 .
Table 7.5.
Image augmentation setup.
| Technique | Value used |
|---|---|
| Rotation | 30 |
| Width shift | 0.3 |
| Height shift | 0.3 |
| Brightness | 1.3 |
| Zoom | 0.3 |
7. Model training
7.1. Feature extraction
In this stage, various pretrained models such as DenseNet169, Channel Boosted CNN, ResNeXt, AlexNet, VGG16, trained using ImageNet dataset [42] were used for feature extraction from COVID-CT dataset.
7.1.1. DenseNet169
Whenever the link between the layers adjacent to input and output layers are shorter, the CNN models will be more accurate and efficient in training the model as mentioned in Ref. [41]. One such model known as Dense Convolutional Network was introduced in Ref. [43]. In DenseNet architecture, layers are coupled in a feed-forward manner. In each layer, feature maps of one layer will act as the input to the succeeding layer and thus it follows the same fashion for the subsequent layers. Since the feature maps from one layer are propagated to other layers, it leads to the network setup to be thin and compact. Thus leading to the important advantage of DenseNet which is the increased efficiency in terms of computation and memory. This model is most preferred for feature extraction as deeper networks obtain better generic features. In the proposed work, pretrained DenseNet consisting of 169 layers has been used, and this model is already trained on ImageNet dataset. This setup consists of one convolution and one pooling layer as the starting point followed by three transition layers, four dense blocks and a classification layer at the end. The convolution layer in the beginning executes 7 × 7 convolutions and 3 × 3 max pooling with a stride value of 2. Every dense block in the network is followed by a transition layer, a combination of batch normalization layer and an average pooling layer. The dense blocks will contain convolution layers of two sizes 1 × 1 and 3 × 3, respectively. When there are n layers in the network, the nth layer will acquire the feature maps of all layers from the beginning, thus preserving the gradient flow. The classification layer at the end executes 7 × 7 global average pooling with softmax activation.
7.1.2. Channel boosted convolutional neural network
In a channel boosted CNN, the number of input channels is increased in addition to the original channel [44]. This type of addition improves the representational capacity of the network by making use of the channels obtained using transfer learning from pretrained models. Channel generation and channel exploitation are the two important steps in CB-CNN. In the channel generation phase, channels are feigned using deep generative models. The second phase, channel exploitation phase, the input channels created in the first phase were exploited using deep discriminative models [39].
| (7.1) |
| (7.2) |
Eq. (7.1) obtains the boosted input using a combiner function applied on input channel and additional channels . Eq. (7.2) denotes the Feature map generated by concatenating boosted input with kernel of ith layer.
7.1.3. ResNeXt
ResneXt is a simple architecture which is built on top of deep residual network by employing split-transform-merge strategy [45]. In this architecture, a series of transformations are performed on the modules that exist in the network, and the outputs are combined together using summation operation. This model introduces a term named cardinality to the ResNet model along with the other terms such as depth and width. Cardinality refers to the number of sets of transformations to be carried out. The idea behind this model is to apply convolutional filters to low-dimensional representations of channels instead of applying convolutions to the entire feature map. This model provides better performance on increasing cardinality rather than increasing the network's depth or width.
7.1.4. AlexNet
AlexNet is an architecture [42] which resembles LeNet, with more deeper layers. The architecture comprises eight layers in total with three fully connected layers and five convolutional layers. In this model, tanh function is replaced by Rectified Linear Unit to include nonlinearity. To handle the overfitting problems, it makes use of dropout layers as an alternative to regularization. Size of the network is decreased by using the concept of overlapping pooling. This pretrained model is used in our work to classify the images.
7.1.5. VGG16
VGG16 [46] is an architecture of convolutional neural networks with 16 layers. The model setup consists of fully connected layers, activation layers, max pooling layers, and convolutional layers. The number of filters in convolutional layers varies as 64,128,256,512 based on the layer. A softmax classifier is placed after the fully connected layers in the network.
7.2. Classification
In this work, ensemble classification was used to combine the outputs of the predictions made by the pretrained models into a vector. The prediction that was inferred the maximum number of times was used to make the final decision. Ensemble classification was used to make best use of the results obtained from various models on the same dataset. This ensemble method is one of the consistent methods for producing possibly the best predictions.
8. Results and discussions
The main goal of the proposed work was to diagnose COVID-19 images from normal CT images. To achieve this, the models discussed in the previous section were trained and tested on CT images. The training phase was executed for 30 iterations initially to evade the problems that will occur because of overfitting. The ResNeXt model provided higher accuracy than all the other models that were employed. DenseNet and VGG16 showed similar kinds of performance. K-fold cross validation was used in the proposed system to split the data which can be used for training as well as for validation. This was primarily done to estimate the efficiency of the neural network models in making predictions. In Table 7.6 , the values of the Confusion Matrix produced by each model are shown.
Table 7.6.
Prediction results from pretrained convolutional neural network models.
| Number of fold | Model | Confusion matrix |
|||
|---|---|---|---|---|---|
| True positive | True negative | False positive | False negative | ||
| Fold 1 | ResNeXt | 19 | 20 | 0 | 1 |
| AlexNet | 18 | 20 | 0 | 2 | |
| DenseNet | 17 | 20 | 0 | 3 | |
| Channel boosted convolutional neural network (CNN) | 18 | 17 | 3 | 2 | |
| VGG16 | 16 | 20 | 0 | 4 | |
| Fold 2 | ResNeXt | 20 | 20 | 0 | 0 |
| AlexNet | 20 | 19 | 1 | 0 | |
| DenseNet | 20 | 18 | 0 | 2 | |
| Channel boosted CNN | 20 | 20 | 0 | 0 | |
| VGG16 | 20 | 18 | 2 | 0 | |
| Fold 3 | ResNeXt | 20 | 20 | 0 | 0 |
| AlexNet | 20 | 19 | 1 | 0 | |
| DenseNet | 20 | 20 | 0 | 0 | |
| Channel boosted CNN | 20 | 19 | 1 | 0 | |
| VGG16 | 20 | 18 | 2 | 0 | |
| Fold 4 | ResNeXt | 20 | 20 | 0 | 0 |
| AlexNet | 20 | 19 | 1 | 0 | |
| DenseNet | 20 | 19 | 0 | 1 | |
| Channel boosted CNN | 20 | 19 | 1 | 0 | |
| VGG16 | 17 | 20 | 0 | 3 | |
| Fold 5 | ResNeXt | 20 | 20 | 0 | 0 |
| AlexNet | 18 | 20 | 0 | 2 | |
| DenseNet | 20 | 19 | 1 | 0 | |
| Channel boosted CNN | 20 | 18 | 2 | 0 | |
| VGG16 | 16 | 20 | 0 | 4 | |
TP, TN, FP, FN in Table 7.6 indicates True Positive, True Negative, False Positive, and False Negative, respectively. For each fold from one to five, the predictions made by every model are displayed in the table. ResNeXt classifies 19 of the cases to be True Positive and one case to be False Negative for k value one in k-fold cross validation. By changing the k to two, it was observed that ResNeXt classifies 20 cases as True Positive and 20 cases as True Negative; it remains stabilized for other values of k such as three, four, and five. It was noticed that DenseNet predicted 20 cases as True Positive and 20 cases as True Negative when fold three was implemented and it also showed fairly good predictions after ResNeXt model. The other models showed varying predictions for different folds of cross validation. The results in Table 7.6 clearly show the predictions made by each model to detect between Covid and noncovid cases. Graph shown in Fig. 7.14 is included to show the superiority of ResNeXt model compared to other models.
Figure 7.14.

Evaluation of models based on various performance metrics.
During the training phase, Adam optimizer and cross-entropy loss function were utilized. The learning rate was set to 0.001 value. AlexNet and ResNeXt models were trained for 200 iterations by using the initial learning rate to be 0.001. Alexnet and ResNeXt models achieved an accuracy of 92.75% and 95.34%, respectively. The area under curve was obtained higher for ResNeXt at a percentage of 99.56. In other performance metrics such as Recall, Precision, Specificity, F1 Score also ResNeXt showed greater accuracy values such as 92.25, 91.73, 99.46, and 98.85, respectively. DenseNet and channel boosted CNN were executed for 100 iterations in which DenseNet showed superior accuracy compared to CB-CNN. Accuracy value achieved by VGG-16 for 50 iterations was 93.67, which seemed to be a better accuracy compared to AlexNet and CB-CNN models.
The details of the values obtained by the neural network models for all the performance metrics is tabulated in Table 7.7 . The various performance metrics used for performance analysis are Accuracy (Acc), Recall (Rec), Precision (Pre), Area under Curve (AUC), Specificity (Spec), and F1 score (F1). It is evident from Fig. 7.14, ResNeXt exhibits superior performance for all the metrics compared to the other CNN pretrained models employed in the proposed framework.
Table 7.7.
Performance analysis of convolutional neural network models with varying epochs.
| Number of epochs | Model | Performance metrics |
|||||
|---|---|---|---|---|---|---|---|
| Accuracy | Recall | Precision | Area under curve | Specificity | F1 score | ||
| 200 | ResNeXt | 90.34 | 89.25 | 90.23 | 89.56 | 89.46 | 89.85 |
| AlexNet | 87.75 | 86.23 | 87.22 | 87.38 | 86.03 | 87.52 | |
| 100 | DenseNet | 87.98 | 88.56 | 89.27 | 88.95 | 87.75 | 88.37 |
| Channel boosted CNN | 85.34 | 86.84 | 85.47 | 86.39 | 86.85 | 85.46 | |
| 50 | VGG16 | 86.67 | 87.99 | 88.11 | 87.64 | 87.96 | 86.28 |
The average time taken by all the models on CPU was calculated to be 0.365 s, and the same execution in GPU was achieved in 0.052 s. The ensemble model used for classification took a total computation time of 0.175 s. The performance of the proposed model at various epochs are represented in the Fig. 7.15 .
Figure 7.15.

Performance of the models at various epochs.
The results obtained by the proposed model were compared with the results produced by other authors who worked on CT images for COVID-19 detection. The compared results are shown in Table 7.8 . In Ref. [32], performance metrics such as Recall, Precision, and F1 Score have been calculated and the values are 86.7, 81.3, and 83.9, respectively. Ref. [33] has achieved an accuracy 89.5, specificity 88, F1 Score 77 using deep learning algorithms. Other metrics described in this work were not provided in Refs. [32,33]. It has been observed that the proposed model outperformed the other compared results.
Table 7.8.
Comparative results—proposed versus existing.
In Fig. 7.16 , comparison is drawn between the F1 score achieved for Ensemble model and existing works [32,33] in literature. It is clearly visible that the proposed model shows improved F1 score than the compared works. Fig. 7.17 compares the proposed work with the performance of [32] in terms of F1 score, recall and precision. Similarly, Fig. 7.18 compares Ensemble model results against [33] with respect to accuracy and specificity. It was observed that Ensemble model gives higher performance than the results produced by Refs. [32,33].
Figure 7.16.

Figure 7.17.

Result analysis—F1 score, recall, and precision proposed versus existing [32].
Figure 7.18.

Result analysis—accuracy and specificity proposed versus existing [33].
9. Conclusion
Deep learning, one of the promising fields of AI, has created remarkable contributions in the world of data science and serves to be the most utilized methodology to procure relevant dimensions from the data. In the era of image processing, CNN has attained a special standard in disease diagnosis over the recent times. Besides the application in the image processing domain, CNN has also extended its phenomenal success in other notable applications of deep learning like object detection, image segmentation, and recommendation systems.
The proposed study aims to diagnose COVID-19, an infectious disease, which is causing adverse consequences worldwide including deaths. An approach based on deep learning is employed to classify COVID-19 cases from CT images by adopting transfer learning technique. Input images were preprocessed to remove noise and produce enhanced images. Further procedures like data augmentation and feature extraction were applied on the preprocessed images. Pretrained models such as ResNeXt, channel boosted CNN, DenseNet, AlexNet, and VGG 16 which were already trained on the ImageNet database were used for feature extraction. The output predictions from these models were combined using the Ensemble classifier to provide the final prediction. Performance comparison was carried out to validate the proposed approach against the existing research works. It was observed that the ensemble classifier outperformed the other models by producing better accuracy of 90.67%. The outcomes of the proposed model show an accurate classification framework for data processing of COVID-19 by procuring the essential radiological attributes of the CT images. Future research on this domain may be emphasized on training the neural networks for larger dataset by incorporating more data augmentation techniques to achieve improved accuracy.
References
- 1.Latif S., Usman M. Leveraging data science to combat COVID-19: a comprehensive review. IEEE Trans. Artif. Intell. 2020 doi: 10.13140/RG.2.2.12685.28644/4. [DOI] [PMC free article] [PubMed] [Google Scholar]
- 2.Hamzaha F.A.B., Laub C.H. CoronaTracker: world-wide COVID-19 outbreak data analysis and prediction. Bull. World Health Org. 2020 doi: 10.2471/BLT.20.251561. [DOI] [Google Scholar]
- 3.Li L., Yang Z. Propagation analysis and prediction of the COVID-19. Infect. Dis. Model. 2020;(5):282–292. doi: 10.1016/j.idm.2020.03.002. [DOI] [PMC free article] [PubMed] [Google Scholar]
- 4.Hosseiny M., Kooraki S. Radiology perspective of coronavirus disease 2019 (COVID-19): lessons from severe acute respiratory syndrome and middle east respiratory syndrome. Cardiopulm. Imag. Rev. 2020:1–5. doi: 10.2214/AJR.20.22969. [DOI] [PubMed] [Google Scholar]
- 5.Wu Z., McGoogan J.M. Characteristics of and important lessons from the coronavirus disease 2019 (COVID-19) outbreak in China: summary of a report of 72 314 cases from the Chinese center for disease control and prevention. J. Am. Med. Assoc. 2020;323(13):1239–1242. doi: 10.1001/jama.2020.2648. [DOI] [PubMed] [Google Scholar]
- 6.Phua J., Weng L., Ling L., et al. Intensive care management of coronavirus disease 2019 (COVID-19): challenges and recommendations. Lancet Respir. Med. 2020;8(5):506–507. doi: 10.1016/S2213-2600(20)30161-2. [DOI] [PMC free article] [PubMed] [Google Scholar]
- 7.Denison M.R. Coronavirus research: keys to diagnosis, treatment and prevention of SARS. Learn. SARS Prep. Next Dis. Outbreak Workshop Summ. 2020:149–157. https://www.ncbi.nlm.nih.gov/books/NBK92477/ [Google Scholar]
- 8.Kandeel M., Ibrahim A. From SARS and MERS CoVs to SARSCoV2: moving toward more biased codon usage in viral structural and nonstructural genes. J. Med. Virol. 2020:660–666. doi: 10.1002/jmv.25754. [DOI] [PMC free article] [PubMed] [Google Scholar]
- 9.Gayle A.A., Wilder-Smith A., Rocklov J. The reproductive number of COVID-19 is higher compared to SARS coronavirus. J. Trav. Med. 2020;27:1–4. doi: 10.1093/jtm/taaa021. [DOI] [PMC free article] [PubMed] [Google Scholar]
- 10.Xie M. Insight into 2019 novel coronavirus — an updated interim review and lessons from SARS-CoV and MERS-CoV. Int. J. Infect. Dis. 2020;94:119–124. doi: 10.1016/j.ijid.2020.03.071. [DOI] [PMC free article] [PubMed] [Google Scholar]
- 11.Bauch C.T. Assessing the pandemic potential of MERS-CoV. Lancet (N. Am. Ed.) 2020;382 doi: 10.1016/S0140-6736(13)61504-4. [DOI] [PMC free article] [PubMed] [Google Scholar]
- 12.Sharma B. Processing of data and analysis. Biostat. Epidemiol. Int. J. 2018;1(1):3–5. doi: 10.30881/beij.00003. [DOI] [Google Scholar]
- 13.Lavra N., Kononenko I. Intelligent data analysis for medical diagnosis: using machine learning and temporal abstraction. AI Commun. 2015;11(3,4):191–218. [Google Scholar]
- 14.Uthayasankar Critical analysis of Big Data challenges and analytical methods. J. Bus. Res. 2017;70:263–286. doi: 10.1016/j.jbusres.2016.08.001. [DOI] [Google Scholar]
- 15.Ali Z., Bhaskar S.B. Basic statistical tools in research and data analysis. Indian J. Anaesth. 2016:662–669. doi: 10.4103/0019-5049.190623. [DOI] [PMC free article] [PubMed] [Google Scholar]
- 16.Marimuthu M., Keerthika V. International Conference on Mathematical Modelling and Scientific Computing( ICMMSC - 2018) @ IIT Indore. 2018. Statistical analysis of cancer data. [Google Scholar]
- 17.Welch B.L. University of Leeds; 2016. On the Comparison of Several Mean Values: An Alternative Approach. [Google Scholar]
- 18.Huang P., Park S. Radiology Department; 2018. Added Value of Computer-Aided CT Image Features for Early Lung Cancer Diagnosis with Small Pulmonary Nodules: A Matched Case-Control Study. [DOI] [PMC free article] [PubMed] [Google Scholar]
- 19.Arti M.K. 2020. Modeling and Predictions for COVID 19 Spread in India. [DOI] [Google Scholar]
- 20.Petropoulos F. A simple combination of univariate models. Int. J. Forecast. 2020:110–115. doi: 10.1016/j.ijforecast.2019.01.006. [DOI] [Google Scholar]
- 21.Petropoulos F. Forecasting the novel coronavirus COVID-19. PLoS One. 2020;15(3) doi: 10.1371/journal.pone.0231236. [DOI] [PMC free article] [PubMed] [Google Scholar]
- 22.COVID-19. 2020. https://github.com/beoutbreakprepared/nCoV2019 Retrieved from: [Google Scholar]
- 23.Coronavirus (Covid-19) Data in the United States. 2020. https://github.com/nytimes/covid-19-data Retrieved from: [Google Scholar]
- 24.COVID-19 Korea Dataset with Patient Routes and Visualizer. 2020. https://github.com/ThisIsIsaac/Data-Science-for-COVID-19 Retrieved from: [Google Scholar]
- 25.CHIME. 2020. https://github.com/CodeForPhilly/chime Retrieved from: [Google Scholar]
- 26.COVID-19 Open Research Dataset Challenge (CORD-19) 2020. https://www.kaggle.com/allen-institute-for-ai/CORD-19-research-challenge Retrieved from: [Google Scholar]
- 27.COVID-CT. 2020. https://github.com/UCSD-AI4H/COVID-CT Retrieved from: [Google Scholar]
- 28.COVID-19 CT Segmentation Dataset. April 2020. http://medicalsegmentation.com/COVID19 Retrieved from: [Google Scholar]
- 29.COVID-19 BSTI Imaging Database. 2020. https://www.bsti.org.uk/training-and-education/covid-19-bsti-imaging-database/ Retrieved from: [Google Scholar]
- 30.COVID-19 Database. 2020. https://www.sirm.org/category/senza-categoria/covid-19/ Retrieved from: [Google Scholar]
- 31.A Structural View of Biology, n.d. Retrieved from: https://www.rcsb.org/pdb/home/sitemap.do.
- 32.Xu X., Jiang X. Deep learning system to screen coronavirus disease 2019 pneumonia. Engineering. 2020 doi: 10.1016/j.eng.2020.04.010. [DOI] [PMC free article] [PubMed] [Google Scholar]
- 33.Wang1 S., Kang B. 2020. A Deep Learning Algorithm Using CT Images to Screen for CoronaVirus Disease (COVID-19) [DOI] [PMC free article] [PubMed] [Google Scholar]
- 34.Farid A.A., Selim G.I. A novel approach of CT images feature analysis and prediction to screen for corona virus disease (COVID-19) Int. J. Sci. Eng. Res. 2020:1141–1149. [Google Scholar]
- 35.Gozes O. Rapid AI development cycle for the coronavirus (COVID-19) pandemic: initial results for automated detection & patient monitoring using deep learning CT image analysis. Radiol. Artif. Intell. 2020 [Google Scholar]
- 36.Shan F., Gao Y., Wang J., Shi W., Shi N., Han M., Zhong X., Shen D., Shi Y. Lung infection quantification of COVID-19 in CT images with deep learning. Comput. Vis. & Pattern Recognit. (cs.CV); Image & Video Proc. (eess.iv); Quant. Methods (Q-bio -QM) 2020 arXiv:2003.04655 [cs.CV] [Google Scholar]
- 37.Barstugan M., Ozkaya U. Coronavirus (COVID-19) classification using CT images by machine learning methods. Comput. Vis. & Pattern Recognit.; Mach. Learn. (cs.LG); Image & Video Proc. (eess.Iv); Mach. Learn. (stat.ML) 2020 arXiv:2003.09424 [cs.CV] [Google Scholar]
- 38.Ali N., Kaya C. 2020. Automatic Detection of Coronavirus Disease (COVID-19) Using X-Ray Images and Deep Convolutional Neural Networks. [DOI] [PMC free article] [PubMed] [Google Scholar]
- 39.Khan A., Sohail A., Ali A. A survey of the recent architectures of deep convolutional neural networks. Comput. Vis. & Pattern Recog. 2020 arXiv:1901.06032 [cs.CV] [Google Scholar]
- 40.Lundervold A.S., Lundervold A. An overview of deep learning in medical imaging focusing on MRI. 2018. Zeitschrift für Medizinische Physik [DOI] [PubMed]
- 41.Alom M.Z., Taha T.M., Yakopcic C., Westberg S., Sidike P., Nasrin M.S., Hasan M., Van Essen B.C., Abdul A., Awwal S., Asari V.K. A state-of-the-art survey on deep learning theory and architectures. Electronics. 2019 [Google Scholar]
- 42.Krizhevsky A., Sutskever I., Hinton G.E. ImageNet classification with deep convolutional neural networks. Commun. ACM. 2017;60(6):84–90. doi: 10.1145/3065386. [DOI] [Google Scholar]
- 43.Huang G., Liu Z., van der Maaten L., Weinberger K.Q. Densely connected convolutional networks. Comput. Vis. & Pattern Recognit. 2018 Machine Learning (cs.LG) arXiv:1804.06993 [cs.CV] [Google Scholar]
- 44.Khan A., Sohail A., Ali A. A new channel boosted convolutional neural network using transfer learning. Comput. Vis. & Pattern Recognit. 2019 arXiv:1804.08528v4 [cs.CV] [Google Scholar]
- 45.Xie S., Girshick R., Dollár P., Tu Z., He K. Aggregated residual transformations for deep neural networks. Comput. Vis. & Pattern Recognit. 2017 arXiv:1611.05431[cs.CV] [Google Scholar]
- 46.Simonyan K., Zisserman A. Very deep convolutional networks for large scale image recognition. Comput. Vis. & Pattern Recognit. 2015 arXiv:1409.1556[cs.CV] [Google Scholar]