

Abstract
We built a decision-analytic model to compare the cost-effectiveness of using portable spirometer and questionnaire to screen chronic obstructive pulmonary diseases (COPD) with no screening (i.e. usual care) among chronic bronchitis patient in China. A lifetime horizon and a payer perspective were adopted. Cost data of health services including spirometry screening and treatment costs covered both maintenance and exacerbation. The result indicated that portable spirometer screening was cost-saving compared with questionnaire screening and no screening, with an incremental cost-effectiveness ratio (ICER) of −5026 and −1766 per QALY, respectively. Sensitivity analyses confirmed the robustness of the results. In summary, portable spirometer screening is likely the optimal option for COPD screening among chronic bronchitis patients China.
Subject terms: Population screening, Chronic obstructive pulmonary disease
Introduction
Chronic obstructive pulmonary disease (COPD) refers to a progressive deterioration of lung function which may cause a series of mental and physical comorbidities. COPD is one of the top three causes of mortality worldwide and claimed 3.0 million lives in 20161. The nation-wide study of COPD in China reported a prevalence of 8.2% among people aged over 40 in 2002–20042. Other recent studies in 2018 reported a prevalence of 8.6% among people aged 20 or older3 and a prevalence of 13.6% among people aged 40 or order in China4. However, based on a study examining the disease-specific funding level and disease burden of China, compared with other leading causes of death such as ischemic heart disease, stroke, and diabetes, COPD received the least funding5.
People with early diagnosis have the chance to receive the COPD treatment earlier. The treatment of COPD can ameliorate the annual decline in the FEV1 and improve lung function and quality of life and resulted in a lower frequency of acute COPD exacerbations6. However, COPD patients frequently remain undiagnosed and untreated when the disease is in its mild forms7. A nationwide observational study in China reported that half of COPD patients were diagnosed when the disease was already in moderate-to-severe stage4.
Spirometry test is the diagnostic gold standard recommended by the Global Initiative for Chronic Obstructive Lung Disease (GOLD)8. It is a reliable and validated method for COPD diagnosis. However, considering the vast patient size and limited medical resources in China, the primary care clinicians may not have sufficient time to do the spirometry test for every patient. In addition, the purchasing price of the spirometry device is expensive, and may not be afforded by most primary care institutes. Therefore, the spirometry may not be an efficient and feasible tool in Chinese primary care situation9. Questionnaires for COPD screening, such as the COPD Diagnostic Questionnaire, are developed to reduce the cost and operational complexity10. The efficiency of peak expiratory flow (PEF) meters screening also has been validated by several studies in China and in other countries11–15. Questionnaires and portable spirometers for screening can be combined to increase the accuracy of COPD diagnosis in real-life community clinical practice16. Two systematic reviews concluded that all existing screening methods using either questionnaires alone or combined with portable PEF devices are beneficial compared with no screening17,18, i.e., they predict with at least 90% accuracy that the patient does not have COPD.
There is a public policy call to review the cost-effectiveness of COPD screening tests and to promote early diagnose of COPD in China. Thus, this study aimed to build a cost-effectiveness analysis (CEA) model to evaluate different COPD screening strategies among high-risk population from the healthcare system perspective. These results will fill an evidence gap and may be used to inform policy-making in COPD screening.
Results
Base case analysis
Results of the base case are shown in Table 1. Portable spirometer screening was cost-saving compared with questionnaire screening and no screening, with the incremental QALY of 0.05 and 0.37, and cost saving of ¥229 and ¥647, respectively. Portable spirometer is the optimal option for COPD screening among CB patients in China, and questionnaire is cost-saving option compared with no screening.
Table 1.
Base case analysis results over a lifetime horizon.
| Strategies | No screening/usual care (A) | Questionnaire screening (B) | Portable spirometer screening (C) |
|---|---|---|---|
| Costs (¥) | 24,725 | 24,307 | 24,078 |
| Life years | 2.10 | 2.57 | 2.64 |
| QALY | 1.37 | 1.69 | 1.74 |
| Incremental analysis | B vs. A | C vs. B | C vs. A |
| Δ Cost (¥) | −419 | −229 | −647 |
| Δ QALY | 0.32 | 0.05 | 0.37 |
| ICER | −1,304 dominant | −5,026 dominant | −1,766 dominant |
QALY Quality-adjusted life years; ICER Incremental cost-effectiveness ratio.
Sensitivity analyses
The OWSA showed that the main drivers of the results of the three comparisons were height of male patients, lung volume decline rate of moderate COPD patients, and discount rate for costs. However, the results were robust to the parameter changes. Portable spirometer screening remained dominant treatment compared with questionnaire screening and no screening. Questionnaire screening has also remained dominant when compared with no screening (Fig. 1).
Fig. 1. Tornado diagram of one-way sensitivity analysis.

Light gray bar represented the lower limit, while dark gray line represented the higher limit of the parameter estimation.
The PSA showed that when WTP threshold set as ¥193,932 per QALY gained, the likelihood of portable spirometer screening being considered cost-effective were 100% compared with no screening and questionnaire screening (Fig. 2).
Fig. 2. Acceptability curve.
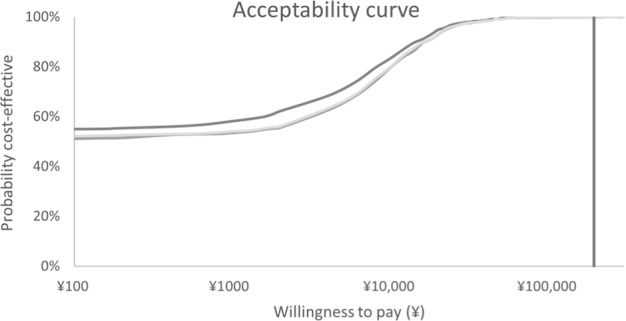
Cost-effectiveness acceptability curve in term of QALYs for Portable spirometer and questionnaire screening strategies versus no screening (usual care) in probability sensitivity analysis. Note: the x-axis was based on logarithm scale for better convenience to see.
In scenario analysis, not performing a diagnostic pulmonary function spirometry test for those screening-positive patients in portable spirometer arm, portable spirometer produced a bigger cost-saving than in the base case, equal to ¥562 over 0.37 QALYs.
Discussion
This study explored the cost-effectiveness of interventions aimed at identifying COPD patients among high-risk population in China. The result suggested that the portable spirometer can be a more promising tool for COPD screening in large scale for its high sensitivity and specificity compared with the screening questionnaire with low specificity. The OWSA results suggested that main drivers of uncertainty include height of male patients., lung volume decline rate of moderate COPD patients and discount rate. Height is associate with initial baseline values of FEV1 and lung function decline is associate with the disease progression and further impact the probability of exacerbation, pneumonia, and corresponding treatment costs. If COPD patients can be detected early and receive appropriate treatment at an early stage of COPD, the decline of their lung function can be ameliorated.
There are a few economic evaluations to compare the cost-effectiveness of different COPD screening strategies. We referred to the model structures in other published COPD-related CEA studies19,20 constructing this model. Thorn et al.21 suggested that the mini-spirometer could be an important device for pre-screening of COPD in primary care and may reduce the number of unnecessary spirometry tests performed. A cross-sectional study in India22 demonstrated that portable spirometers can help doctors detecting obstructive airways diseases with high sensitivity and specificity.
We utilized local data to make the model results more applicable to Chinese population. The normal range of predicted FEV1 formula was cited from a most recent nationwide study conducted in China24. The reliability and veracity of the reference equation has been verified by several studies3,4. The parameters of portable spirometer and screening cost were offered by its manufacturer. Local cost data and treatment pattern was collected from local literature or local KOL interview.
The values of parameters in base case were assumed to best represent practical clinical setting, and we also test scenario when not performing a diagnostic test for those screening-positive patients in portable spirometer arm. As the sensitivity and specificity of portable spirometer are accurate enough, it is controversial among clinical experts that whether a diagnostic pulmonary function spirometry test is still necessary. Therefore, we assumed the screening-positive patients to undergo a diagnostic test in the base case, but no diagnostic test in the scenario analysis. In this scenario, portable spirometer arm is still a dominant option.
There was methodological controversy in constructing a CEA model for COPD screening. For example, Jordan et al.25 used a large RCT patient-level data to evaluate the cost-effectiveness of screening questionnaire, and suggested the systematic case-finding using screening questionnaire is cost-effective. However, Van Boven et al.26 argued that the 1-year study duration might not have been enough to support long-term economic assessment as COPD treatment is lifelong. In another study, Lambe et al.23 adopted a lifetime horizon, and evaluated systematic case-finding for COPD via modeling approach and received much more positive by Van Boven27. In our model, as the screening can detect COPD and those patients can receive appropriate treatment at early stage, the decline of their lung function can be ameliorated, and overall cost could be saved. Therefore, the longer we set the treatment duration, the lower we got the ICER from cost-effective to cost saving (Fig. 3).
Fig. 3. Change of ICER in different treatment duration.

Note: the x-axis was based on logarithm scale for better convenience to see. Light gray line: portable spirometer vs. no screening (usual care); median gray line: questionnaire vs. no screening (usual care); and dark gray line: portable spirometer vs. questionnaire.
Our study has two limitations: we used those utility scores reported in other countries due to a lack of China specific data. Sensitivity analyses suggested that the variation of input parameters only had a small impact on the ICERs; in addition, we did not consider other adverse events such as anemia and depression, and the impact on the pneumonia risk from ICS treatment, due to a lack of updated and relevant data.
In this study, we used CB patients as the targeted population. Potentially, the model can also be adapted to evaluate the cost-effectiveness in other COPD high-risk populations, such as smokers and emphysema patients, if the clinical and epidemiological data become available in future. In addition, the model can also be used to compare the cost-effectiveness of different types of portable spirometers. Both our study results and model can be used to inform policy-making in COPD screening in another high-risk population.
Methods
Screening population
Chronic bronchitis (CB) patients are at high-risk of COPD and can be diagnosed with COPD once persistent airway obstruction presents28. Patients with CB symptoms such as chronic cough, phlegm, and shortness of breath, especially during movement, had a nearly threefold increased risk of developing COPD compared with asymptomatic subjects29. The prevalence of CB is also higher in COPD patients3,30. Therefore, CB patients are main target populations for COPD screening and can be used as a good starting point to build a cost-effectiveness analysis model upon.
Model structure
A decision-analytic model was constructed using Microsoft® Office Excel 2013 to simulate and evaluate the potential clinical and economic outcomes associated with two screening strategies of COPD: portable spirometer and questionnaire alone with no screening (i.e. usual care). The model has two parts: a decision tree model simulating the two screening processes and no screening process; a Markov model simulating the disease progression following the screening (using portable spirometer or questionnaire) and no screening process.
Our decision tree model (Fig. 4a) assumed a one-time screening of 1000 Chinese CB patients in each of the three arms. Those 1000 CB patients may or may not have COPD. Sensitivity and specificity of the test were applied. Since screening tests may generate false positive results, we assumed that patients with a positive screening result will be referred to undergo diagnostic procedures. Patients with a false negative screening result (i.e. undetected COPD patients) will not be referred. After screening, those 1000 CB patients can be classified as non-COPD (remained as CB) patients, detected COPD patients or undetected COPD patients.
Fig. 4. Cost-effective model structure.

Model structure: Decision tree (a), Markov model (b). *Within each health state, patients may experience either severe exacerbation, non-severe exacerbation or serious pneumonia. ‡Death could occur following any health status.
COPD is characterized by persistent respiratory symptoms and airflow limitation that is due to airway and/or alveolar abnormalities. The presence of a post-bronchodilator FEV1/FVC < 0.7 confirms the presence of persistent airflow limitation8. Regardless of diagnosis status, the severity of airflow limitation was classified according to the predicted post-bronchodilator FEV1 defined in GOLD 20208 (mild, post-bronchodilator FEV1 >80% predicted; moderate, post-bronchodilator FEV1 ≥50% predicted; severe and very severe, post-bronchodilator FEV1 <50% predicted). Thus, at the end of the decision tree model, the simulated patients can be categorized into one of the following seven health states: Non-COPD, detected mild COPD, detected moderate COPD, detected severe/very severe COPD, undetected mild COPD, undetected moderate COPD, and undetected severe/very severe COPD.
The COPD patients will then enter into the corresponding states in the Markov model (Fig. 4b). A lifetime horizon and monthly cycle were applied. The undetected COPD patients can stay with original status, progress to the next severity status, become detected, or die. The detected can stay, progress to the next severity status, or die.
Undetected and detected COPD patients will receive different treatments, and consequently have different initial lung function variations. We assumed that undetected COPD patients would continue CB treatment (including inhaled corticosteriod, short-acting bronchodilation, expectorants, etc.), which is ineffective to improve lung function. Patients can have CB without COPD still need treatment advice and smoking cessation. Hence the FEV1 of undetected patients would decline. Detected COPD patients would initiate the standard COPD treatment. The lung function improvement benefited from COPD treatment was cited from the related clinical trials (Supplementary Table 6). Undetected patients might be detected while disease progressing.
Within each health state except for death, specific values for associated utility, costs, and risks of pneumonia and exacerbation were assigned. It was assumed that an exacerbation could be treated in hospital (severe) or in community care (non-severe), with different costs and dis-utilities. Severe exacerbation could be further classified into fatal or nonfatal. Pneumonia could also be fatal or nonfatal. Exacerbation and pneumonia were assumed to be independent events in the model19.
Model inputs
The authors declare that the data analyzed during this study are available within the paper and its supplementary file.
Sensitivity and specificity of screening strategies
The sensitivity and specificity of the widely used portable spirometer e-LinkCare® PF 280 were provided by the manufacturer from an unpublished observational study in China. Spirometry was conducted and assessed in accordance with ATS/ERS recommendations31,32. Parameters for COPD screening questionnaires were cited from a meta-analysis33 (Table 2).
Table 2.
Sensitivity and specificity of different screening approaches.
Baseline values of trough FEV1
COPD patients in different severity states had different initial baseline values of FEV1, which were used to calculate the FEV1 decline rate and transition probabilities between each severity state. Nationwide spirometric reference equation24 was applied in this study, and it fitted well to represent the normal range of predicted FEV1 for Chinese people (Eqs. 1 and 2).
| 1 |
| 2 |
The age and height of the screening cohort for each sex from published literature3 were applied to both equations (Table 3). The Mspline in the equations was referred to an age-specific contribution from the spline function. We used the midpoints of GOLD-criteria post-bronchodilator FEV1 thresholds for each health state: 90% for mild, 65% for moderate, and 25% for severe and very severe COPD states.
Table 3.
Screening cohort characteristics.
| Parameter | Values | Source/assumption | OWSA | |
|---|---|---|---|---|
| Lower | Upper | |||
| Probability that a patient with chronic bronchitis (CB) has COPD | 31.37% | 3 | 25.10% | 37.64% |
| Proportion of diagnosed COPD patients being mild | 31.38% | 3 | 25.10% | 37.65% |
| Proportion of diagnosed COPD patients being moderate | 46.04% | 3 | 36.83% | 55.25% |
| Proportion of diagnosed COPD patients being severe/very severe | 22.58% | 3 | 18.06% | 27.10% |
| Average age of diagnosed COPD patients | 59.59 | 3 | 47.67 | 71.50 |
| % females in CB with COPD | 23.46% | 3 | 18.77% | 28.15% |
| % females in CB without COPD | 35.39% | 3 | 28.31% | 42.47% |
| Height (females) | 155.80 | 40 | 140.22 | 171.38 |
| Height (males) | 167.10 | 40 | 150.39 | 183.81 |
Changes in trough FEV1 efficacy
The patients’ different COPD health states in the model were defined based on pulmonary function measured by the FEV1 percentage of predicted normal value, using the same severity classification as GOLD criteria. According to the GOLD classification of COPD severity of airflow limitation, the threshold for mild-to-moderate status was 80% of predicted FEV1, which were 1.77 L for females and 2.44 L for males, and the threshold for moderate-to-severe/very severe status was 50% of predicted FEV1, which were 1.11 L for females and 1.52 L for males.
Detected patients were assumed to receive inhaled treatment. Based on the treatment guideline and clinical practice in China, most mild patients receive mono bronchodilator such as SABA, SAMA, or LAMA; moderate patients receive LAMA or ICS + LABA; and severe/very severe patients receive LABA + LAMA, or ICS + LABA, or LABA + LAMA + ICS. The treatment effects of each therapy were obtained from several clinical trials conducted in Asian populations (Table 4).
Table 4.
Clinical inputs.
| Parameter | Values | Source/assumption | OWSA | |
|---|---|---|---|---|
| Lower | Upper | |||
| COPD through FEV1 Decline (L/year)a | 0.041 | 41 | 0.033 | 0.049 |
| Annual probability to discover COPD from “undetected”b | ||||
| Mild COPD | 20.00% | KOL interview | 16.00% | 24.00% |
| Moderate COPD | 50.00% | KOL interview | 40.00% | 60.00% |
| Severe/very severe COPD | 90.00% | KOL interview | 72.00% | 100.00% |
| Treatment effects (mean change in through FEV1 L/month) | ||||
| LAMA + LABA | 0.026 | Supplementary Table 3 | 0.021 | 0.031 |
| LABA + ICS | 0.031 | Supplementary Table 3 | 0.025 | 0.037 |
| LABA alone | 0.013 | Supplementary Table 3 | 0.010 | 0.016 |
| LAMA alone | 0.022 | Supplementary Table 3 | 0.018 | 0.027 |
| LABA + LAMA + ICS | 0.025 | Supplementary Table 3 | 0.020 | 0.030 |
| % COPD patient to develop exacerbation | ||||
| Mild COPD | 19.00% | 35,36 | 15.20% | 22.80% |
| Moderate COPD | 19.00% | 35,36 | 15.20% | 22.80% |
| Severe/very severe COPD | 26.50% | 35,36 | 21.20% | 31.80% |
| % of exacerbations treated in hospital | ||||
| Mild COPD | 68.42% | 35,36 | 54.74% | 82.11% |
| Moderate COPD | 68.42% | 35,36 | 54.74% | 82.11% |
| Severe/very severe COPD | 66.04% | 35,36 | 52.83% | 79.25% |
| Mortality of severe exacerbation | 1.28% | 37 | 0.50% | 10.00% |
| Risk of serious pneumonia | ||||
| Monthly incidence of serious pneumonia | 0.20% | 38 | 0.16% | 0.25% |
| Mortality of serious pneumonia | 3.33% | 38 | 2.66% | 3.99% |
SABA short acting beta agonists, SAMA short acting muscarinic antagonists, LAMA long acting muscarinic antagonists, LABA long acting beta agonists, ICS inhaled corticosteroids, KOL key opinion leader.
aThe FEV1 decline rate was transformed to L/month when used in the model. The transformed equation is: decline rate (L/month) = decline rate (L/year)/12.
bThe annual detected probability was transformed to monthly probability when used in the model. The transformed equation is: monthly probability = 1−exp (ln (1-annual probability)/12).
Because of limited data on clinical efficacy, we assumed that the treatment effect was null after the first 6 months, and FEV1 declined since then. For undetected patients, they did not receive any treatment for COPD, thus their FEV1 kept decreasing from the first cycle. We cited different FEV1 decline rates for each COPD status34.
Figure 5 illustrates the FEV1 changing process in mild COPD female patient in the model. For those undetected mild COPD patients, their FEV1 decline from the start point; however, the FEV1 of those detected patients would increase in the first 6 months and then decrease later on. Therefore, compared with undetected patients, it will take longer for detected patients to progress from mild to the moderate and severe/very severe status.
Fig. 5. Illustration for FEV1 changing among females in mild COPD status.

Light gray line represented the detected mild population, while dark gray line represented the undetected mild population.
Exacerbation and pneumonia
Different severities of exacerbation and pneumonia are related with different mortality rates, costs and utilities (Table 5). Exacerbation and pneumonia risks were associated with the severity of airflow limitation and obtained from published studies35–38.
Table 5.
Cost, utility, and discount rate input.
| Parameter | Values | Source/assumption | OWSA | |
|---|---|---|---|---|
| Lower | Upper | |||
| Drug costs per month (¥) | ||||
| LAMA + LABA | ¥642 | IQVIA CHPA 2018 | ¥513 | ¥770 |
| LABA + ICS | ¥114 | IQVIA CHPA 2018 | ¥91 | ¥136 |
| LABA alone | ¥124 | IQVIA CHPA 2018 | ¥99 | ¥149 |
| LAMA alone | ¥253 | IQVIA CHPA 2018 | ¥202 | ¥303 |
| LABA + LAMA + ICS | ¥366 | IQVIA CHPA 2018 | ¥292 | ¥439 |
| Cost of COPD maintenance (oxygen inhalation, expectorant, etc) per month (¥) | ||||
| Mild COPD | ¥23 | 39 | ¥18 | ¥27 |
| Moderate COPD | ¥67 | 39 | ¥54 | ¥81 |
| Severe/very severe COPD | ¥187 | 39 | ¥150 | ¥225 |
| Cost of CB treatment per month (¥) | ¥288 | IQVIA CHPA 2018 | ¥100 | ¥500 |
| Amoxicillin | ¥10 | IQVIA CHPA 2018 | – | – |
| Dextromethorphan | ¥27 | IQVIA CHPA 2018 | – | – |
| Ambroxol hydrochloride | ¥224 | IQVIA CHPA 2018 | – | – |
| Aminophylline | ¥20 | IQVIA CHPA 2018 | – | – |
| Ipratropium bromide | ¥7 | IQVIA CHPA 2018 | – | – |
| AE costs (¥) | ||||
| Exacerbation treated in inpatient | ||||
| Mild COPD | ¥8,639 | 39 | ¥6,911 | ¥10,366 |
| Moderate COPD | ¥17,277 | 39 | ¥13,822 | ¥20,732 |
| Severe/very severe COPD | ¥25,915 | 39 | ¥20,732 | ¥31,099 |
| Exacerbation treated in outpatient | ¥395 | 39 | ¥316 | ¥474 |
| Cost of pneumonia | ¥32,394 | 39 | ¥25,916 | ¥38,873 |
| Screening and diagnosis costs (¥) | ||||
| Cost of portable spirometer screening | ¥34 | Supplementary Table 9 | ¥27 | ¥41 |
| Cost of questionnaire screening | ¥8 | Supplementary Table 9 | ¥6 | ¥9 |
| Cost of additional tests to confirm COPD | ¥220 | Supplementary Table 8 | ¥176 | ¥264 |
| Utility | ||||
| Mild COPD | 0.81 | – | 0.65 | 0.97 |
| Moderate COPD | 0.72 | 20 | 0.58 | 0.86 |
| Severe/very severe COPD | 0.67 | 20 | 0.54 | 0.80 |
| Correction for exacerbation in outpatient | 0.85 | 36 | 0.68 | 0.99 |
| Correction for exacerbation in inpatient | 0.50 | 36 | 0.40 | 0.60 |
| Correction for serious pneumonia | 0.50 | 36 | 0.40 | 0.60 |
| Discount rate | ||||
| Effect | 3.5% | 42 | 0.00 | 5.00 |
| Costs | 3.5% | 42 | 0.00 | 5.00 |
Exchange rate in 2018 was 1 Chinese Yuan = 0.1511 US Dollar.
KOL key opinion leader, CB chronic bronchitis, CHPA Chinese Hospital Pharmaceutical Audit database, SABA short acting beta agonists, SAMA short acting muscarinic antagonists, LAMA long acting muscarinic antagonists, LABA long acting beta agonists, ICS inhaled corticosteroids.
Costs
All costs included in the model were in Chinese Yuan and adjusted into 2018 price with CPI (consumer price index; Table 5).
The costs for screening programs and diagnosis tests were collected via key opinion leader (KOL) interviews. The costs of diagnosis tests included outpatient visit fee, cost of bronchodilators, and cost of lung function test and chest radiography.
The unit prices of each inhaled treatment for COPD were collected from IQVIA Chinese Hospital Pharmaceutical Audit Database (CHPA). The CHPA database captures purchase statistics from over 9000 hospitals in China and reports the market prices at which the panel hospitals purchase products from wholesalers, distributors, and manufacturers. For each inhaled treatment category, the weighted average unit price was calculated using total sales amount divided by sales volume. Then we calculated the monthly prescription costs using the weighted average unit price and the recommended dose of each treatment.
Other cost, including maintenance treatment (e.g. oxygen inhalation, expectorant, etc.), treatment costs of exacerbation and pneumonia were obtained from Fan39 and adjusted by KOLs.
Undetected COPD patients were assumed to chronically receive CB treatment (including anti-infection, antibechic, expectorants, and antispasmodic etc. ¥288 per month). Unit cost of CB treatment were collected from IQVIA CHPA database, and the dosage were obtained from the treatment guideline verified by clinical expert. Detailed cost component can be found in Supplementary Tables 4, 7, 8, and 9.
Utility
Utility values were derived from previously published literatures and related to disease severity, exacerbation and pneumonia (Table 5). These utility values were used to estimate quality-adjusted life-years (QALYs) by multiplying the number of accrued life years within each health status by the utility weight of each disease severity.
Sensitivity analyses
One-way sensitivity analysis (OWSA) were performed to investigate the impact of variation in key model-input values individually, within reasonable fixed limits, on the base case incremental cost-effectiveness ratio (ICER). As suggested and confirmed by a panel of local clinical experts, the height of patients, sensitivity and specificity of screening strategies varied by ±10%, the risk of death with severe exacerbation (treated in hospital) ranged from 0.5% to 10%, and those of the other parameters varied by ±20% (Tables 2–5).
Probabilistic sensitivity analysis (PSA) was performed to test the effect of parameter uncertainty on the study results. Measures of distribution were obtained from the literature. We calculated the ICER by running 1000 Monte Carlo simulations to determine the proportions of simulations that were under predefined willingness-to-pay (WTP) thresholds of three times the gross domestic product (GDP) per capita in 2018. Then, a cost-effectiveness acceptability curve was generated to summarize the uncertainty of the cost-effectiveness analysis and determine the proportions of simulations that were under the WTP thresholds. The values and distributions of parameters for sensitivity analyses were shown in supplementary file.
Since the accuracy rate of portable spirometer is very high, we also tested the scenario that diagnostic test was not performed in those screening-positive patients in portable spirometer arm.
Reporting summary
Further information on research design is available in the Nature Research Reporting Summary linked to this article.
Supplementary information
Acknowledgements
We would like to thank Dr. Tianxing Wang, the CEO of e-LinkCare®, for providing the parameters of portable spirometer as parameters for our model. E-LinkCare® does not have a direct interest in the results of the research supporting this article. This study is funded by National Key R&D Plan 2018YFC1311900.
Author contributions
All the authors contributed extensively to the work presented in this paper. S.Q., X.Y., T.L., and J.Z. led the study design. S.Q., Z.Y., Y.L., and C.Y. conducted the literature review, designed, and implemented local data collection and analysis. X.Y., T.L., L.W., T.Y., M.H., H.L., L.F., and J.Z. reviewed data and model simulation analysis. All authors jointly contributed to result in interpretations and manuscript writing. All authors read and approved the final manuscript.
Data availability
The data that support the findings of this study are available from the corresponding author upon reasonable request.
Competing interests
The authors declare no competing interests.
Footnotes
Publisher’s note Springer Nature remains neutral with regard to jurisdictional claims in published maps and institutional affiliations.
Supplementary information
The online version contains supplementary material available at 10.1038/s41533-021-00233-z.
References
- 1.WHO. The Top 10 Causes Of Deathhttps://www.who.int/news-room/fact-sheets/detail/the-top-10-causes-of-death (2018).
- 2.Zhong N, et al. Prevalence of chronic obstructive pulmonary disease in China: a large, population-based survey. Am. J. Respir. Crit. Care Med. 2007;176:753–760. doi: 10.1164/rccm.200612-1749OC. [DOI] [PubMed] [Google Scholar]
- 3.Wang C, et al. Prevalence and risk factors of chronic obstructive pulmonary disease in China (the China Pulmonary Health [CPH] study): a national cross-sectional study. Lancet. 2018;391:1706–1717. doi: 10.1016/S0140-6736(18)30841-9. [DOI] [PubMed] [Google Scholar]
- 4.Fang L, et al. Chronic obstructive pulmonary disease in China: a nationwide prevalence study. Lancet Respir. Med. 2018;6:421–430. doi: 10.1016/S2213-2600(18)30103-6. [DOI] [PMC free article] [PubMed] [Google Scholar]
- 5.Xu G, et al. NSFC health research funding and burden of disease in China. PLoS ONE. 2014;9:e111458. doi: 10.1371/journal.pone.0111458. [DOI] [PMC free article] [PubMed] [Google Scholar]
- 6.Zhou Y, et al. Tiotropium in early-stage chronic obstructive pulmonary disease. N. Engl. J. Med. 2017;377:923–935. doi: 10.1056/NEJMoa1700228. [DOI] [PubMed] [Google Scholar]
- 7.Casaburi R, Duvall K. Improving early-stage diagnosis and management of COPD in first care. Postgrad. Med. 2014;126:141–154. doi: 10.3810/pgm.2014.07.2792. [DOI] [PubMed] [Google Scholar]
- 8.Global Initiative for Chronic Obstructive Lung Disease. Global Strategy for the Diagnosis, Management, and Prevention of COPD. 2018 Report https://goldcopd.org/.
- 9.Han MK, et al. Identifying patients with undiagnosed COPD in primary care settings: insight from screening tools and epidemiologic studies. Chronic Obstr. Pulm. Dis. 2015;2:103–121. doi: 10.15326/jcopdf.2.2.2014.0152. [DOI] [PMC free article] [PubMed] [Google Scholar]
- 10.Zhou Z, Zhou A, Zhao Y, Chen P. Evaluating the clinical COPD questionnaire: a systematic review. Respirology. 2017;22:251–262. doi: 10.1111/resp.12970. [DOI] [PubMed] [Google Scholar]
- 11.Jackson H, Hubbard R. Detecting chronic obstructive pulmonary disease using peak flow rate: cross sectional survey. BMJ. 2003;327:653–654. doi: 10.1136/bmj.327.7416.653. [DOI] [PMC free article] [PubMed] [Google Scholar]
- 12.Nelson SB, et al. Questionnaires and pocket spirometers provide an alternative approach for COPD screening in the general population. Chest. 2012;142:358–366. doi: 10.1378/chest.11-1474. [DOI] [PubMed] [Google Scholar]
- 13.Liu Y, Xu W, Meng S, Zhao Y, Weiwei G. To explore the screening effect of peak airflow velocity detection with peak airflow meter on chronic obstructive pulmonary disease. Chin. J. Respir. Crit. Care Med. 2015;14:250–254. [Google Scholar]
- 14.Teng, C., Gao, Y. & Zhang, J. Correlation Between Peak Expiratory Flow Rate And Copd Airflow Obstruction (2013).
- 15.Tian, J. & Ran, P. Establishment Of The Formula For Predicting The Peak Expiratory Flow Rate In Adults And Its Role In The Initial Screening Of Copd Patients With Airflow Limitation (2010).
- 16.Sichletidis L, et al. A combination of the IPAG questionnaire and PiKo-6® flow meter is a valuable screening tool for COPD in the primary care setting. Prim. Care Respir. J. 2011;20:184. doi: 10.4104/pcrj.2011.00038. [DOI] [PMC free article] [PubMed] [Google Scholar]
- 17.Beecroft S, Masters N, Tutt C. Investigating the potential of hand-held expiratory flow meters in COPD screening programmes. Prim. Care Respir. J. 2011;20:359. doi: 10.4104/pcrj.2011.00085. [DOI] [PMC free article] [PubMed] [Google Scholar]
- 18.Sims EJ, Price D. Spirometry: an essential tool for screening, case-finding, and diagnosis of COPD. Prim. Care Respir. J. 2012;21:128–130. doi: 10.4104/pcrj.2012.00046. [DOI] [PMC free article] [PubMed] [Google Scholar]
- 19.Ramos M, Haughney J, Henry N, Lindner L, Lamotte M. Cost versus utility of aclidinium bromide 400 µg plus formoterol fumarate dihydrate 12 µg compared to aclidinium bromide 400 µg alone in the management of moderate-to-severe COPD. Clinicoecon. Outcomes Res. 2016;8:445. doi: 10.2147/CEOR.S107121. [DOI] [PMC free article] [PubMed] [Google Scholar]
- 20.Wilson MR, et al. Cost-effectiveness analysis of umeclidinium/vilanterol for the management of patients with moderate to very severe COPD using an economic model. Int. J. Chron. Obstruct. Pulmon. Dis. 2017;12:997. doi: 10.2147/COPD.S124420. [DOI] [PMC free article] [PubMed] [Google Scholar]
- 21.Thorn J, et al. Improved prediction of COPD in at-risk patients using lung function pre-screening in primary care: a real-life study and cost-effectiveness analysis. Prim. Care Respir. J. 2012;21:159. doi: 10.4104/pcrj.2011.00104. [DOI] [PMC free article] [PubMed] [Google Scholar]
- 22.Thorat YT, Salvi SS, Kodgule RR. Peak flow meter with a questionnaire and mini-spirometer to help detect asthma and COPD in real-life clinical practice: a cross-sectional study. NPJ Prim. Care Respir. Med. 2017;27:32. doi: 10.1038/s41533-017-0036-8. [DOI] [PMC free article] [PubMed] [Google Scholar]
- 23.Lambe T, et al. Model-based evaluation of the long-term cost-effectiveness of systematic case-finding for COPD in primary care. Thorax. 2019;74:730–739. doi: 10.1136/thoraxjnl-2018-212148. [DOI] [PMC free article] [PubMed] [Google Scholar]
- 24.Jian W, et al. Reference values for spirometry in Chinese aged 4–80 years. J. Thorac. Dis. 2017;9:4538. doi: 10.21037/jtd.2017.10.110. [DOI] [PMC free article] [PubMed] [Google Scholar]
- 25.Jordan RE, et al. Targeted case finding for chronic obstructive pulmonary disease versus routine practice in primary care (TargetCOPD): a cluster-randomised controlled trial. Lancet Respir. Med. 2016;4:720–730. doi: 10.1016/S2213-2600(16)30149-7. [DOI] [PubMed] [Google Scholar]
- 26.van Boven JF, McQueen RB, Price DB. COPD case finding: effective, but also cost-effective? Lancet Respir. Med. 2016;4:e49. doi: 10.1016/S2213-2600(16)30266-1. [DOI] [PubMed] [Google Scholar]
- 27.van Boven JF. Costs of case-finding uncovered: time to revisit COPD’s value pyramid? Thorax. 2019;74:727–729. doi: 10.1136/thoraxjnl-2019-213440. [DOI] [PubMed] [Google Scholar]
- 28.Chronic Obstructive Pulmonary Disease Committee. Chinese Medical Association. Guidelines for the diagnosis and treatment of chronic obstructive pulmonary disease (2013 revision) Chin. J. Front. Med. Sci. 2014;6:67–80. [Google Scholar]
- 29.De Marco R, et al. Incidence of chronic obstructive pulmonary disease in a cohort of young adults according to the presence of chronic cough and phlegm. Am. J. Respiratory Crit. Care Med. 2007;175:32–39. doi: 10.1164/rccm.200603-381OC. [DOI] [PubMed] [Google Scholar]
- 30.de Oca MM, et al. The chronic bronchitis phenotype in subjects with and without COPD: the PLATINO study. Eur. Respir. J. 2012;40:28–36. doi: 10.1183/09031936.00141611. [DOI] [PubMed] [Google Scholar]
- 31.Miller MR, et al. Standardisation of spirometry. Eur. Respir. J. 2005;26:319–338. doi: 10.1183/09031936.05.00034805. [DOI] [PubMed] [Google Scholar]
- 32.Pellegrino R, et al. Interpretative strategies for lung function tests. Eur. Respir. J. 2005;26:948–968. doi: 10.1183/09031936.05.00035205. [DOI] [PubMed] [Google Scholar]
- 33.Haroon S, Jordan R, Takwoingi Y, Adab P. Diagnostic accuracy of screening tests for COPD: a systematic review and meta-analysis. BMJ Open. 2015;5:e008133. doi: 10.1136/bmjopen-2015-008133. [DOI] [PMC free article] [PubMed] [Google Scholar]
- 34.Tantucci C, Modina D. Lung function decline in COPD. Int. J. Chron. Obstruct. Pulmon. Dis. 2012;7:95. doi: 10.2147/COPD.S27480. [DOI] [PMC free article] [PubMed] [Google Scholar]
- 35.Karabis A, Mocarski M, Eijgelshoven I, Bergman G. Economic evaluation of aclidinium bromide in the management of moderate to severe COPD: an analysis over 5 years. Clinicoecon. Outcomes Res. 2014;6:175. doi: 10.2147/CEOR.S57904. [DOI] [PMC free article] [PubMed] [Google Scholar]
- 36.Oostenbrink JB, Rutten‐van Mölken MP, Monz BU, FitzGerald JM. Probabilistic Markov model to assess the cost‐effectiveness of bronchodilator therapy in COPD patients in different countries. Value Health. 2005;8:32–46. doi: 10.1111/j.1524-4733.2005.03086.x. [DOI] [PubMed] [Google Scholar]
- 37.Price LC, et al. UK National COPD Audit 2003: impact of hospital resources and organisation of care on patient outcome following admission for acute COPD exacerbation. Thorax. 2006;61:837–842. doi: 10.1136/thx.2005.049940. [DOI] [PMC free article] [PubMed] [Google Scholar]
- 38.Suissa S, Patenaude V, Lapi F, Ernst P. Inhaled corticosteroids in COPD and the risk of serious pneumonia. Thorax. 2013;68:1029–1036. doi: 10.1136/thoraxjnl-2012-202872. [DOI] [PMC free article] [PubMed] [Google Scholar]
- 39.Fan C. The Cost Effectiveness Analysisof Indacaterolversus Tiotropiumin Chinese Medical Cost Setting. Drug Evaluation. 2016;13:34–39. [Google Scholar]
- 40.National Health and Family Planning Commission of the People’s Republic of China. Report On Nutrition And Chronic Diseases Of Chinese Residents (2015).
- 41.Tashkin DP, et al. A 4-year trial of tiotropium in chronic obstructive pulmonary disease. New Engl. J. Med. 2008;359:1543–1554. doi: 10.1056/NEJMoa0805800. [DOI] [PubMed] [Google Scholar]
- 42.Liu G, Dong Z, Wu J. Evaluation Guide And Introduction Of Pharmacoeconomics In China. Science Press; 2015. [Google Scholar]
Associated Data
This section collects any data citations, data availability statements, or supplementary materials included in this article.
Supplementary Materials
Data Availability Statement
The data that support the findings of this study are available from the corresponding author upon reasonable request.