

Abstract
Despite the need to monitor the impact of Cancer Immunotherapy (CI)/Immuno‐Oncology (IO) therapeutics on neoantigen‐specific T‐cell responses, very few clinical programs incorporate this aspect of immune monitoring due to the challenges in high‐throughput (HTP) generation of Major Histocompatibility Complex Class I (MHCI) tetramers across a wide range of HLA alleles. This limitation was recently addressed through the development of MHCI complexes with peptides containing a nonnatural UV cleavable amino acid (conditional MHCI ligands) that enabled HTP peptide exchange upon UV exposure. Despite this advancement, the number of alleles with known conditional MHCI ligands is limited. We developed a novel workflow to enable identification and validation of conditional MHCI ligands across a range of HLA alleles. First, known peptide binders were screened via an enzyme‐linked immunosorbent assay (ELISA) assay. Conditional MHCI ligands were designed using the highest‐performing peptides and evaluated in the same ELISA assay. The top performers were then selected for scale‐up production. Next‐generation analytical techniques (LC/MS, SEC‐MALS, and 2D LC/MS) were used to characterize the complex after refolding with the conditional MHCI ligands. Finally, we used 2D LC/MS to evaluate peptide exchange with these scaled‐up conditional MHCI complexes after UV exposure with validated peptide binders. Successful peptide exchange was observed for all conditional MHCI ligands upon UV exposure, validating our screening approach. This approach has the potential to be broadly applied and enable HTP generation of MHCI monomers and tetramers across a wider range of HLA alleles, which could be critical to enabling the use of MHCI tetramers to monitor neoantigen‐specific T‐cells in the clinic.
Keywords: 2D liquid chromatography/mass spectrometry, conditional ligand, MHCI, MHCI tetramers, neoantigen
1. INTRODUCTION
Over the past 10 years, Major Histocompatibility Complex Class I (MHCI) presentation of cancer neoantigens has emerged as the critical mode of action by which our immune system can control tumor growth. 1 , 2 , 3 , 4 , 5 Because of the role that neoantigen‐specific T cells play in killing tumors, significant resources across academia, and biotechnology have been dedicated to developing clinically active drugs that will amplify the cancer immunity cycle and improve the magnitude and breadth of the neoantigen‐specific T‐cell responses, 1 , 6 including checkpoint inhibitors, 7 cytokines, 8 TNF superfamily agonists, 9 cancer vaccines, 10 , 11 and immune modulators. 12 Despite these drug development efforts, there are very limited tools available to monitor the impact of treatment on neoantigen‐specific T‐cell responses (T‐cell phenotype, T‐cell magnitude and breadth, epitope spreading, etc.).
The most common methods for tracking T‐cell responses are ELISPOT and MHC tetramer staining. The ELISPOT assay is a functional assay that measures cytokine release from T cells upon stimulation of PBMCs with antigens. The benefits of this assay are that it is allele‐ and neoepitope‐independent (i.e., only the neoantigen needs to be known) and it is a functional readout. The drawbacks to the assay are that it is semi‐quantitative and there is no way to assess T‐cell phenotype, which could be critical to understanding factors important to generating a protective immune response. 13 MHCI tetramer‐based detection utilizes recombinant MHCI monomers multimerized into tetramers via streptavidin conjugation as neoantigen‐specific T‐cell staining reagents. This method allows for staining of multiple specificities as well as phenotype markers. 14 MHCI tetramers also allow for quantitative analysis of the exact number of neoantigen‐specific T‐cells and how this changes during the course of treatment. 2 , 15 , 16 , 17 In many respects MHCI tetramer‐based detection can therefore provide a more detailed understanding of the effect of treatment on the neoantigen‐specific CD8+ T‐cell response.
Despite the advantages of MHCI tetramer detection, this approach has not been widely adopted as a biomarker strategy across clinical programs because of challenges associated with generating reagents. MHCI tetramer generation requires a time‐consuming, multi‐day, low‐yield refold process including multiple chromatography steps. 18 Furthermore, each human has six different HLA alleles and the HLA allele is highly polymorphic (nearly 20,000 HLA class I alleles exist). 19 Additionally, not only is the neoantigen profile unique to each patient but also, 10–100 s of patient‐specific MHCI tetramers would be required to gain a complete picture of the T cell landscape in a given patient. Therefore, MHCI tetramer‐based detection of neoantigen specific T‐cell responses would require implementation of a personalized MHCI tetramer platform, which is not possible using traditional MHCI generation protocols.
Several novel methods of preparing MHCI reagents have been developed to address these limitations. One approach is to engineer stabilizing disulfides in the HLA allele to enable the formation of stable MHCI complexes in the presence of a dipeptide. 20 , 21 These disulfide‐stabilized MHCI reagents have been referred to as “empty” MHCI complexes and can be loaded with a peptide or epitope by simply adding the peptide of interest to the empty MHCI complex. This strategy has been demonstrated for both murine and human (A*02:01) MHCI complexes, and comparable tetramer staining results were reported between MHCI reagents produced using this approach and traditional refold approaches. Another method uses an allele‐specific UV‐cleavable peptide, also called a conditional MHCI ligand, to form an MHCI complex, in which the peptide binds with high affinity when intact and low affinity when cleaved. 22 This functionality enables peptide exchange upon UV exposure when MHCI complexes that have been assembled with conditional MHCI ligands, called conditional MHCI complexes, are incubated in the presence of a high‐affinity peptide binder of interest. Conditional MHCI complexes for a given HLA allele can be refolded at large scale, and the end user can then exchange the conditional MHCI ligand for any other peptide of interest. 22
Both of these methods provided a breakthrough in the quest to enable the use of personalized MHCI tetramers to monitor neoantigen specific T‐cells in the clinic. One of the major drawbacks of the “empty” MHCI is the need to identify novel engineered disulfides that stabilize the “empty” complex and dipeptides that enable the “empty” complex to refold for each different HLA allele. Similarly, one of the drawbacks of the conditional MHCI ligand approach is the need to identify and design specific peptides for each HLA allele. However, given that high‐throughput (HTP) screening of peptide binders is easier from a resource standpoint than generating multiple engineered constructs in combination with screening dipeptide stabilizers needed for “empty” MHCI, the goal of this manuscript was to further expand the repertoire of conditional MHCI ligands. To the best of our knowledge, conditional MHCI ligands have only been published for 24 HLA alleles. 22 , 23 , 24 , 25 , 26 , 27 Although these alleles are some of the most prevalent, neoantigen coverage across a broad cohort of diverse patients will still be minimal. 28 Therefore, there is a need to develop workflows to enable the expansion of allele coverage.
In addition, analytically validating MHCI complexes after refolding or peptide exchange has utilized a limited number of analytical techniques including enzyme‐linked immunosorbent assay (ELISA) assays and gel electrophoresis. 29 , 30 Although these techniques have proven useful to determine if the MHCI complex is present and for semi‐quantitative analysis of affinity and stability, several other important parameters, such as HLA:B2M ratio, aggregation, and oxidation state are not captured. Several protein analytical tools exist to evaluate these parameters, including liquid chromatography/mass spectrometry (LC/MS), 2D LC/MS and size‐exclusion chromatography/multi‐angle light scattering detection (SEC‐MALS); yet, these tools have rarely been used to characterize MHCI complexes after refold or peptide exchange.
In this paper, we describe an experimental workflow that allows for the identification and validation of new combinations of conditional MHCI ligands and HLA alleles that form stable conditional MHCI complexes. We developed and validated an ELISA assay for detection of stable conditional MHCI complexes. We initially screened five published peptide binders reported in the Immune Epitope Database and Analysis (IEDB) across six HLA alleles (A*02:03, A*26:01, B*18:01, B*35:03, C*02:02, C*14:02) and designed conditional MHCI ligands based on the top binders. The conditional MHCI ligands were then screened in the ELISA assay, and the top performers were selected for scale‐up production. For MHCI production, a novel MHCI purification and biotinylation protocol was developed, and next‐generation analytical techniques were used to confirm the quality of generated complexes. These methods were further applied to characterize the conditional MHCI complexes generated with the newly identified conditional MHCI ligands. Finally, we verified peptide exchange with validated peptide binders after UV exposure using 2D LC/MS. In summary, we developed a validated workflow to identify conditional UV peptides for new HLA alleles that can be broadly applied in order to greatly expand HLA allele coverage, which could be critical to enabling the use of MHCI tetramers to monitor neoantigen‐specific T cells in the clinic.
2. MATERIALS AND METHODS
2.1. Protein expression and purification
HLA and B2M sequences were obtained from Uniprot.org. DNA encoding the signal sequence of HLA and B2M and the extracellular domain of HLA and full length of B2M was synthesized and subcloned into a pET expression vector under the control of the T7 lac promoter. Recombinant HLA and B2M were overexpressed in Escherichia coli, purified from inclusion bodies, and stored in denaturing buffer (6 M Guanidine HCl, 25 mM Tris pH 8) at −80°C. After induction of expression, B2M and HLA biomass pellets were resuspended in lysis buffer (PBS + 1% Triton X‐114) at 5 mL/g and homogenized twice in a microfluidizer at 1000 bar. The homogenized suspension was then spun at 30,000 g for 20 min in an ultracentrifuge. The pellets were collected, washed with 500 mL of 0.5% Triton X‐114 in PBS, and centrifuged at 30,000g for 20 min. The pellet was collected again and washed a second time as described above. The purified inclusion bodies were dissolved in a denaturing buffer (20 mM MES, pH 6.0, 6 M Guanidine) at a concentration of 10 mL/g and stirred at 4°C overnight. The dissolved pellet was centrifuged at 40,000g for 60 min and the supernatant was collected and filtered through a 0.22 μm filter. The concentration was determined by UV–Vis at 280 nm using the protein's extinction coefficient. Samples were then snap‐frozen and stored at −80°C prior to generation of MHCI complexes.
2.2. Peptide selection for screening
Peptides for the initial binding screens were selected from the Immune Epitope Database and Analysis Resource (https://www.iedb.org). The peptide binders identified in the database were sorted based on affinity, and five peptides with the highest measured affinity were selected. In cases where the peptide sequences were similar for the top 5 (differing by less than four amino acids), the next highest affinity peptides with unique sequences were selected to ensure maximal peptide diversity in the screen (Table S1).
2.3. MHCI refold (small scale)
Recombinant HLA alleles and β2M were over‐expressed in E. coli, purified from inclusion bodies, and stored under denaturing conditions (6 M Guanidine HCl, 25 mM Tris pH 8) in −80°C as described above. In a 200 μL reaction, the peptide (0.01 mM, per well), oxidized and reduced glutathione (0.5 mM and 4.0 mM, respectively), recombinant HLA alleles (0.03 mg/mL) and β2M (0.01 mg/mL) were all combined in a 96‐well plate. Refolds were performed with five different peptides for each HLA of interest as described above (Supplemental Table S1), and the MHCI complex was incubated at 4°C for 3–5 days to allow refolding. MHCI complex refolds were also performed in the absence of a peptide and used as the negative control to calculate the signal to noise (S/N) for the experimental peptides. Given that there should have been minimal properly refolded complex in the absence of a peptide, these samples provided the overall background of the assay to calculate the S/N value. HLA‐A*02:01 refolded with the CMV pp65 viral epitope was used as a positive control. Peptides yielding the highest signal to noise ratio (S/N) were selected for further analysis.
After identifying the most stable peptide binder based on the ELISA analysis for each HLA allele, peptides were redesigned with a UV‐cleavable amino acid (denoted “J”) at different positions along the peptide sequence (Table S2). In brief, variants of the most stable peptide binders identified in the initial screen were redesigned in which the J amino acid was substituted at positions 2, 4, 6, and 8, relative to the N terminus. Formation of stable conditional MHCI complexes upon refolding with the redesigned peptides were identified by ELISA as described above. The conditional MHCI ligands resulting in the most stable complex based on the ELISA assay readout were used for scaled‐up MHCI production. The original peptide (containing no UV amino acid substitution) was used as a positive control. All peptides used here were purchased from JPT (https://www.jpt.com) or ELIM Biopharm (www.elimbio.com).
2.4. ELISA assay
Two different ELISA assays were evaluated to optimize the sensitivity of the assay. In the first assay format, the refolded MHCI was captured with anti‐B2M antibody and detected with pan ABC anti‐HLA antibody (clone W6/32). In the second assay format, MHCI was captured with the pan ABC anti‐HLA antibody (clone W6/32) and detected with the anti‐B2M antibody. In both assays, a 384‐well Nunc Maxisorp plate (Thermo Fisher Scientific, Waltham, MA) was coated with 25 μL/well of capture antibody, mouse IgG1 anti‐human B2M (BioLegend, San Diego, CA) or mouse IgG2a anti‐HLA ABC clone W6/32 (Novus Biological, Littleton, Co.), at 8 μg/mL in coating buffer (0.05 Sodium Carbonate pH 9.6). After overnight incubation at 4°C, the plate was washed 3 times with wash buffer (PBS, 0.5% Tween 20). The plate was then blocked with 50 μL/well of Block buffer (PBS, 0.5% BSA, 10 ppm Proclin) and incubated at room temperature (RT) with agitation for 1 h. After washing the plate 3 times with wash buffer, 25uL/well of the unpurified refolded MHC complex at 40 μg/mL with and without peptides in Assay diluent (PBS, 0.5% BSA + 0.05% Tween20 + 10 ppm Proclin) was added to the plate and incubated for 1 hour at RT. The plate was washed 6 times and 25 μL of biotinylated mouse IgG2a anti‐HLA ABC clone W6/32 (Novus Biological, Littleton, Co.) (assay format 1) or biotinylated mouse IgG1 anti‐human B2M (BioLegend, San Diego, CA) (assay format 2) at 100 ng/mL in assay diluent was added to each well. After a 1 h incubation at RT and six washes, 25 μL/well of Streptavidin‐Horseradish Peroxidase (GE, Marlborough, MA) was added to the plate and incubated for 30 min at RT. The color reaction was developed with TMB peroxidase substrate (Moss, Pasadena, MD) at RT for 15 min, and the reaction was stopped with 1 M phosphoric acid. The OD absorbance values were measured at a wavelength of 405 nm with a reference at 620 nm. Refolded MHC monomers without peptide were included in each assay to measure the background of the assay and calculate the signal to noise (S/N) of the experimental peptides.
2.5. MHCI‐peptide refold, biotinylation, and purification (large scale)
In a 1, 5, or 15 L reaction, the selected peptide (0.01 mM), oxidized and reduced glutathione (0.5 mM and 4.0 mM, respectively), recombinant HLA (0.03 mg/mL) and β2M (0.01 mg/mL) were combined in refold buffer (100 mM Tris, pH 8.0, 400 mM L‐Arginine, 2 mM EDTA). The refold mixture was then stirred for 3–5 days at 4°C, filtered through a 0.22 μm filter, and concentrated and buffer exchanged by tangential flow filtration (TFF) (Millipore P2C010C01) into 25 mM Tris pH 7.5. The protein components were analyzed by LC/MS to ensure that the HLA was in the appropriate reduced state. The concentrated and refolded MHCI complex was then biotinylated through the addition of BirA (1:50 [wt:wt] enzyme:MHCI), 100 mM ATP and 10X reaction buffer (100 mM MgOAc, 0.5 mM biotin). The biotinylation reaction was mixed for 2 h at room temperature. The sample was dialyzed and analyzed by LC/MS to quantify biotinylation. The biotinylated MHCI complex was purified by anion exchange chromatography on an AKTA Avant FPLC using a 1 or 5 mL HiTrap Q HP column, depending on the reaction size. The column was equilibrated with 10 column volumes (CV) of 25 mM Tris–HCl pH 7.5 at a flow rate of 5 mL/min. The MHCI complex was loaded on the column at a 5 mL/min flow rate and eluted using 0–60% gradient of buffer B (2.5 mM TrisHCl, pH 7.5, 1 M NaCl) over 30 CV. Fractions across the eluted peak were run on SDS‐PAGE, and fractions containing both B2M and HLA bands were pooled. Pooled fractions were buffer‐exchanged into storage buffer (25 mM Tris HCl, pH 8.0, 150 mM NaCl). Protein concentration was determined by UV absorbance at 280 nm, and samples were snap‐frozen and stored at −80°C.
2.6. Liquid chromatography/mass spectrometry (LC/MS) analysis
Between 2 and 5 μg of MHCI complex was injected on an AdvanceBio RP‐mAb diphenyl column, 2.1 x 75 mm, 3.5 μm (Agilent). The column was heated to 80°C and exposed to a gradient of 25–40% mobile phase B in 2.0 min at 0.8 mL/min. Mobile phase A was 0.05% TFA in water. Mobile phase B was 0.05% TFA in acetonitrile. The column eluent was sent to an Agilent 6230 ESI‐TOF LC/MS for mass spectrometry data acquisition.
In order to quantitate MHCI concentration and molar ratios of B2M to HLA, standard curves of B2M and HLA alleles were generated by injecting known amounts of each protein using the method described above. Peak areas at A280 were used to generate standard curves that allowed for the quantitation of the individual protein subunits in MHCI complexes. HLA and B2M masses were deconvoluted using the MassHunter Qualitative Analysis software (Agilent).
2.7. Size exclusion chromatography‐multi angle light scattering (SEC‐MALS) analysis
The MW of the MHCI complex was determined as described previously. 31 Briefly, samples at ~2 mg/mL were injected (10 μl for A*02:01 MHC; 25 μl for other MHCI alleles) onto a TSKgel SW3000 Analytical SEC column (Tosoh Bioscience), with isocratic gradient of phosphate buffered saline (PBS pH 7.2 with an additional 150 mM NaCl) at ambient temperature, coupled to a multi‐angle light scattering system (MALS) (Wyatt Instruments) to measure molar mass.
2.8. 2D LC/MS analysis
A two‐dimensional liquid chromatography mass spectrometry (2D LC/MS) method was used to characterize peptide binding to MHCI complexes. Between 2 and 3 μg of MHCI complexes were injected on the instrument and sent to the first dimension column. The first dimension LC method employed an analytical size exclusion column (SEC) (Agilent AdvanceBio SEC 300 Å, 2.7 μm, 4.6 x 15 mm) to separate intact complex from excess peptide run at an isocratic flow of 0.7 mL/min in 25 mM TRIS pH 8.0, 150 mM NaCl for 10 min with signal acquisition at 280 nm. A sampling valve collected the entirety of the complex peak that eluted between 1.90 and 2.13 min in a volume of 160 μL and injected it onto the second dimension reversed phase column (Agilent PLRP‐S 1000 Å, 8 μm, 50 x 2.1 mm). The second dimension column was exposed to a gradient of 5–50% mobile phase B in 4.7 min at 0.55 mL/min with the column heated to 80°C. Mobile phase A was 0.05% TFA. Mobile phase B was 0.05% TFA in acetonitrile. The column eluent was sent to an Agilent 6224 ESI‐TOF LC/MS for mass spectrometry data acquisition (Agilent Mass Hunter).
3. RESULTS AND DISCUSSION
3.1. ELISA‐based analysis of MHCI refold
One of the main objectives of this manuscript was to develop a robust HTP workflow for the identification of peptides containing a nonnatural UV cleavable amino acid (conditional MHCI ligand) that could form a stable conditional MHCI complex. The first step in this process was to develop an ELISA assay that could measure the formation of a stable MHCI complex after a refold screen. The HTP refold protocol involved mixing denatured recombinant HLA (0.03 mg/mL), β2M (0.01 mg/mL), peptide (0.01 mM), oxidized and reduced glutathione (0.5 and 4.0 mM, respectively) in a 200 μL reaction within a 96‐well plate and allowing the refold reaction to proceed for 3–5 days at 4°C in a deli fridge before ELISA analysis. Since the HLA components are not biotinylated at this stage, we could not use the widely published streptavidin‐based ELISA. 22 We instead evaluated two formats: 1) capture with anti‐B2M and detection with anti‐HLA and 2) capture with anti‐HLA (clone W6/32) and detection with anti‐B2M. In both cases, the detection antibody was labeled with biotin, and signal generation was induced after the addition of streptavidin‐HRP and substrate. CMV pp65 peptide and HLA‐A*02:01 were used for these initial screens. S/N values were calculated using MHCI complexes refolded in the absence of a peptide (no peptide control) as a measure of the background of the assay. Although the signal and detection range were comparable for both formats, the S/N values were much higher for format 2 (Figure 1(a), black bars) than format 1 (Figure 1(a), white bars) at concentrations above 0.25 μg/mL. We believe the higher specificity of format 2 is because the capture step uses an anti‐HLA antibody that recognizes a conformational epitope on MHCI and should be selective for only properly folded MHCI. In contrast, the anti‐B2M capture is not dependent on properly folded MHCI and will capture complexes with properly folded HLA as well as partially denatured HLA, which we believe accounts for the higher detection signal for no peptide control of format 1. Based on these findings, we selected format 2 for the remaining screens.
FIGURE 1.
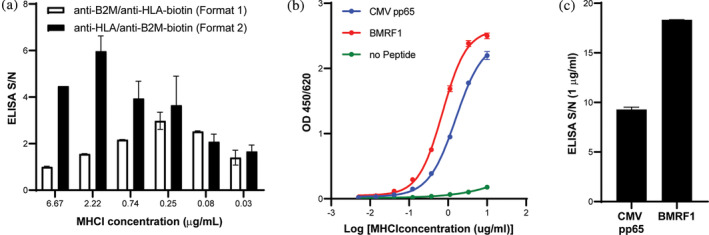
ELISA assay development. (a) Comparison of ELISA formats. S/N values at MHCI concentration of 0.03–6.67 μg/mL for CMV pp65 and HLA‐A*02:01. (b) ELISA analysis of HLA‐A*02:01 after small scale refold with CMV pp65 (blue line), BMRF1 (red line) and no peptide (green line) for ELISA format 2. ELISA analysis was run at MHCI concentrations ranging from 0.005 to 3.33 μg/mL. (c) ELISA S/N values for ELISA Format 2 with MHCI complexes assembled with CMV pp65 and BMFR1 peptides and HLA‐A*02:01 at an MHCI concentration of 1 μg/mL
Figure 1(b) shows the ELISA results as a function of MHCI or MHCI‐peptide concentration with ELISA format 2 as described in the materials and methods using MHCI molecules refolded with CMV pp65 (blue line) peptide, BMRF1 peptide (red line) and no peptide (green line) (background control). As the MHCI concentration was increased, we observed an increase in the OD450/620 ELISA signal for both the CMV pp65 and BMRF1 peptides but little to no increase in signal for the no peptide control, which is consistent with the detection of properly refolded MHCI complex. Figure 1(c) shows the S/N of the ELISA analysis using the no peptide control as background at a MHCI concentration of 1 μg/mL for both CMV pp65 and BMRF1. Both antigens had a signal that was ten‐fold greater than background, demonstrating that this assay format produces highly sensitive S/N and can be readily used to identify antigens that can form a stable MHCI complex during the refold step. In addition, the standard deviations were very small (Figure 1(b), (c)) indicating that the assay is highly reproducible for a given experiment and can be used to reliably select optimal peptides without the need to perform the assay in duplicate. The goal of assay optimization was to develop an assay that was highly reproducible and did not require running in duplicate or triplicate to ease screening of 100 s of alleles and based on these results we believe this has been achieved.
3.2. Identification of peptide binders and conditional MHCI ligands across HLA alleles
Peptides were selected from IEDB (Table S1). The ability of these peptides to form a stable MHCI complex with the corresponding HLA allele was analyzed using the ELISA assay described above. Titration curves for the refolded MHCI complexes generated with the five peptides and HLA‐A*02:03 are shown in Figure 2(a). The assay was performed at MHCI concentrations ranging from 0.1 to 3.0 μg/mL and, as observed for the positive controls in Figure 1(b), there was an increase in the ELISA OD at increasing MHCI concentrations and the signal began to saturate above 1 μg/mL. In addition, we observed only a minimal increase in signal for the negative control across the titration range. The 1.0 μg/mL concentration was selected to compare the S/N ELISA values for the A*02:03, B*35:01, and C*02:02 alleles because it was slightly below saturation (EC60‐EC85 depending on peptide‐HLA combination) (Figure 2(b)–(d)). The S/N background for the five peptides screened against A*02:03 was relatively high, with values ranging from 20 to 40. This suggests that all peptides selected from IEDB were not only binders, but could also form stable MHCI complexes upon refolding. The A*02:03‐02 peptide yielded the highest S/N value and was selected for the design of UV peptides. For B*35:03, the S.N value from the selected peptides also had a relatively high S/N background, ranging from 6.75 to 7.25 (Figure 2(c)). B*35:03‐04 yielded the highest OD value and was subsequently selected to design candidate conditional MHCI ligands. The S/N values for the C*02:02 peptides were all between 18 and 20 except C*02:02‐02, which was much lower (~8) (Figure 2(d)). C*02:02‐03 yielded the highest S/N value and was selected to design candidate conditional MHCI ligands. A*26:01, B*18:01, and C*14:02 were also tested and similar results were observed (Figure S1). Although the S/N for all alleles tested was relatively high and provided confidence that the assay was identifying peptides that formed a stable complex, there were significant differences in the magnitude of the S/N signal across the alleles. We believe these results are likely due to the variability in the affinity of the pan‐HLA antibody for the different HLA alleles. In contrast, the variability within a given allele (e.g., A*02:03 and C*02:02) was likely due to difference in peptide affinity across the different peptides screened.
FIGURE 2.
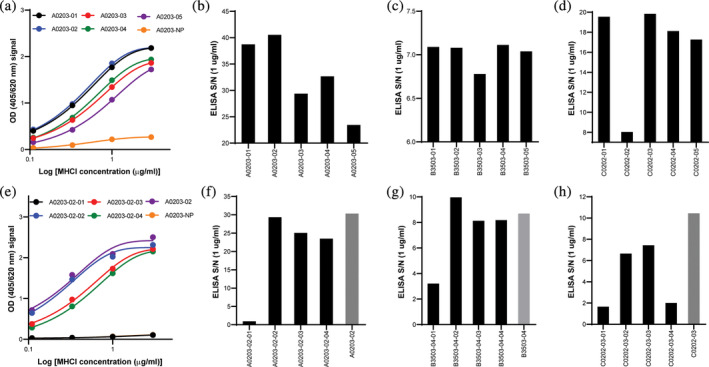
Identification of candidate conditional MHCI ligands for A*02:03, B*35:03 and C*02:02. (a) OD values for the five peptides screened with A*02:03 at various concentrations (0.1–3 μg/mL). S/N ELISA values for (b) A*02:03, (c) B*35:03 and (d) C*02:02 MHC complexes with selected peptides at 1 μg/mL. (e) OD values for the four conditional MHCI ligands derived from peptide A02:03‐02 screened with HLA‐A*02:03 at various concentrations. S/N values for (f) HLA A*02:03, (g) B*35:03‐05 and (h) C*02:02‐03 MHC complexes with the selected conditional MHCI ligands derived from the peptides identified in (b), (c), and (d). Peptides not containing the engineered J amino acids (parent peptide) were used as internal controls (gray bars). For all assays, the no peptide (NP) was used as a negative control
Variants of the top‐performing peptides in the initial screen (i.e., A0203‐02, B3503‐04, and C0202‐03) (Figure 2(b)–(d)) were designed with a UV‐cleavable amino acid (denoted J) substituted at positions 2, 4, 6, and 8 from the N terminus to identify UV‐peptides that form stable complexes across the different HLA alleles. A titration curve of MHCI complexes assembled with the four conditional MHCI ligands screened derived from the A0203‐02 peptide are shown in Figure 2(e). As was observed for the nonUV cleavable peptides, an increase in the ELISA OD was observed with increasing MHCI concentration and the values started to saturate at 1 μg/mL (Figure 2(e)). The ELISA S/N for all conditional MHCI ligands across the different alleles is shown in Figure 2(f)–(h). All conditional MHCI ligand variants with J amino acid substitution at position 2 showed very low S/N ELISA values (Figure 2(f)–(h)), indicating minimal or no MHC complex formation (A0203‐02‐01, B3503‐05‐01, C0202‐03‐01, and C0202‐03‐04) relative to the parent peptide (gray bar Figure 2(f)–(h)). This finding was expected since this position is known to be a MHCI‐peptide anchor position. 32 , 33 All other conditional MHCI ligands screened for A0203‐02 and B3503‐04 yielded S/N values similar to the parent peptide (Figure 2(f), (g)). In contrast, all conditional MHCI ligands for C0202‐02 had lower OD values when compared to the parent; however, the S/N for C0202‐02‐02 and C0202‐02‐03 were still relatively high at 6 and 8, respectively (Figure 2(h)), indicating that the UV cleavable amino acid had a slightly negative impact on MHCI stability. The conditional MHCI ligands resulting in the highest S/N value (A0302‐02‐02, B3503‐04‐02 and C0202‐03‐03) were then selected for scaled‐up production. A similar analysis was performed to identify optimal conditional MHCI ligands for A*26:01, B*18:01, and C*14:02 alleles (Figure S1).
3.3. Scaled‐up refold and purification of MHCI monomers
Generation of recombinant MHCI complexes through refolding of denatured B2M and HLA purified from E. coli inclusion bodies in the presence of the peptide of interest was initially developed over 20 years ago. 18 Since this initial report, there have been many studies and methods developed for generation and purification of MHCI complexes using a refold protocol. The vast majority of these methods include some variation of the following process: (1) mix HLA and B2M with peptide in generic refold buffer with redox/oxidation agents (incubation time may vary from 1 to 5 days), (2) filter refolded material to remove aggregates, (3) concentrate down to volume compatible with size exclusion chromatography (SEC) (1–2 mL depending on the column), (4) purify using SEC, (5) biotinylate purified refolded MHCI complex, and (6) purify of MHCI complex after the biotinylation reaction (SEC, spin column filters, etc.). 18 , 22 , 27 , 34 , 35 , 36 , 37 , 38 The majority of these production methods are only practical at a 1 L scale or smaller and yield only a few milligrams of refolded material; therefore, numerous production runs would be required to produce sufficient material for use in supporting a clinical program. Multiple runs could potentially result in lot‐to‐lot variability, which may confound interpretation of downstream tetramer staining data. To address these limitations, we developed a novel workflow to enable MHCI refold and purification to be scaled up to 15 L.
A schematic of the refold and purification protocol developed in this study is shown in Figure 3. For method optimization, the published HLA‐A*02:01 specific conditional MHCI ligand were used. 22 The primary limitation to scaled‐up production is the need for an SEC purification step, which requires highly concentrated samples. In addition, the biotinylation step is typically performed on purified refolded MHCI complexes and requires a secondary purification step, which further limits scaled‐up production. To address these limitations, we developed a three‐step production process that includes the refold reaction, in‐process biotinylation, and anion exchange chromatography purification (Figure 3). LC/MS analysis of the HLA component of the MHCI complex before and after the biotinylation step is shown in Figure 4(a). The black line shows the HLA protein before biotinylation. Two peaks were observed at 34,812 and 34,943 Da, which correspond to the HLA protein with and without the N‐terminal methionine group. These two populations are likely caused by incomplete modification and subsequent removal of formylmethionine and the N‐terminal methionine by formylmethionine deformylase and methionine aminopeptidase (MAP), respectively, which can vary depending on the adjacent amino acids, and in some cases the N‐terminal methionine is not removed. 39 Therefore, it is likely that the N‐terminal HLA sequence was not ideal for total MAP activity, so only partial N‐terminus removal was observed. After biotinylation, we observed an increase in the mass for both peaks of ~244 Da, which corresponds to the mass of biotin (Figure 4(a)). No residual peaks were observed at the nonbiotinylated masses, indicating 100% biotinylation. These combined results demonstrate the feasibility of adopting an in‐process biotinylation step to eliminate the need for two purification steps.
FIGURE 3.
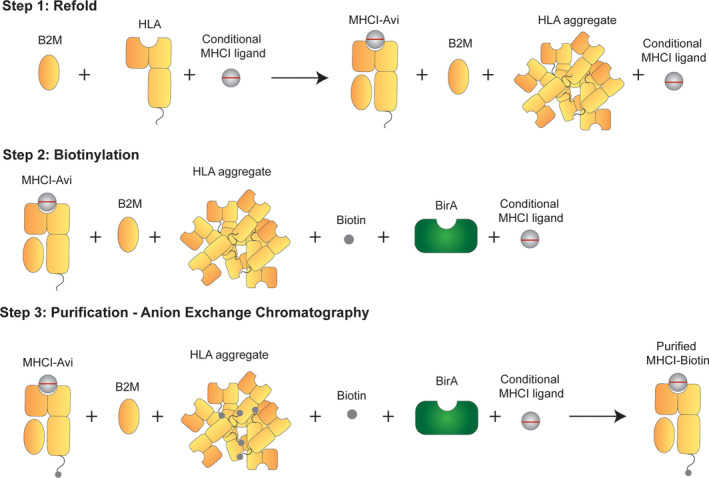
Schematic of scaled‐up production of A*02:01 MHCI monomer. The first step in the protocol developed for scaled‐up production of MHCI complexes is to mix all refold components and allow the refold to occur. The second step is in‐process biotinylation, followed by anion exchange chromatography in the third step
FIGURE 4.
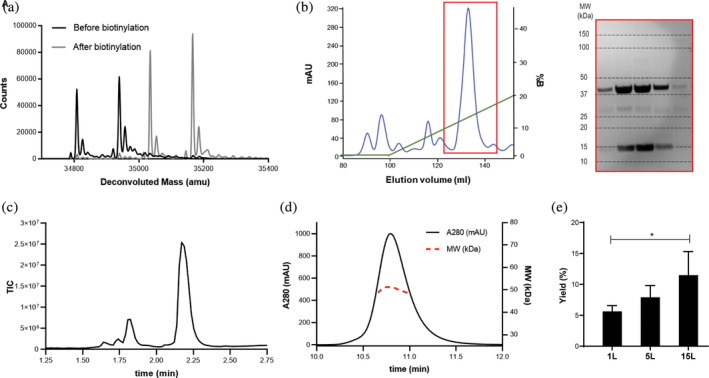
Biotinylation analysis, purification, and characterization of scaled‐up, refolded A*02:01 MHCI monomer. (a) LC/MS analysis of the HLA allele in the refolded MHCI reaction mixture before (black line) and after (gray line) biotinylation. The two peaks correspond to the full‐length HLA and truncated HLA with N‐terminal cleavage of the methionine. The shift in both peaks after biotinylation corresponds to the MW of biotin. (b) Anion exchange chromatogram of the biotinylated MHCI complex after refold and SDS‐PAGE analysis of the fractions collected in the red highlighted box. The MW of the SDS‐PAGE bands correspond to B2M (13 kDa) and HLA (37 kDa). (c) LC/MS TIC chromatogram of the purified MHCI complex. The peaks at 1.625 and 1.74 min correspond to the UV‐peptide and the peaks at 1.8 and 2.2 min correspond to B2M and HLA, respectively. (d) SEC‐MALS analysis of the purified MHCI complex. The black line corresponds to the A280 chromatogram (left y axis) and the red line corresponds to the MW analysis (right y axis). (e) MHCI % yields (mg purified MHCI/mg MHCI in refold*100) ± standard deviation (N = 3) after purification at the 1, 5, and 15 L scale
After completion of the biotinylation step, the resulting biotinylation reaction was buffer exchanged into 25 mM Tris (pH 8.0) and prepared for purification via anion exchange chromatography. Anion exchange was selected for purification over SEC because it is amenable to direct loading of the large volumes used during the biotinylation step (10–100 mL). A representative Q‐HP anion chromatogram and gradient for a 1 L refold is shown in Figure 4(b). A large peak was observed at an elution volume of ~130 mL with several smaller peaks, likely representing minor contaminants from the inclusion body purification. Fractions from the major peak were run on an SDS‐PAGE gel, and bands corresponding to the expected MW for HLA‐A*02:01 and B2M were observed across the peak (Figure 4(b)). Fractions were pooled based on the presence of bands at the expected molecular weights for HLA and B2M in the SDS‐PAGE analysis and run on LC/MS and SEC‐MALS. The TIC chromatogram of the purified biotinylated MHCI complex is shown in Figure 4(c). The two adjacent peaks at a retention times of 1.7 and 1.75 min corresponded to the R and S diasteromers of the conditional MHCI ligand resulting from the use of a racemic UV amino acid. The peaks at retention times of 1.8 min and 2.2 min correspond to B2M and HLA‐A*02:01, respectively. Standard curves of both B2M and HLA‐A*02:01 were generated, and the area under the curve was used to quantify the molar concentration and molar ratios of B2M to HLA. If the refold process resulted in the proper pairing of B2M to HLA, the molar ratios of the two components should be close to 1. For this preparation, the ratio was calculated to be 0.95, suggesting proper pairing. The MHCI complex was further analyzed by SEC‐MALS for native mass analysis to further confirm proper 1:1 HLA:B2M pairing and monodispersity of the sample. The A280 SEC chromatogram peak was highly symmetric, indicative of a homogeneous and monodisperse protein sample, and no aggregate peak was observed (Figure 4(d)). The MW across the MHCI peak ranged from 48.8 to 51.3 kDa (Figure 4(d), red dashed line) and the average value was 49.1 kDa, close to the expected MW of the MHCI complex (48.1 kDa). The collective LC/MS and SEC‐MALS analyses suggest that the refold and purification protocol yielded a highly pure and properly folded MHCI complex.
One of the primary goals of developing a novel purification workflow was to enable scaled‐up production. To test scalability, the optimized 1 L (40 mg of HLA and B2M starting material) protocol was performed at the 5 L (200 mg) and 15 L (600 mg) scales. The refold was quantified at these production scales by calculating the mass of final purified refolded material relative to the mass of material added to the refold reaction (% yields ± standard deviations) (Figure 4(e)). Interestingly, we observed a gradual increase in average % yield as the process was scaled up from 1 L (~6%) to 5 L (~8%) to 15 L (~11%) and the difference in yield between the 1 L and 15 L scale was found to be statistically significant (p‐value<0.05). The amount of MHCI complex generated from the 1 L scale and 15 L scale was ~2.4 mg and ~ 60 mg, respectively, which corresponds to a 25‐fold increase in material generation per refold at the 15 L scale. These combined findings demonstrate the feasibility of scaling up the production and purification of MHCI complexes using the workflow described in this study.
3.4. Scaled‐up production and peptide exchange analysis of six MHCI monomers with UV peptides identified from the HTP screen
The refold and purification protocol described above was applied to the large‐scale production of MHCI complexes with the conditional MHCI ligands identified in the HTP screen. The Q‐HP anion chromatograms of all six constructs and corresponding SDS‐PAGE of pooled fractions are shown in Figure S2A‐S2F. The chromatograms for these refolds are very similar to HLA‐A*02:01 (Figure 4(b)), with clear HLA and B2M bands in the SDS‐PAGE. The pooled fractions for each HLA allele were run on SDS‐PAGE, and bands corresponding to HLA and B2M were observed with high purity (Figure 5(a)). The % yields for the 1 L refold varied from sample to sample, where A*02:03, B*18:01, and C*02:02 had the highest yields, ranging from 8% to 11%, followed by B*35:03 (~5%), C*14:02 (~4%) and A*26:01 (~2.5%) (Figure 5(b)). This variability is likely due to differences in amino acid sequence content and susceptibility to aggregation during refold as well as the ability of the peptide to form a stable complex. Although there was variability, the lowest yield of 2.5% still produced 1 mg of material from a 1 L refold and this could scale to >15 mg at the 15 L scale, which is sufficient to cover >30,000 tetramer stains.
FIGURE 5.
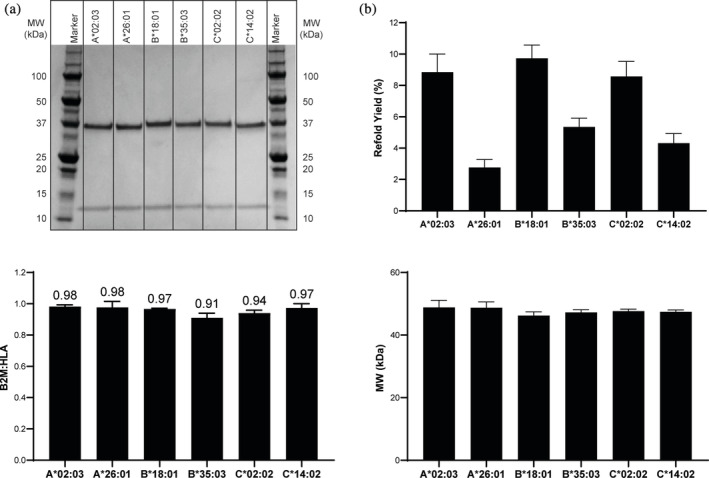
Scale up production, purification and characterization of conditional MHCI complexes. (a) SDS‐PAGE analysis, (b) Average refold % yield (mg purified MHCI/mg MHCI in refold*100) ± standard deviation (N = 3), (c) Average B2M to HLA ratio ± standard deviation (N = 3) and (d) Average SEC‐MALS MW analysis ± standard deviation (N = 3) of purified refolded MHCI complexes generated with the conditional MHCI ligands identified in the small scale screen
LC/MS and SEC‐MALS analyses were performed to further evaluate the quality of these MHCI monomers and assess whether the B2M and HLA were properly paired. The results of the LC/MS analysis of the B2M:HLA ratio across the six alleles is shown in Figure 5(c). As was observed for the HLA‐A*02:01 MHCI complex, the B2M:HLA ratios for all these samples were close to 1. The MHCI complex was further analyzed by SEC‐MALS for intact native state mass analysis. The average MW across the MHCI peak for all six MHCI complexes analyzed is shown in Figure 5(d). The MW for all six constructs ranged from 47.4 to 48.8 kDa, which is well within the expected mass range of these complexes (47.5–48 kDa). These combined findings demonstrate that not only was the refold protocol and purification workflow broadly applicable, but also that the conditional MHCI ligands identified in the small‐scale HTP assay were able to form stable MHCI complexes upon scale‐up.
In addition to identifying novel conditional MHCI ligands that could be used for scaled‐up production of MHCI monomers, we also wanted to demonstrate that these complexes could undergo peptide exchange upon UV exposure to enable HTP generation of MHCI complexes. One of the most widely used methods to measure peptide exchange of the conditional MHCI ligands after UV exposure is ELISA. 22 , 27 , 40 , 41 Although this assay has proven valuable in demonstrating peptide exchange upon UV exposure, the assay is semi‐quantitative and does not provide a direct measurement of the exchanged peptide, nor does it allow for quantification of the cleaved peptide. To address these limitations, we developed a 2D LC–MS analysis method for direct quantification of the peptide loaded into the complex during the exchange process. A schematic of the assay is shown in Figure 6(a). The first step (first dimension) in this method is injection of the peptide exchange reaction mixture (MHCI complex after exposure to UV + 100‐fold molar excess of exchanged peptide) on an analytical SEC column, which enables collection of the MHCI complex without excess peptide by a sampling valve. The second step (second dimension) is injection of the material collected from the MHCI peak onto RP‐HPLC. The organic phase of the RP‐HPLC step results in dissociation and denaturation of the HLA, B2M and peptide contained within the complex, which enables analysis and quantitation of the individual components of the MHCI complex by reading the Absorbance at 280 nm and LC/MS. An example of the first dimension SEC chromatogram of peptide exchange for the control HLA‐A*02:01 conditional MHCI ligand with the CMV pp65 epitope is shown in Figure 6(b). The chromatogram shows one dominant peak corresponding to the MHCI complex. A fluctuation in the chromatogram A280 signal was consistently observed between 2.5 and 3 min, which corresponds to the opening and closing of the sampling valve. Since there is a large pressure difference between the first and second dimension, this fluctuation is likely associated with the sudden change in pressure as the valve opens and closes. An example of the A280 chromatogram for the second dimension HPLC step is shown in Figure 6(c). The HLA and B2M peaks are clearly visible, but no A280 peak for the CMV pp65 peptide or conditional MHCI ligand are observed because they do not contain any tryptophan or tyrosine residues and thus no inherent A280 absorbance. To analyze the peptide composition, the extracted ion chromatograms for the exchange peptide and uncleaved conditional MHCI ligand were generated (Figure 6(d)). As expected, we observed a large peak corresponding to the CMV pp65 peptide, indicating successful peptide exchange. However, very low levels of the intact conditional MHCI ligand were also observed. This result suggests that either the purified peptide has a synthesis‐derived contaminant with a similar mass as the conditional MHCI ligand that complexes to the MHCI molecule and is carried through the 2D LC/MS analysis or a small fraction of the conditional MHCI ligand is protected from UV cleavage when they are in the complex. This peak is also observed when the peptide alone is cleaved in the absence of MHCI, suggesting that this is a contaminant. Regardless, the relative fraction of intact conditional MHCI ligand was very low (~1%) and should have minimal impact on downstream tetramer staining. The same analysis was performed to verify the presence of cleaved conditional MHCI ligand, and no peaks were detected. By adopting a 2D LC/MS assay to analyze peptide exchange, we were able to measure how the peptide content in the MHCI complex changes during the peptide exchange process. We believe this is a powerful tool that can be used to better understand the parameters relevant to peptide exchange, which cannot be quantified using other traditional methods such as ELISA.
FIGURE 6.
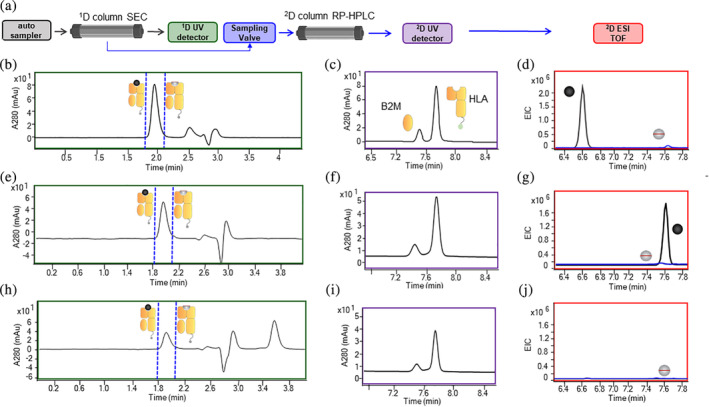
2D LC/MS analysis of peptide exchange. (a) Schematic of the 2D LC/MS workflow. (b) A280 nm SEC chromatogram of the first dimension in the 2D LC/MS analysis of HLA‐A*02:01 MHCI complex after exchange with CMV pp65. The blue dotted line defines the region that was collected and injected into the second column. (c) A280 nm SEC chromatogram of the second dimension in the 2D LC/MS analysis of HLA‐A*02:01 MHCI complex after exchange with CMV pp65. (d) EIC chromatogram of the exchange peptide (black line) and conditional MHCI ligand (blue line) in the second dimension in the 2D LC/MS analysis of HLA‐A*02:01 MHCI complex after exchange with CMV pp65. (e) A280 nm SEC chromatogram of the first dimension in the 2D LC/MS analysis of A*02:03 MHCI complex after exchange with A0203‐05 peptide. The blue dotted line defines the region that was collected and injected into the second column. (f) A280 nm SEC chromatogram of the second dimension in the 2D LC/MS analysis of A*02:03 MHCI complex after exchange with A0203‐05 peptide. (g) EIC chromatogram of the exchange peptide (black line) and conditional MHCI ligand (blue line) in the second dimension in the 2D LC/MS analysis of HLA‐A*02:03 MHCI complex after exchange with A0203‐05 peptide. (h) A280 nm SEC chromatogram of the first dimension in the 2D LC/MS analysis of A0*02:03 MHCI complex after exchange with a known nonbinding peptide. The blue dotted line defines the region that was collected and injected into the second column. (i) A280 nm SEC chromatogram of the second dimension in the 2D LC/MS analysis of A*02:03 MHCI complex after exchange with nonbinding peptide. (g) EIC chromatogram of the exchange peptide (black line) and conditional MHCI ligand (blue line) in the second dimension in the 2D LC/MS analysis of HLA‐A*02:03 MHCI complex after exchange with irrelevant peptide
This method was then used to assess peptide exchange with the MHCI complexes generated using the scaled‐up production workflow with the novel conditional MHCI ligands identified in the HTP small‐scale assay. For each MHCI complex, 4–5 peptides that were found to be binders in the small‐scale HTP screen (Figure 2(b)–(d), S1A–S1C) and 1 known nonbinding peptide were used as positive controls and a negative control, respectively. The first dimension SEC chromatogram for HLA‐A*02:03 with peptide A0203‐05 showed a clear single peak (Figure 6(e)). The second dimension HPLC A280 chromatogram of the peptide exchanged complex also shows the expected B2M and HLA peaks (Figure 6(f)). In the EIC analysis of the second dimension, a large peak corresponding to the extracted mass of the A0203‐05 peptide was observed (black line Figure 6(g)). However, similar to A*02:01 and CMV pp65 peptide exchange, a small peak corresponding to the intact conditional MHCI ligands was also observed (blue line Figure 6(g)). This phenomenon was seen for all conditional MHCI ligands tested and indicates the presence and carryover of some low level contaminants during the peptide exchange process. It is worth noting that, in all cases, the total fraction of contaminant peptide was less than 1%. The first dimension SEC chromatogram of the HLA‐A*02:03 MHCI complex after peptide exchange with a known nonbinder is shown in Figure 6(h). The overall peak area under these conditions was lower than when the peptide exchange process was performed with a peptide binder (Figure 1(e) vs. (h)). In addition, the A280 HPLC chromatogram in the second dimension contained two peaks but the overall peak areas were much lower than when a peptide binder was used (Figure 6(f) vs. (I)). These combined data suggest that there was significant material loss when the peptide exchange was performed with a nonbinder, likely due to protein aggregation. Interestingly, a peak at the end of the SEC run (Figure 6(h), retention time ~ 3.6 min) was consistently observed for the negative control exchange samples across all alleles tested, which we believe is due to partially denatured HLA interacting with the column. Finally, in the EIC analysis, no peak corresponding to the A0203 nonbinder peptide was observed indicating that peptide exchange did not occur (Figure 6(j)). It was surprising that even though no peptide was associated with the complex, a relatively prominent A280 peak was observed in the first dimension, although much smaller than the peak observed with peptide exchange. These results suggest that some of the complex remains associated in the absence of a peptide but it is likely of low quality and not properly folded.
Quantification of the first and second dimension data is shown in Figure 7. For this analysis, we evaluated the fraction of the A280 MHCI peak that was recovered after exchange in the first dimension (SEC) and the presence of the exchanged peptide in the second dimension (EIC). Figure 7 shows the fraction of A280 MHCI peak recovered (plotted as a ratio relative to nonpeptide exchange control) for the different MHCI complexes across the 4–5 positive controls and 1 negative control. All peptides tested, except the irrelevant peptide, were detected in the second dimension. For HLA‐A*0203, the fraction recovered for the positive control binder peptides varied from 0.9 to 1 and the exchange peptide was observed in the second dimension for all peptides. As described above, the fraction recovered for the negative control was still relatively high (~0.76) even though no exchanged peptide, cleaved conditional MHCI ligand and very low levels of intact conditional MHCI ligands (<1%) were observed. This suggests that the complex remains somewhat intact for a period of time in the absence of a peptide, although it is likely not properly folded given the instability of the HLA allele in the absence of a peptide.
FIGURE 7.
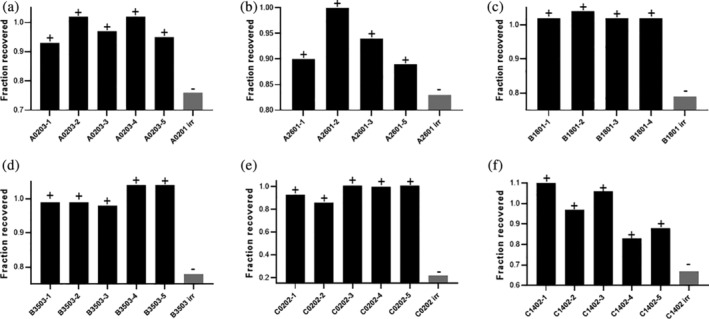
Quantification of the first dimension A280 MHCI peak after peptide exchange in the 2D LC/MS analysis. Fraction of MHCI peak area after peptide exchange relative to the peak area before peptide exchange for (a) A*02:03, (b) A*26:01, (c) B*18:01, (d) B*35:03, (e) C*02:02, and (f) C*14:02 for positive control peptides (known binders, black bars) and non binder peptide (gray bar). The positive symbol indicates the exchange peptide was observed in the EIC analysis of the second dimension and a negative symbol indicates the exchange peptide was not observed in the EIC analysis
Similar results were observed for A*26:01 (Figure 7(b)), B*18:01 (Figure 7(c)), B*35:03 (Figure 7(d)), and C*14:02 (Figure 7(f)). In all cases, the difference in peak area between the positive and negative control in the first dimension was less than 20–25%. In contrast, there was a drastic difference in the negative and positive controls for C*02:02 (Figure 7(e)). For this sample, ~80% of the material degraded when a known nonbinder peptide was included in the peptide exchange. Although we do not know the exact reason for this, it is likely due to the ability of the different alleles to remain associated with B2M when a peptide has been removed from the peptide groove on HLA. Regardless, these combined results clearly indicate that we have identified conditional MHCI ligands that allow for scaled‐up production of the MHCI peptides and subsequent peptide exchange for HTP generation of MHCI monomers and tetramers.
4. CONCLUSION
There is a need to develop workflows to expand the number of HLA alleles for which we have identified conditional MHCI ligands to improve the coverage of MHCI tetramer analysis of patient responses to CI/IO therapies. The methods outlined in this manuscript provide a blueprint for expansion across a broad range of HLA alleles. All conditional MHCI ligands selected using this workflow resulted in relatively high‐yield and high‐quality conditional MHCI complexes upon scale up. Based on the combined findings of this study, we believe this approach has the potential to be generally applied and enable HTP generation of MHCI monomers and tetramers across a wider range of HLA alleles, which could be critical to enabling the use of MHCI tetramers to monitor neoantigen‐specific T‐cells in the clinic.
AUTHOR CONTRIBUTIONS
Jenny Li: Conceptualization; data curation; formal analysis; writing‐review & editing. Jiun Chiun Chang: Data curation; formal analysis; writing‐original draft; writing‐review & editing. Christine Tam: Data curation; formal analysis. Yvonne Franke: Data curation; formal analysis; supervision. Hong Li: Data curation; formal analysis; supervision. Pamela Chan: Data curation; formal analysis; supervision; writing‐review & editing. Craig Blanchette: Conceptualization; data curation; formal analysis; investigation; project administration; resources; supervision; writing‐original draft; writing‐review & editing.
Supporting information
Data S1. Supporting information
Darwish M, Wichner S, Li J, et al. High‐throughput identification of conditional MHCI ligands and scaled‐up production of conditional MHCI complexes. Protein Science. 2021;30:1169–1183. 10.1002/pro.4082
Martine Darwish and Sara Wichner contributed equally.
REFERENCES
- 1. Chen DS, Mellman I. Oncology meets immunology: The cancer‐immunity cycle. Immunity. 2013;39:1–10. [DOI] [PubMed] [Google Scholar]
- 2. van Rooij N, van Buuren MM, Philips D, et al. Tumor exome analysis reveals neoantigen‐specific T‐cell reactivity in an ipilimumab‐responsive melanoma. J Clin Oncol. 2013;31:e439–e442. [DOI] [PMC free article] [PubMed] [Google Scholar]
- 3. Slaney CY, Kershaw MH, Darcy PK. Trafficking of T cells into tumors. Cancer Res. 2014;74:7168–7174. [DOI] [PubMed] [Google Scholar]
- 4. Melero I, Rouzaut A, Motz GT, Coukos G. T‐cell and NK‐cell infiltration into solid tumors: A key limiting factor for efficacious cancer immunotherapy. Cancer Discov. 2014;4:522–526. [DOI] [PMC free article] [PubMed] [Google Scholar]
- 5. Zamora AE, Crawford JC. Thomas PG (2018) hitting the target: How T cells detect and eliminate tumors. J Immunol. 2018;200:392–399. [DOI] [PMC free article] [PubMed] [Google Scholar]
- 6. Rosenberg SA. Decade in review‐cancer immunotherapy: Entering the mainstream of cancer treatment. Nat Rev Clin Oncol. 2014;11:630–663. [DOI] [PMC free article] [PubMed] [Google Scholar]
- 7. Alsaab HO, Sau S, Alzhrani R, et al. PD‐1 and PD‐L1 checkpoint signaling inhibition for cancer immunotherapy: Mechanism, combinations, and clinical outcome. Front Pharmacol. 2017;8:561. [DOI] [PMC free article] [PubMed] [Google Scholar]
- 8. Choudhry H, Helmi N, Abdulaal WH, et al. Prospects of IL‐2 in cancer immunotherapy. Biomed Res Int. 2018;2018:9056173. [DOI] [PMC free article] [PubMed] [Google Scholar]
- 9. Moran AE, Kovacsovics‐Bankowski M, Weinberg AD. The TNFRs OX40, 4‐1BB, and CD40 as targets for cancer immunotherapy. Curr Opin Immunol. 2013;25:230–237. [DOI] [PMC free article] [PubMed] [Google Scholar]
- 10. Capietto AH, Jhunjhunwala S, Delamarre L. Characterizing neoantigens for personalized cancer immunotherapy. Curr Opin Immunol. 2017;46:58–65. [DOI] [PubMed] [Google Scholar]
- 11. Hu Z, Ott PA, Wu CJ. Towards personalized, tumour‐specific, therapeutic vaccines for cancer. Nat Rev Immunol. 2018;18:168–182. [DOI] [PMC free article] [PubMed] [Google Scholar]
- 12. Naidoo J, Page DB, Wolchok JD. Immune modulation for cancer therapy. Br J Cancer. 2014;111:2214–2219. [DOI] [PMC free article] [PubMed] [Google Scholar]
- 13. Palmer DC, Guittard GC, Franco Z, et al. Cish actively silences TCR signaling in CD8+ T cells to maintain tumor tolerance. J Exp Med. 2015;212:2095–2113. [DOI] [PMC free article] [PubMed] [Google Scholar]
- 14. Altman JD, Moss PA, Goulder PJ, et al. Phenotypic analysis of antigen‐specific T lymphocytes. Science. 1996;274:94–96. [PubMed] [Google Scholar]
- 15. Robbins PF, Lu YC, El‐Gamil M, et al. Mining exomic sequencing data to identify mutated antigens recognized by adoptively transferred tumor‐reactive T cells. Nat Med. 2013;19:747–752. [DOI] [PMC free article] [PubMed] [Google Scholar]
- 16. Kvistborg P, Shu CJ, Heemskerk B, et al. TIL therapy broadens the tumor‐reactive CD8(+) T cell compartment in melanoma patients. Onco Targets Ther. 2012;1:409–418. [DOI] [PMC free article] [PubMed] [Google Scholar]
- 17. Chapuis AG, Lee SM, Thompson JA, et al. Combined IL‐21‐primed polyclonal CTL plus CTLA4 blockade controls refractory metastatic melanoma in a patient. J Exp Med. 2016;213:1133–1139. [DOI] [PMC free article] [PubMed] [Google Scholar]
- 18. Garboczi DN, Hung DT, Wiley DC. HLA‐A2‐peptide complexes: Refolding and crystallization of molecules expressed in Escherichia coli and complexed with single antigenic peptides. Proc Natl Acad Sci USA. 1992;89:3429–3433. [DOI] [PMC free article] [PubMed] [Google Scholar]
- 19. Robinson J, Barker DJ, Georgiou X, Cooper MA, Flicek P, Marsh SGE. IPD‐IMGT/HLA database. Nucleic Acids Res. 2020;48:D948–D955. [DOI] [PMC free article] [PubMed] [Google Scholar]
- 20. Moritz A, Anjanappa R, Wagner C, et al. High‐throughput peptide‐MHC complex generation and kinetic screenings of TCRs with peptide‐receptive HLA‐A*02:01 molecules. Sci Immunol. 2019;4:eaav‐860. [DOI] [PubMed] [Google Scholar]
- 21. Saini SK, Tamhane T, Anjanappa R, et al. Empty peptide‐receptive MHC class I molecules for efficient detection of antigen‐specific T cells. Sci Immunol. 2019;4:eaau9039. [DOI] [PubMed] [Google Scholar]
- 22. Rodenko B, Toebes M, Hadrup SR, et al. Generation of peptide‐MHC class I complexes through UV‐mediated ligand exchange. Nat Protoc. 2006;1:1120–1132. [DOI] [PubMed] [Google Scholar]
- 23. Brackenridge S, Evans EJ, Toebes M, et al. An early HIV mutation within an HLA‐B*57‐restricted T cell epitope abrogates binding to the killer inhibitory receptor 3DL1. J Virol. 2011;85:5415–5422. [DOI] [PMC free article] [PubMed] [Google Scholar]
- 24. Frosig TM, Yap J, Seremet T, et al. Design and validation of conditional ligands for HLA‐B*08:01, HLA‐B*15:01, HLA‐B*35:01, and HLA‐B*44:05. Cytometry A. 2015;87:967–975. [DOI] [PubMed] [Google Scholar]
- 25. Chang CX, Tan AT, Or MY, et al. Conditional ligands for Asian HLA variants facilitate the definition of CD8+ T‐cell responses in acute and chronic viral diseases. Eur J Immunol. 2013;43:1109–1120. [DOI] [PMC free article] [PubMed] [Google Scholar]
- 26. Toebes M, Coccoris M, Bins A, et al. Design and use of conditional MHC class I ligands. Nat Med. 2006;12:246–251. [DOI] [PubMed] [Google Scholar]
- 27. Bakker AH, Hoppes R, Linnemann C, et al. Conditional MHC class I ligands and peptide exchange technology for the human MHC gene products HLA‐A1, −A3, −A11, and ‐B7. Proc Natl Acad Sci USA. 2008;105:3825–3830. [DOI] [PMC free article] [PubMed] [Google Scholar]
- 28. Bui HH, Sidney J, Dinh K, Southwood S, Newman MJ, Sette A. Predicting population coverage of T‐cell epitope‐based diagnostics and vaccines. BMC Bioinformatics. 2006;7:153. [DOI] [PMC free article] [PubMed] [Google Scholar]
- 29. Sylvester‐Hvid C, Kristensen N, Blicher T, et al. Establishment of a quantitative ELISA capable of determining peptide ‐ MHC class I interaction. Tissue Antigens. 2002;59:251–258. [DOI] [PubMed] [Google Scholar]
- 30. Pedersen LE, Harndahl M, Rasmussen M, et al. Porcine major histocompatibility complex (MHC) class I molecules and analysis of their peptide‐binding specificities. Immunogenetics. 2011;63:821–834. [DOI] [PMC free article] [PubMed] [Google Scholar]
- 31. Darwish M, Shatz W, Leonard B, et al. Nanolipoprotein particles as a delivery platform for fab based therapeutics. Bioconjug Chem. 2020;31:1995–2007. [DOI] [PubMed] [Google Scholar]
- 32. Harndahl M, Rasmussen M, Roder G, et al. Peptide‐MHC class I stability is a better predictor than peptide affinity of CTL immunogenicity. Eur J Immunol. 2012;42:1405–1416. [DOI] [PubMed] [Google Scholar]
- 33. Bouvier M, Wiley DC. Importance of peptide amino and carboxyl termini to the stability of MHC class I molecules. Science. 1994;265:398–402. [DOI] [PubMed] [Google Scholar]
- 34. Ferre H, Ruffet E, Blicher T, et al. Purification of correctly oxidized MHC class I heavy‐chain molecules under denaturing conditions: A novel strategy exploiting disulfide assisted protein folding. Protein Sci. 2003;12:551–559. [DOI] [PMC free article] [PubMed] [Google Scholar]
- 35. Saini SK, Ostermeir K, Ramnarayan VR, Schuster H, Zacharias M, Springer S. Dipeptides promote folding and peptide binding of MHC class I molecules. Proc Natl Acad Sci USA. 2013;110:15383–15388. [DOI] [PMC free article] [PubMed] [Google Scholar]
- 36. Cole DK, Edwards ES, Wynn KK, et al. Modification of MHC anchor residues generates heteroclitic peptides that alter TCR binding and T cell recognition. J Immunol. 2010;185:2600–2610. [DOI] [PMC free article] [PubMed] [Google Scholar]
- 37. Sims S, Willberg C, Klenerman P. MHC‐peptide tetramers for the analysis of antigen‐specific T cells. Expert Rev Vaccines. 2010;9:765–774. [DOI] [PubMed] [Google Scholar]
- 38. Luimstra JJ, Garstka MA, Roex MCJ, et al. A flexible MHC class I multimer loading system for large‐scale detection of antigen‐specific T cells. J Exp Med. 2018;215:1493–1504. [DOI] [PMC free article] [PubMed] [Google Scholar]
- 39. Wingfield PT. N‐terminal methionine processing. Curr Protoc Protein Sci. 2017;88:6 14 1–6 14 3. [DOI] [PMC free article] [PubMed] [Google Scholar]
- 40. Hadrup SR, Toebes M, Rodenko B, et al. High‐throughput T‐cell epitope discovery through MHC peptide exchange. Methods Mol Biol. 2009;524:383–405. [DOI] [PubMed] [Google Scholar]
- 41. Toebes M, Rodenko B, Ovaa H, Schumacher TN. Generation of peptide MHC class I monomers and multimers through ligand exchange. Curr Protoc Immunol. 2009;87.18.16:1–20. [DOI] [PubMed] [Google Scholar]
Associated Data
This section collects any data citations, data availability statements, or supplementary materials included in this article.
Supplementary Materials
Data S1. Supporting information