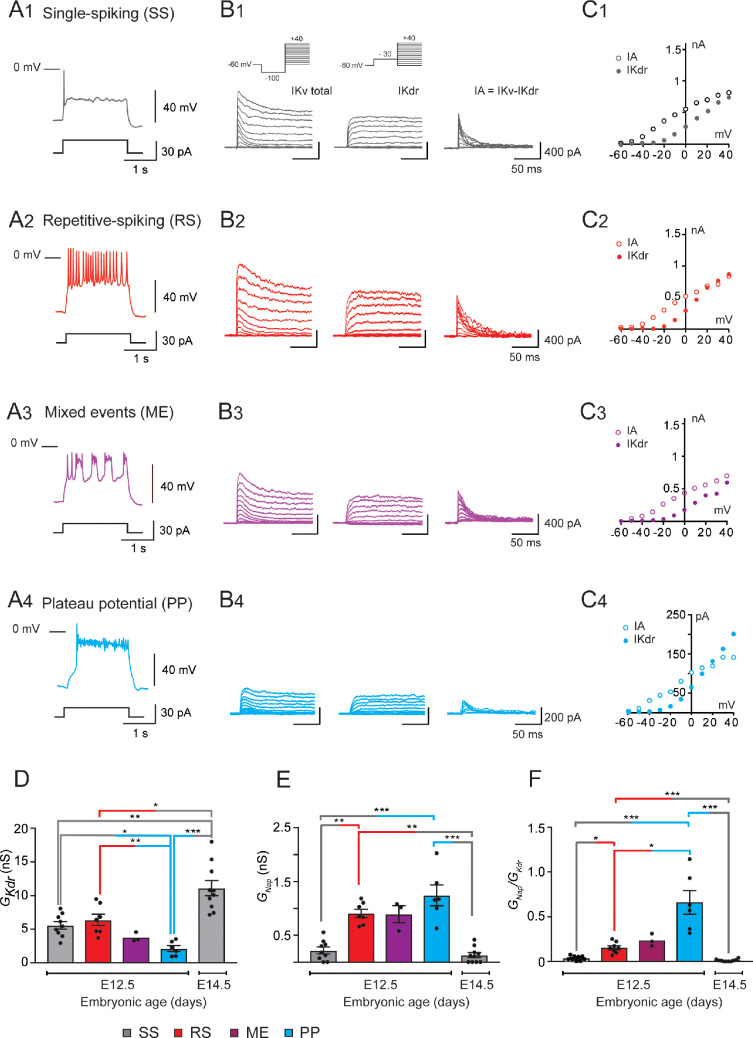
Figure 1. GKdr and GNap in embryonic V1R at E12.5 and E14.5.
(A) Representative traces of voltage responses showing single spiking (SS) activity in E12.5 SS V1R (A1), repetitive action potential firing in repetitive spiking (RS) V1R (A2), mixed plateau potential activity (PP) and repetitive action potential firing in mixed event (ME) V1R (A3), and PP activity in PP V1R (A4). (B) Representative examples of the total outward K+ currents (IKV total) obtained from = –100 mV (left traces), of ( = –30 mV, middle traces), and of isolated (left traces) recorded at E12.5 in SS V1R (B1), RS V1R (B2), ME V1R (B3), and PP V1R (B4). Voltage-dependent potassium currents were evoked in response to 10 mV membrane potential steps (200 ms) from –100 or from –30 mV to +40 mV (10 s interval between pulses). V1R were voltage clamped at = –60 mV. A prepulse of –40 mV (300 ms) was applied to activate both and . was isolated by applying a prepulse of -30 mV (300 ms) to inactivate (B1 inset). was isolated by subtracting step-by-step the currents obtained using a prepulse of -30 mV ( = –30 mV) from the currents obtained using a prepulse of –40 mV ( = –100 mV). (C) Current-voltage relationship ( curves) of (filled circles) and of (open circles) recorded in SS V1R (C1), RS V1R (C2), ME V1R (C3), and PP V1R (C4). curves were obtained from currents shown in (B1), (B2), (B3), and (B4). Note that curves are similar between SS V1R, RS V1R, ME V1R, and PP V1R. (D) Bar graph showing maximal value (Max ) in SS V1R at E12.5 (n = 9; N = 9; gray bar) and at E14.5 (n = 10; N = 10 gray bar), and in RS V1R (n = 7; N = 7; red bar), ME V1R (n = 3; N = 3 purple bar), and PP V1R at E12.5 (n = 7; N = 7 blue bar) was calculated from at = + 20 mV, assuming a K+ equilibrium potential of –96 mV. There is no significant difference in between SS V1R and RS V1R, while is significantly smaller in PP V1R as compared to SS V1R and RS V1R was significantly higher in SS V1R at E14.5 than in SS V1R, RS V1R, and PP V1R at E12.5 (Kruskal–Wallis test p<0.0001; SS V1R versus RS V1R at E12.5, p=0.5864; SS V1R versus PP V1R at E12.5, p=0.0243; RS V1R versus PP V1R at E12.5, p=0.0086; E14.5 SS V1R versus E12.5 SS V1R, p=0.0048; E14.5 SS V1R versus E12.5 RS V1R, p=0.0384, E14.5 SS V1R versus E12.5 PP V1R, p<0.0001). The increase in density between E12.5 and E14.5 is likely to be due to the increase in neuronal size (input capacitance; Figure 2A). Indeed, there was no significant difference (Mann–Whitney test, p=0.133) in between SS V1R at E12.5 (n = 9; N = 9 gray bar) and at E14.5 (n = 10; N = 10 gray bar). (E) Bar graph showing the maximal Max value () in SS V1R at E12.5 (n = 9; N = 9 gray bar) and E14.5 (n = 10; N = 10 gray bar), and in RS V1R (n = 8; N = 8 red bar), ME V1R (n = 3; N = 3 purple bar), and PP V1R (n = 6; N = 6 blue bar) at E12.5. Max was calculated from maximal value measured on current evoked by assuming a Na+ equilibrium potential of +60 mV. There was no difference in between RS V1R and PP V1R. On the contrary, measured in SS V1R at E12.5 or at E14.5 was significantly smaller as compared to measured at E12.5 in RS V1R or in PP V1R measured at E12.5 and E14.5 in SS V1R were not significantly different (Kruskal–Wallis test p<0.0001; E12.5 SS V1R versus E12.5 RS V1R, p=0.0034; E12.5 SS V1R versus E12.5 PP V1R, p=0.0006; E12.5 RS V1R versus E12.5 PP V1R, p=0.5494; E14.5 SS V1R versus E12.5 SS V1R, p=0.5896; E14.5 SS V1R versus E12.5 RS V1R, p=0.0005; E14.5 SS V1R versus E12.5 PP V1R, p<0.0001). (F) Histograms showing the / ratio in SS V1R at E12.5 (n = 9; gray bar) and E14.5 (n = 10; green bar) and in RS V1R (n = 8; red bar), ME V1R (n = 3; purple bar), and PP V1R (n = 6; blue bar) at E12.5. Note that the / ratio differs significantly between SS V1R, RS V1R, and PP V1R at E12.5, while it is not different between SS V1R recorded at E12.5 and at E14.5 (Kruskal–Wallis test p<0.0001; SS V1R versus RS V1R at E12.5, p=0.0367; SS V1R versus PP V1R at E12.5, p<0.0001; RS V1R versus PP V1R at E12.5, p=0.0159; E14.5 SS V1R versus E12.5 SS V1R, p=0.2319; E14.5 SS V1R versus E12.5 RS V1R, p=0.0017; E14.5 SS V1R versus E12.5 PP V1Rp<0.0001). Data shown in (A) and (B) were used to calculate / ratio shown in (C) (*p<0.05, **p<0.01, ***p<0.001).

