

Abstract
Purpose
This study aimed to investigate the results of compartmental modeling (CM) and spectral analysis (SA) generated with dynamic 18F-FMISO tumor images. Besides, the regular tissue-to-blood ratio (TBR) images were derived and compared with the dynamic models.
Methods
Nine subjects with glioblastoma underwent PET/CT imaging with the 18F-FMISO tracer. The protocol for PET imaging began with 15 min in dynamic mode and two 10-min duration static images at 120 min and 180 min post-injection. We used the two-tissue compartmental model for CM at the voxel basis, and we conducted SA to estimate the 18F-FMISO accumulation within each voxel. We also investigated the usual tumor-to-blood ratio (TBR) for comparison.
Results
The images of the tumor showed different patterns of hypoxia and necrosis as a function of PET scanning times, while CM and SA methods based on dynamic PET imaging equally located tumor hypoxia. The mean correlation of Ki images of all subjects between CM and SA was 0.63 ± 0.19 (0.24-0.86). CM produced less noisy Ki images than SA, and, in the contrary, SA produced accumulation component images more clear than with CM. CM-Ki and SA-Ki images were correlated with TBR images (r = 0.72 ± 0.20 and 0.56 ± 0.26, respectively). In the only subject having a continuously increasing tumor time-activity curve, the k3 image showed a high uptake in the necrosis region which was not apparent in TBR or Ki images.
Conclusion
Based on these results, the combination of CM and SA approaches was found more appropriate in generating voxel-based hypoxia images.
Keywords: FMISO, Hypoxia, Compartmental modeling, Spectral analysis
Introduction
Parametric images in positron emission tomography (PET) provide quantitative maps of drug pharmacokinetic parameters from dynamic images. Various physiological parameters can be extracted from parametric images such as blood flow, glucose metabolism, enzyme activity, protein concentrations, and hypoxia [1].
The standard acquisition technique for parametric images uses the dynamic time series of a tracer. The information is generated by analyzing the time-activity curve (TAC) of the region-of-interest (ROI) or the TAC of individual voxels in the image. The fitting at the voxel level is generally noisy, and the process is time-consuming. However, many techniques have been developed to overcome the noise, such as applying weight factors, optimizing the models using noise reduction techniques, and implementing the kinetic data inside the image reconstruction process [1].
Several methods have been used to generate parametric images from different radiotracers. The most notable method is the compartmental kinetic modeling (CM) [2]. CM estimates the physiological kinetic parameters based on a model construction of inputs and outputs from which it retrieves the rate constants. Various quantitative parameters can be estimated from CM, such as the net influx rate Ki, the perfusion K1, and tissue blood volume (TBV). In addition, similar methods based on CM estimate such parameters, for instance, the graphical analysis techniques such as Patlak or Logan analysis estimate Ki or glucose metabolism [3, 4]. Another method used for generating parametric images is spectral analysis (SA) [5, 6]. SA is a technique used to decompose the PET dynamic TACs into their principal compartments or components. The outputs of this analysis are correlated to physiological parameters. The most potent advantage of SA over CM is that SA is used without a priori information or assumptions on the model.
Tumor hypoxia is one of the characteristics of most cancers. It is defined as a deficiency in blood supply and thus of oxygen inside the tumor. In terms of imaging, the tumor becomes less perfused. A variety of PET tracers have been used to detect tumor hypoxia mainly 18F-FMISO and 18F-FAZA [7]. Evaluation of PET images for glioblastoma multiforme (GBM) hypoxia with 18F-FMISO was mainly based on the type of acquisition. Static PET images were primarily using the standard uptake value (SUV) and the ratio method [8]. These techniques did not give the complete kinetic information about hypoxia's physiology in GBM, as they have essentially images acquired at a specific time. Therefore, clinicians nowadays prefer the use of dynamic images, which can give more information about hypoxia. In 1995, Casciari et al. designed a model for 18F-FMISO dynamic images [9]. The main aim was to estimate the 18F-FMISO reaction rate constant KA. This parameter was related to oxygenation inside cells. The model was able to estimate the parameter, but the accuracy was affected by other intrinsic parameters with the model. In another study, Bruehlmeier et al. used several models for 18F-FMISO with GBM [10]. They found distribution volume was the best parameter at early 18F-FMISO images, but no correlation at late images. Finally, Thorwarth et al. applied a new model based on weighting factors, representing the perfusion, accumulation, and blood inside tumors [11, 12]. The estimated parameters were superior to SUV but were not able to predict the treatment outcome. However, further investigation of these techniques is important, as defining tumor hypoxia increases diagnostic accuracy, consequently enabling cancer treatment personalization.
This study’s objective was to investigate the results of compartmental modeling (CM) and spectral analysis (SA) generated with dynamic 18F-FMISO images from glioblastoma patients. In addition, a comparison of TBR images with CM and SA was also studied.
Materials and Methods
Imaging Data
The project was composed of 9 subjects diagnosed with grade IV GBM. We applied the Lim and Berridge protocol for 18F-FMISO preparation [13]. Dynamic PET scan 18F-FMISO was utilized for 15 min (activity 3.7 MBq/kg). The used time frames were 12 × 10 s, 8 × 15 s, and 11 × 60 s. Besides, two static scans were done at 2 h and 3 h post-injection. PET images were reconstructed using standard techniques (3D-OSEM ordered-subset expectation-maximization algorithm.). All PET scans were conducted on Discovery RX (General Electric Medical System). Computed tomography (CT) scan (120 kVp, 80–250 mA) was used in the beginning for attenuation correction, anatomical localization, and co-registration between dynamic and static scans. Image analysis on the corrected PET images began with calculating TBR images at 3h with a 1.4 threshold level. Next, we did a kinetic modeling and spectral analysis on each voxel for all subjects. We used r-squared to compare the results of fitting curves of CM and SA. Parametric images of K1, k2, k3, and ki and volume of distribution (VD) were estimated using CM and SA for comparisons. The project was performed according to the ethical standards of the University of Bordeaux-II, and informed consent was collected from all subjects.
Compartmental Modeling
The blood input function (IF) was derived from the PET images of the common carotid artery by drawing an ROI on the sagittal view to encompass a large area of the carotid, which was less prone to the partial volume effect (PVE). In this study, we assumed the plasma input function was identical to the whole blood input function, and no metabolites existed in the plasma. Spillover and PVE were minimized by placing the carotid artery ROI at least 2 voxels away from the high uptake regions. The IF was used for both CM and SA.
The mathematical model for CM was the two-tissue compartment model as shown in Fig. 1 [2]:
| 1 |
where
Fig. 1.

The compartmental model consisting of three compartments. CB is the tissue blood volume in the ROI or voxel, CF is the free radiotracer compartment, and CA is the compartment of the accumulated bound radiotracer
K1, k2, k3, and k4 are the rate constants. In this study, we assumed k4 = 0 and IF derived from the carotid artery images as whole blood. The net uptake rate Ki was estimated as K1k3/(k2 + k3).
Basically, (1) is composed of three terms representing the three compartments shown in Fig. 1. The accumulation compartment of CM to be compared to the accumulation component obtained with SA is expressed as, by considering k4 = 0, and by considering the input response function without the convolution [2]:
| 2 |
Spectral Analysis
We applied the SA technique to analyze the PET TACs. It allows us to decompose the TACs into their expected components. These components were assumed to be blood, perfusion, and accumulation. Therefore, this decomposition can help us isolate the accumulation component, which can be related to the hypoxic tumor. In contrast to compartmental modeling, the main advantage of SA is that it does not need prior assumptions about the number of components. SA can determine the amplitudes Ai and the exponents Bi that can give the best fit to the TACs curve. The main equation of SA was given as [14]:
| 3 |
where A and B in (3) were assumed to have real non-negative values. The B values ranged from 10−5 to 1 (we equivalently refer to B with Log10(B) and thus, B varies from - 5 to 0). The number of exponentials was set to N = 100. However, the maximum number of SA components with our subjects was 6. The second term in (3), AN + 1IF(t), accounts for tissue blood volume equivalent to TBV × IF(t) in (1). The outputs of SA were reported to correspond to the physiological parameters [6, 14–16]. These parameters were the perfusion K1, the net uptake of the tracer Ki, and the volume of distribution (VD). In this study, we calculated the 18F-FMISO Ki = K1k3/(k2 + k3) as equal to the amplitude Ai at B = 0 [15].
To compare the accumulation component of SA to that of CM as in (2), the SA B values encompassing the values from B1 = − 5 to a value Blim were used in the following equation, ignoring the convolution with IF, providing the input response function of the accumulation component:
| 4 |
where Blim was incrementally determined such that (2) and (4) are the mostly correlated curves.
Tissue-to-Blood Ratio
TBR parametric images were calculated as the ratio of the radiotracer concentration in the tumor to its concentration in blood taken from IF at the specific time [17]. To discriminate hypoxia in the TBR images, we used the conventional 1.4 thresholds on TBR images [17].
Statistical Analysis
Values from CM, SA, and TBR were compared with correlation coefficients and with t test.
Results
Figure 2 shows the distribution of 18F-FMISO in the brain of the same subject during the same PET session at four different times post-injection. The area of the tumor and necrosis differed among the times, indicating the uptake and washout progress of 18F-FMISO inside the tumor. Since the accumulation of 18F-FMISO in the tumor is continuously varying with time, in the clinic, it is usual to consider the latest image even at 4 h post-injection to locate hypoxia which is supposed having less exchange of 18F-FMISO with blood. Greater changes were noticed in the earlier images post-injection, while, based on the whole TAC, the tumors from the 9 subjects were shown to be perfused or highly hypoxic as shown in Fig. 3. In this figure, subject 1 (S1) had an accumulating TAC reflecting a highly hypoxic tumor, subject 2 (S2) had a declining TAC reflecting a perfused tumor, and subject 3 (S3) had a stable TAC. Thus, relying on a single image to locate hypoxia is not a determinant.
Fig. 2.

The uptake of 18F-FMISO in subject 1 (S1) measured at four different times showing the progress of 18F-FMISO accumulation in the tumor
Fig. 3.
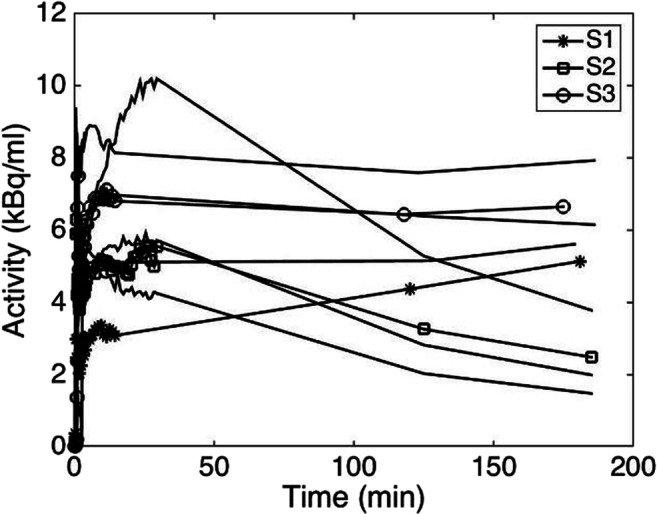
The time-activity curve of the tumor from the 9 subjects. Subject 1 (S1) with an accumulating TAC reflecting a highly hypoxic tumor, subject 2 (S2) with a declining TAC reflecting a perfused tumor, and subject 3 (S3) having a stable TAC
Table 1 shows the goodness of fit as calculated using r-squared. The values of Ki,K1,VD, and TBR from CM and SA were compared in Fig. 4 as parametric images in the nine subjects having different tumor behavior. In all subjects’ images, CM-Ki tumor images appeared well defined and less noisy. The images of K1 among CM and SA look similar, while the VD images were not correlated. Figure 5 shows the values of Ki, K1, and VD in the whole tumor from the 9 subjects for CM, SA, and TBR as boxplots where the values were normalized to their respective means to relatively compare the dispersion of the values in each group. The t test between these groups taken two-by-two was not statistically significantly different (p < 0.05). The correlation of Ki value within the whole tumor volume between the CM and SA methods in all subjects was 0.63 ± 0.19 (0.24-0.86). CM-Ki and SA-Ki images were correlated with TBR images (r = 0.72 ± 0.20 and 0.56 ± 0.26, respectively). In addition, the correlation of K1 value between the CM and SA methods in all subjects was 0.85 ± 0.10 (0.65-0.94). Finally, the correlation of VD value between the CM and SA methods in all subjects was 0.43 ± 0.33 (0.97-0.00).
Table 1.
The results of r-squared fitting curves all subjects
| Subject | CM | SA |
|---|---|---|
| 1 | 0.67 ±0.12 | 0.67 ±0.12 |
| 2 | 0.60 ±0.11 | 0.62 ±0.11 |
| 3 | 0.79 ±0.09 | 0.79 ±0.08 |
| 4 | 0.68 ±0.12 | 0.69 ±0.12 |
| 5 | 0.58 ±0.12 | 0.60 ±0.12 |
| 6 | 0.81 ±0.07 | 0.81 ±0.09 |
| 7 | 0.89 ±0.06 | 0.89 ±0.07 |
| 8 | 0.58 ±0.12 | 0.61 ±0.11 |
| 9 | 0.62 ±0.12 | 0.63 ±0.12 |
Fig. 4.

Comparison of the net uptake ratio Ki, K1, and VD estimated by CM and SA in the nine subjects at 180 min. The last column shows the TBR images. CM image appears smooth with thick definition of the tumor
Fig. 5.
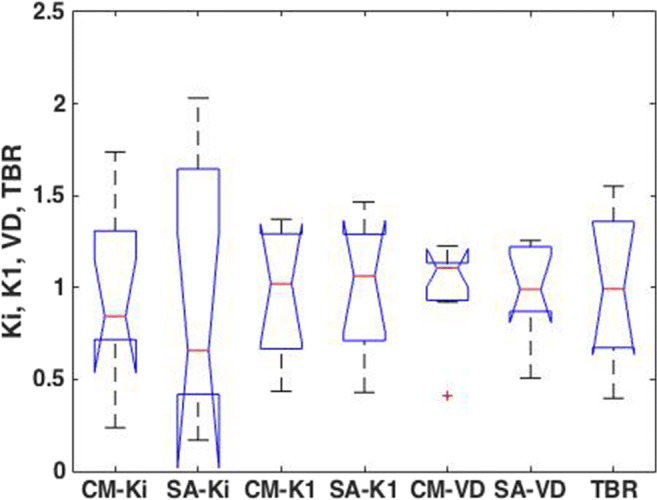
Boxplot comparing Ki, K1, and VD among CM and SA and TBR in the whole tumor volume. The values were from the 9 subjects and were normalized to the mean in each group
On the contrary, the images accounting for the accumulation compartments calculated with (2) for CM and with (4) for SA showed a clear tumor definition and smooth images on SA than on CM (Fig. 6). The values of B1 and Blim are indicated in each image of SA. The input response functions of the accumulation component of the tumor from CM and SA are plotted in Fig. 7 for the three subjects, depicting comparable behavior.
Fig. 6.
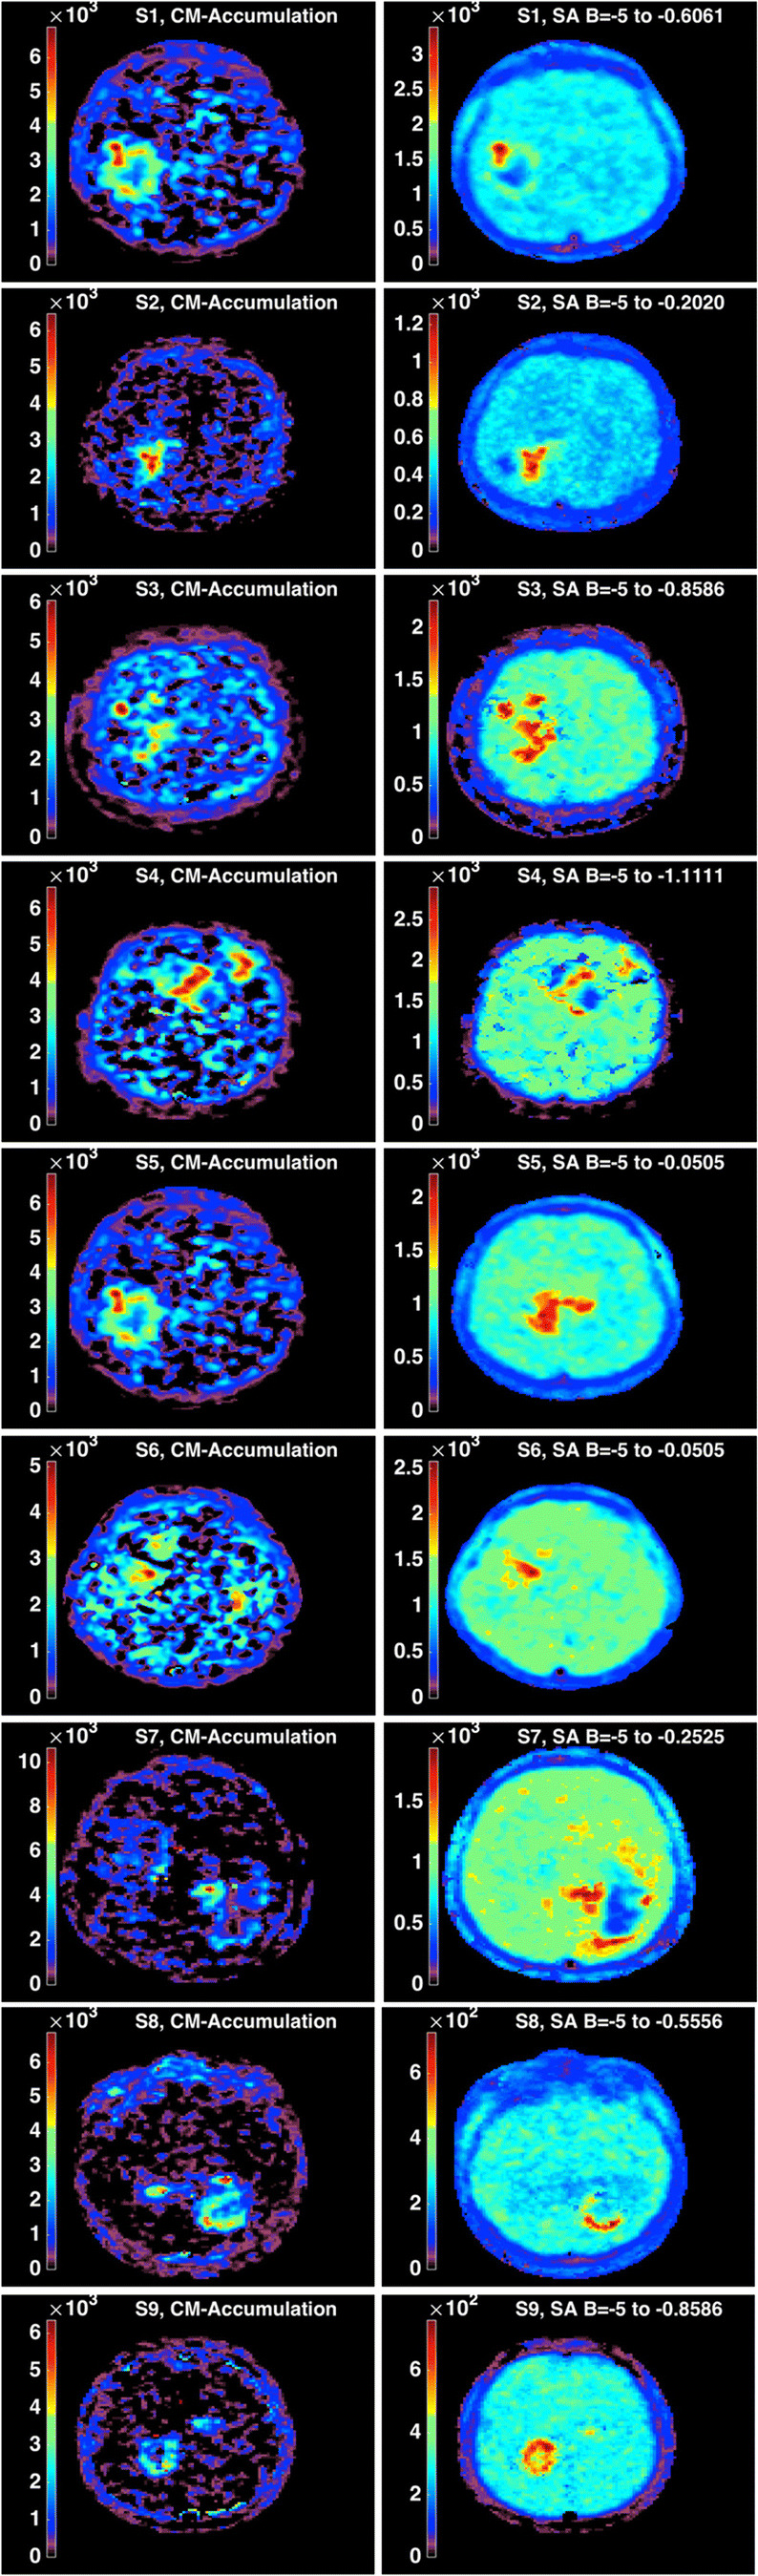
CM accumulation compartment versus SA accumulation component in the nine subjects. Tumor images with SA appear better defined
Fig. 7.

Input response functions of the tumor from CM and SA as respectively defined in (2) and (4). a-i represents the nine subjects, respectively
In Fig. 8, the CM parametric images of K1 and k3 in all subjects were compared showing a mismatch of k3 in the tumor of subjects 1, 4, 5, 6, and 9, while k3 matched the tumor for other subjects. This behavior would be depending on the shape of TAC as in Fig. 3. The K1 image, which is the perfusion, partly reproduced the shape of the tumor as in the measured image except for some voxels appearing relatively with low intensity. For subjects 1 and 7, the k3 image showed an accumulation of 18F-FMISO in the necrosis region which was not shown in any other image from the 7 subjects. On the other hand, comparing of measured with Ki images in Fig. 4 shows that the high uptake voxels were matched between Ki and the measured images.
Fig. 8.

Comparison of CM K1 and k3 images with the measured images taken at 180 min in the nine subjects
Discussions
Hypoxia is a significant characteristic of solid tumors in most cancers [18]. In GBM tumors, hypoxia does not only contribute to tumor resistance but also has a role in the tumor spreading [19]. In this study, we showed the temporal variations of 18F-FMISO uptake within the tumor volume. In most clinical studies, the protocol utilized is a late static 18F-FMISO image taken between 2 and 4 h post-injection due to the slow kinetics of 18F-FMISO [8]. In a previous work of Thorwarth et al., they found that some regions of the tumor with high uptake of 18F-FMISO can decrease in intensity after 120 min post-injection in comparison to other regions of the same tumor in the same subject, and thus, it is not recommended to rely on image intensity at 120 min post-injection to determine hypoxia [11].
Parametric images were able to identify the perfusion and the retention of 18F-FMISO within the tumor volume. The TBR images showed a high uptake of 18F-FMISO in some regions not matching the k3 parametric images. The net uptake rate Ki images from the spectral analysis were used to estimate the accumulation inside the tumor. Regions of high uptake in the measured image do not always show high uptake in the K1 images. This high uptake of tracer in the measured images could be explained as a mix of tissue with good perfusion and diffusion-limited hypoxia [11]. In addition, the degree of necrosis inside the tumor can affect the tracer uptake since 18F-FMISO molecules do not bind to the necrotic regions, but they can freely diffuse inside this region [20]. The new finding from this study was the generation of the 18F-FMISO accumulation component with spectral analysis as a parametric image of hypoxia. This image can be further segmented where the voxels of higher intensity can be subjected to radiation boosts in radiotherapy.
This study may have some limitations. The noise in TACs data can affect both CM and SA when applied at the voxel basis. However, the values of kinetic parameters in both methods have different susceptibility to noise effect. Ki in CM is less sensitive to noise than k3 [21]. In SA, K1 is estimated as the summation of amplitudes along all frequencies, while Ki is the amplitude at B = 0 which makes Ki more sensitive to noisy data. The main differences between CM-Ki and SA-Ki were the effect of noise in determining the accumulation exponential. This problem appeared at the beginning of the SA application, where the noise can influence exponential detection. Therefore, shifting of components from their true values were mainly affected the accumulation component, which assumed to have only one component in SA estimation. The restricted number of components and the relative calculation of Ki in CM minimize the effect of noise.
Conclusions
A dynamic acquisition of 18F-FMISO adds more accuracy and flexibility in locating the hypoxia regions in glioblastoma multiforme tumors. Its disadvantage is the time-consuming in the clinic which prevents from scanning more patients. The use of the compartmental modeling approach was shown to correlate with results from spectral analysis. The recourse to parametric images from different components and rate constants increases the accuracy of hypoxia determination. From this study, the accumulative 18F-FMISO component defined with spectral analysis was shown to be the most representative of hypoxia image based on the input response functions of the pixels, in addition to the enhanced contrast and smoothness of the image. The parametric k3 image specifically showed a different pattern when the tumor has a continuous accumulation of 18F-FMISO.
Compliance with Ethical Standards
Conflict of Interest
Redha-alla Abdo, Frédéric Lamare, Philippe Fernandez, and M’hamed Bentourkia declare no conflict of interest.
Ethical Statement
All procedures performed in studies involving human participants were in accordance with the ethical standards of the institutional and/or national research committee and with the Helsinki Declaration as revised in 2013 and its later amendments or comparable ethical standards.
Informed Consent
Informed consent was obtained from all individual participants included in the study at the Université de Bordeaux-II.
Footnotes
Publisher’s Note
Springer Nature remains neutral with regard to jurisdictional claims in published maps and institutional affiliations.
Contributor Information
Redha-alla Abdo, Email: Reda_2005@yahoo.com.
Frédéric Lamare, Email: frederic.lamare@chu-bordeaux.fr.
Philippe Fernandez, Email: philippe.fernandez@u-bordeaux1.fr.
M’hamed Bentourkia, Email: mhamed.bentourkia@usherbrooke.ca.
References
- 1.Gallezot J-D, Lu Y, Naganawa M, Carson RE. Parametric imaging with PET and SPECT. IEEE Trans Rad Plas Med Sci. 2020;4:1–23. doi: 10.1109/TRPMS.2019.2908633. [DOI] [Google Scholar]
- 2.Phelps ME, Huang SC, Hoffman EJ, Selin C, Sokoloff L, Kuhl DE. Tomographic measurement of local cerebral glucose metabolic rate in humans with (F-18)2-fluoro-2-deoxy-D-glucose: Validation of method. Ann Neurol. 1979;6:371–388. doi: 10.1002/ana.410060502. [DOI] [PubMed] [Google Scholar]
- 3.Patlak CS, Blasberg RG, Fenstermacher JD. Graphical evaluation of blood-to-brain transfer constants from multiple-time uptake data. J Cereb Blood Flow Metab. 1983;3:1–7. doi: 10.1038/jcbfm.1983.1. [DOI] [PubMed] [Google Scholar]
- 4.Logan J, Fowler JS, Volkow ND, Wolf AP, Dewey SL, Schlyer DJ, et al. Graphical analysis of reversible radioligand binding from time-activity measurements applied to [N-11C-methyl]-(-)-cocaine PET studies in human subjects. J Cereb Blood Flow Metab. 1990;10:740–747. doi: 10.1038/jcbfm.1990.127. [DOI] [PubMed] [Google Scholar]
- 5.Bentourkia M Modeling 13N-ammonia from projections in rat-PET studies. IEEE Nucl Sci Symp Med Imaging Conf. 2001. p. 1564–8.
- 6.Cunningham VJ, Jones T. Spectral Analysis of Dynamic PET Studies. J Cereb Blood Flow Metab. 1993;13:15–23. doi: 10.1038/jcbfm.1993.5. [DOI] [PubMed] [Google Scholar]
- 7.Fleming IN, Manavaki R, Blower PJ, West C, Williams KJ, Harris AL, et al. Imaging tumour hypoxia with positron emission tomography. Br J Cancer. Nature Publishing Group. 2015;112:238–250. doi: 10.1038/bjc.2014.610. [DOI] [PMC free article] [PubMed] [Google Scholar]
- 8.Abdo R, Lamare F, Fernandez P, Bentourkia M. Analysis of hypoxia in human glioblastoma tumors with dynamic 18F-FMISO PET imaging. Australas Phys Eng Sci Med. 2019;42:981–993. doi: 10.1007/s13246-019-00797-8. [DOI] [PubMed] [Google Scholar]
- 9.Casciari JJ, Graham MM, Rasev JS. A modeling approach for quantifying tumor hypoxia with F-18Fluoromisonidazole PET time-activity data. Med Phys. 1995;22:1127–1139. doi: 10.1118/1.597506. [DOI] [PubMed] [Google Scholar]
- 10.Bruehlmeier M, Roelcke U. Schubiger P a, Ametamey SM. Assessment of hypoxia and perfusion in human brain tumors using PET with 18F-fluoromisonidazole and 15O-H2O. J Nucl Med. 2004;45:1851–1859. [PubMed] [Google Scholar]
- 11.Thorwarth D, Eschmann SM, Paulsen F, Alber M. A kinetic model for dynamic [18F]-Fmiso PET data to analyse tumour hypoxia. Phys Med Biol. 2005;50:2209–2224. doi: 10.1088/0031-9155/50/10/002. [DOI] [PubMed] [Google Scholar]
- 12.Thorwarth D, Eschmann S-M, Paulsen F, Alber M. A Model of reoxygenation dynamics of head-and-neck tumors based on serial 18F-fluoromisonidazole positron emission tomography investigations. Int J Radiat Oncol Biol Phys [Internet]. 2007 [cited 2017 Jul 7];68:515–521. Available from: http://ac.els-cdn.com/S0360301607000880/1-s2.0-S0360301607000880-main.pdf?_tid=904dd8a8-6359-11e7-8566-00000aacb35d&acdnat=1499462380_79b821d2c45e0e0db234e1641d8df47b [DOI] [PubMed]
- 13.Lim JL, Berridge MS. An efficient radiosynthesis of [18F]fluoromisonidazole. Appl Radiat Isot. 1993;44:1085–1091. doi: 10.1016/0969-8043(93)90110-V. [DOI] [PubMed] [Google Scholar]
- 14.Bentourkia M. PET kinetic modeling of 11C-acetate from projections. Comput Med Imaging Graph. 2003;27:373–379. doi: 10.1016/S0895-6111(03)00018-1. [DOI] [PubMed] [Google Scholar]
- 15.Veronese M, Rizzo G, Bertoldo A, Turkheimer FE. Spectral analysis of dynamic PET studies : a review of 20 years of method developments and applications. Comput Math Methods Med. 2016;2016:1–15. doi: 10.1155/2016/7187541. [DOI] [PMC free article] [PubMed] [Google Scholar]
- 16.Gunn RN, Gunn SR, Cunningham VJ. Positron emission tomography compartmental models. J Cereb Blood Flow Metab. 2001;21:635–652. doi: 10.1097/00004647-200106000-00002. [DOI] [PubMed] [Google Scholar]
- 17.Grkovski M, Schöder H, Lee NY, Carlin SD, Beattie BJ, Riaz N, et al. Multiparametric imaging of tumor hypoxia and perfusion with 18 F-fluoromisonidazole dynamic PET in head and neck cancer. J Nucl Med. 2017;58:1072–1080. doi: 10.2967/jnumed.116.188649. [DOI] [PMC free article] [PubMed] [Google Scholar]
- 18.Muz B, de la Puente P, Azab F, Azab AK. The role of hypoxia in cancer progression, angiogenesis, metastasis, and resistance to therapy. Hypoxia. 2015;3:83–92. doi: 10.2147/HP.S93413. [DOI] [PMC free article] [PubMed] [Google Scholar]
- 19.Rita Monteiro A, Hill R, Pilkington GJ, Madureira PA. The role of hypoxia in glioblastoma invasion. Cells. 2017;6:45–24. doi: 10.3390/cells6040045. [DOI] [PMC free article] [PubMed] [Google Scholar]
- 20.Warren DR, Partridge M. The role of necrosis, acute hypoxia and chronic hypoxia in F18-FMISO PET image contrast: a computational modelling study. Phys Med Biol. 2016;61:8596–8624. doi: 10.1088/1361-6560/61/24/8596. [DOI] [PMC free article] [PubMed] [Google Scholar]
- 21.Wang W, Georgi J-C, Nehmeh SA, Narayanan M, Paulus T, Bal M, et al. Evaluation of a compartmental model for estimating tumor hypoxia via FMISO dynamic PET imaging. Phys Med Biol. 2009;54:3083–3099. doi: 10.1088/0031-9155/54/10/008. [DOI] [PMC free article] [PubMed] [Google Scholar]