

Abstract
Introduction
Our goal was to determine if features of surgical patients, easily obtained from the medical chart or brief interview, could be used to predict those likely to experience more rapid cognitive decline following surgery.
Methods
We analyzed data from an observational study of 560 older adults (≥70 years) without dementia undergoing major elective non‐cardiac surgery. Cognitive decline was measured using change in a global composite over 2 to 36 months following surgery. Predictive features were identified as variables readily obtained from chart review or a brief patient assessment. We developed predictive models for cognitive decline (slope) and predicting dichotomized cognitive decline at a clinically determined cut.
Results
In a hold‐out testing set, the regularized regression predictive model achieved a root mean squared error (RMSE) of 0.146 and a model r‐square (R2) of .31. Prediction of “rapid” decliners as a group achieved an area under the curve (AUC) of .75.
Conclusion
Some of our models could predict persons with increased risk for accelerated cognitive decline with greater accuracy than relying upon chance, and this result might be useful for stratification of surgical patients for inclusion in future clinical trials.
Keywords: cognitive decline, delirium, machine learning, model prediction, post‐operative, statistical learning
1. INTRODUCTION
Prior studies have documented the substantial risk of cognitive decline following surgery. 1 Although it remains unclear whether the surgery itself, the associated anesthesia, and/or other perioperative factors are causal, 2 the ability to predict who is at risk for cognitive decline after surgery would represent an important advance both to guide clinical care (eg, intensive monitoring, preventive strategies) and to plan enrollment into clinical trials to test intervention strategies to ameliorate post‐operative cognitive decline. The conduct of these intensive interventions and clinical trials would benefit from the ability to predict risk for cognitive decline following surgery prior to admission, an approach that requires prediction based on pre‐operative characteristics.
Thus the goal in the present study was to use modern predictive modeling strategies—including machine learning techniques 3 —to derive a predictive model for long‐term cognitive change following elective surgery. In keeping with an anticipated goal of using the predictive model to rapidly screen potential research participants for inclusion in intensive clinical interventions or in randomized controlled trials, we limited our potential predictive features to elements that could be readily obtained from a chart review or brief pre‐operative patient assessment.
2. METHODS
2.1. Source of patient information
We analyzed data from the Successful Aging after Elective Surgery (SAGES) study. The SAGES study design and methods have been described in detail previously. 4 , 5 In brief, eligible participants were age 70 years and older, English speaking, scheduled to undergo elective surgery at one of two Harvard‐affiliated academic medical centers and with an anticipated length of stay of at least 3 days. Eligible surgical procedures included: total hip or knee replacement; lumbar, cervical, or sacral laminectomy; lower extremity arterial bypass; open abdominal aortic aneurysm repair; and open or laparoscopic colectomy. Exclusion criteria were dementia, delirium at pre‐surgical baseline, hospitalization within the past 3 months, terminal condition, legal blindness, severe deafness, history of schizophrenia or psychosis, and medical‐record documented history of alcohol abuse or withdrawal within the past 6 months and/or self‐reporting more than five drinks per day for men (or four drinks per day for women). A total of 560 patients met all eligibility criteria and were enrolled between June 18, 2010 and August 8, 2013. Written informed consent for study participation was obtained from all participants according to procedures approved by the institutional review boards of Beth Israel Deaconess Medical Center and Brigham and Women's Hospital, the two study hospitals, and Hebrew SeniorLife, the coordinating center for the study.
2.2. Assessment of cognitive functioning and cognitive decline
Cognitive functioning was assessed with a battery of 11 neuropsychological tests at preoperative baseline and at months 1, 2, 6, 12, 18, 24, and 36 following surgery. The neuropsychological battery included tests of attention, memory, language, and executive functioning, and a composite score (general cognitive performance, GCP) was generated and standardized to a mean of 50 and standard deviation of 10 relative to a nationally representative sample of older adults aged 70 and over. 6 , 7 In this analysis we use estimated slopes from a piecewise linear mixed‐effect model that captures change from the 2‐ through 36‐month follow‐up window separately from short‐term fluctuations occurring between baseline and 1 month follow‐up, and the 1‐month and 2‐month follow‐up. 8 Our prior studies demonstrated a typical period of postoperative decline at 1 month that improved by 2 months follow‐up. Therefore, this time period of cognitive fluctuation was excluded from the long‐term trajectory. The outcome variable for predictive models of slope was the maximum likelihood estimate of each patients’ slope estimated over the interval 2 to 36 months following surgery. The cognitive slope was estimated from a maximum likelihood random‐effects growth curve model that uses all available data under the assumption that, conditional on observed cognitive variables and covariates, the reason for missingness is unrelated to the values that would have been observed if they had been observed. This is the conditionally missing at random assumption. Inouye et al., 8 describe missing data in the repeated cognition and sensitivity analyses regarding missing data in the estimation of slope. About 11% of the sample was lost to follow‐up over the follow‐up period. The outcome variable for predictive models of steep slope was a binary variable splitting the estimated slope into those where the slope was less than −0.5 GCP units per year versus higher. Finally, it is important to note that although the study collected detailed neuropsychological performance data pre‐operatively, we do not use the pre‐operative neuropsychological test performance data in our predictive models. This decision reflects our intention that the predictive models use only variables that could conceivably be used in future research to rapidly screen potential research participants for inclusion in intensive clinical interventions or in randomized controlled trials. Therefore, only elements that could be readily obtained from a chart review or brief pre‐operative patient assessment were included.
2.3. Predictive features
Participants underwent baseline assessment in their homes approximately 2 weeks (mean [standard deviation] 13 [15] days) prior to surgery. All study interviews were conducted by experienced interviewers who underwent 2to 4 weeks of intensive training and standardization. Inter‐rater reliability assessment and standardization on all key study variables were conducted every 6 months throughout the study. Medical records were reviewed by study clinicians to collect information on surgical procedure, abnormal laboratory results, baseline diagnoses, among other factors not utilized in this analysis (Hshieh et al., 2019). Chart abstraction data were checked randomly for illogical values and against data collected as part of the screening process (eg, surgery type). In addition, a 10% subset of charts underwent re‐abstraction for reliability checks.
From this information set, we identified features for use in our predictive models. Potential predictors were required either to be readily available in a clinical setting through existing sources (eg, medical record or standard laboratory data) or through quick screening tests that would be feasible in a busy clinical setting. All candidate predictive features represented pre‐operative characteristics, and notably exclude post‐operative factors including delirium and cognitive decline. We decided that although pre‐surgical medication use could be predictive of post‐operative risk of cognitive decline, the process of identifying predictors from among the multitude of medications in various formulations and dosages would require extensive pre‐processing and would not satisfy the criterion of ready availability in a clinical setting. Of the remaining potential features, 71 pre‐operative variables were selected and included demographic characteristics, lifestyle factors, cognitive function, physical function, psychosocial factors, frailty, sensory function, medical conditions, and laboratory values (Appendix Table S1). Missing data in the feature set were multiply imputed by chained equations.
RESEARCH IN CONTEXT
Systematic review. This article does not include a systematic literature review of predictive models for post‐operative cognitive decline. However, we do make reference to early and important work in this area.
Interpretation. Using readily available information from the medical chart, a predictive model can be generated that offers some improvement over random chance in predicting those patients that are at higher than average risk of cognitive decline. This might not be useful for patient care, but can improve the efficiency of large trials where recruitment of a large number of patients is necessary to test interventions.
Future directions. The predictive model may be improved by accessing information that is available, but not easily obtained, from the medical chart and electronic health record.
2.4. Data analysis
The full data set (n = 560) was split into an 80% training (or model development) set and a 20% testing (or hold‐out, validation) set. Models were developed using the training set, and evaluated using the testing set. All indices of model fit and predictive power reported in the manuscript reflect results in the 20% testing set. Our principal approach for developing a predictive model was regularized regression, which seeks to prevent over‐inclusion of extraneous features by eliminating associations that are small in magnitude or likely due to chance. 9 For this we used elastic net regularization, which combines the LASSO (least absolute shrinkage and selection operator) and ridge regression. 10 The LASSO also automatically performs variable selection, resulting in parsimonious models. As a sensitivity analysis, we also evaluated other well‐known predictive model approaches including stepwise linear regression, multivariate adaptive splines, random forest, gradient boosted models, neural network, and k‐nearest neighbor models. 11 All predictive model derivation procedures used 10 repeats of 4‐fold cross‐validation. We examined the quality of our predictive model in terms of the square root mean deviation between predicted and observed values. In keeping with our goal of identifying persons for inclusion in a randomized controlled trial, we also identified persons with a slope less (more negative) than a clinically determined threshold, −0.5 GCP units per year, as experiencing “rapid” cognitive decline, and compared classification of persons lower than this threshold on observed slopes. Model calibration was examined by inspecting observed and predictive cognitive slopes.
3. RESULTS
Patient characteristics, including the selected feature set, are described in Table 1. The training and testing sets were selected at random, so any differences in the training and test data sets were due to chance. None of the differences across training and testing sets exceed an effect size (Cohen's h for proportions, d for continuous variables 12 ) of 0.15, well below the conventional threshold for small effects. The mean effect size was 0.07 across all features.
TABLE 1.
Pre‐operative patient characteristics
| Training | Testing | Overall | |
|---|---|---|---|
| Patient characteristic | (n = 421) | (n = 139) | (n = 560) |
| Age (years), mean (SD) | 76.8 (5.2) | 76.2 (5.0) | 76.6 (5.2) |
| Female sex, n/N (%) | 257/421 (61%) | 69/139 (50%) | 326/560 (58%) |
| Nonwhite race, n/N (%) | 31/421 (7%) | 11/139 (8%) | 42/560 (8%) |
| Education (years), mean (SD) | 14.8 (2.9) | 15.4 (3.1) | 15.0 (3.0) |
| Past smoker, n/N (%) | 241/421 (57%) | 71/139 (51%) | 312/560 (56%) |
| Current smoker, n/N (%) | 19/421 (5%) | 7/139 (5%) | 26/560 (5%) |
| Alcohol ≥5 times/week, n/N (%) | 77/418 (18%) | 29/136 (21%) | 106/554 (19%) |
| Hearing impairment, n/N (%) | 137/420 (33%) | 45/139 (32%) | 182/559 (33%) |
| Length of stay (days), mean (SD) | 5.3 (3.2) | 5.5 (3.7) | 5.3 (3.4) |
| Charlson Comorbidity Index score ≥2, n/N (%) | 123/421 (29%) | 41/139 (29%) | 164/560 (29%) |
| ASA class ≥3, n/N (%) | 269/421 (64%) | 84/139 (60%) | 353/560 (63%) |
| Surgery type, n/N (%) | |||
| Orthopedic | 343/421 (81%) | 111/139 (80%) | 454/560 (81%) |
| Vascular | 27/421 (6%) | 8/139 (5%) | 35/560 (6%) |
| Gastrointestinal | 51/421 (12%) | 20/139 (14%) | 71/560 (13%) |
| White blood count (× 103), mean (SD) | 7.3 (2.2) | 7.0 (1.7) | 7.2 (2.1) |
| Hematocrit (%), mean (SD) | 39.3 (3.7) | 40.1 (3.7) | 39.5 (3.7) |
| Creatinine (mg/dL), mean (SD) | 1.00 (0.30) | 0.97 (0.28) | 0.99 (0.29) |
| Sodium (mEq/L), mean (SD) | 139.5 (2.7) | 139.4 (2.5) | 139.5 (2.6) |
| Oxygen saturation (on room air) (%), mean (SD) | 98.0 (1.4) | 98.0 (1.5) | 98.0 (1.5) |
| BUN/creatinine ratio, mean (SD) | 23.0 (6.0) | 22.0 (6.0) | 23.0 (6.0) |
Abbreviations: ASA, American Society of Anesthesiologists Physical Status Classification; BUN, blood urea nitrogen.
Figure 1 illustrates the agreement between predicted slope (y‐axis) and observed slope (x‐axis) given the regularized regression predictive model. The RMSE (root mean squared error) for this model was 0.146 in units of change in GCP per year (Table 2). Relative to an observed mean slope of −0.6 per year, and observed standard deviation of 0.9, this RMSE reveals poor prediction. The calibration plot in Figure 1 suggests that the predicted model was unable to generate predictions lower than −0.6 GCP points per year, whereas the observed slopes range from a low of about −0.9. The implication is that when the observed slope is very low, the predictors we have included are unable to generate predictions that come close to the observed values. Sensitivity analysis considering other methods of generating predictive models failed to produce models with a lower RMSE than regularized regression (Table 2) and produced similar calibration plots (Appendix Figure S1). However, the multivariate adaptive splines model was comparable to the regularized regression model in terms of RMSE (0.148 vs 0.146), but had a lower r‐squared (.26 vs .31). Both of these models had lower RMSE than linear regression (0.165) and substantially greater r‐squared relative to linear regression (.15).
FIGURE 1.
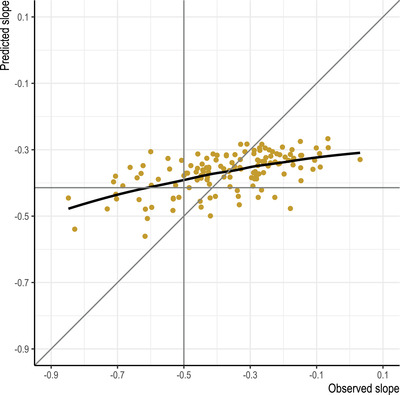
Calibration plot for regularized regression model predicting cognitive decline over months 2 to 36 following elective surgery
TABLE 2.
Comparison of machine learning algorithms for prediction of cognitive decline as a linear outcome and as a binary outcome indicating decline faster than −0.5 GCP units per year
| Predicting slope | Predicting slope less than or equal to − 0.5 GCP points/year | ||||
|---|---|---|---|---|---|
| Algorithm | RMSE | R2 | AUC | PPV | NPV |
| Regularization regression | 0.146 | .31 | 0.75 | 0.48 | 0.86 |
| Multivariate adaptive regression splines | 0.148 | .26 | 0.76 | 0.63 | 0.88 |
| Random forest | 0.153 | .19 | 0.74 | 0.41 | 0.84 |
| K‐nearest neighbor | 0.166 | .09 | 0.65 | 0.47 | 0.83 |
| Gradient boosted model | 0.170 | .06 | 0.72 | 0.44 | 0.85 |
| Neural network | 0.199 | .10 | 0.72 | 0.48 | 0.86 |
| Linear regression | 0.165 | .15 | – | – | – |
| Logistic regression | – | – | 0.68 | 0.41 | 0.84 |
Notes: All statistics in Table 2 reflect models estimated in training data and validated in a hold‐out sample not included in the derivation. Abbreviations: RMSE (root mean squared error) are in units of GCP slope per year. R2 is coefficient of determination; AUC = area under the (ROC) curve; PPV = positive predictive value (true positive over true positive + false positive); NPV = negative predictive value (true negative over true negative plus false negative); SVM, support vector machine.
We considered that the predictive model generated from the target features could identify patients with a slope that indicated a pace of cognitive decline that was atypical, and consistent with mild cognitive impairment (−0.5 GCP units per year; Inouye et al., 2016). These results are reported in Table 2. This cut‐point identifies the top 45% of the observed sample. The predictive model derived from regularized regression returns an area under the receiver‐operating characteristic curve (AUC) of 0.75 for this outcome, only slightly lower than for multivariate adaptive spline (0.76) and higher than for random forest (0.74). Logistic regression was noticeably less accurate (AUC = 0.68). The model with the highest positive predictive value (proportion of those flagged by the algorithm who do have an accelerated slope) was 63% for the multivariate adaptive regression splines model, followed by the regularized regression and neural network models (both 48%).
4. DISCUSSION
Using a large number of sociodemographic, functional, and clinical characteristics, we generated a predictive model for cognitive decline from 2 months to about 3 years following elective surgery that achieved our goal of improving prediction above the baseline rate. This improvement in prediction could be used to provide some gains in the efficiency over simple random sampling in future clinical trials targeted at the prevention of long‐term cognitive decline following surgery. For a randomly selected pair of persons—one with and one without observed clinically significant cognitive decline—the probability that the person with observed clinically significant cognitive decline has a higher predicted probability of being observed with clinically significant cognitive decline is 75%. The positive predictive value was only 48% for regularized regression but was 63% for multivariate adaptive splines. Compared to the base rate of 45% for the prevalence of persons with clinically adjudged significant cognitive decline, a prediction rule for enrollment in a clinical trial using our multivariate adaptive splines model would provide some benefit.
Although we achieved the overall goal of our study, it is important to acknowledge that the overall predictive model was limited in its predictive accuracy and model fit. A potential weakness of our study is the limited number of participants for developing and validating predictive models (n = 560). 13 However, our study offers a number of strengths that, prior to engaging in the described analysis, we hoped would offset this limitation. Strengths include a well‐characterized cohort with few missing data, evaluation of cognitive functioning using a rich battery of neuropsychological tests, and relatively long follow‐up of the cohort. Our results may have been hampered by the restriction to easily‐identifiable data elements and the omission of key variables of importance to account for cognitive decline after surgery. For example, we did not include baseline cognitive functioning, genetic information (eg, apolipoprotein E gene variant (APOE) ε4) or other biomarkers, and we did not include medications. We elected not to include variables that would be difficult or time‐consuming to collect prior to surgery in order to increase the clinical applicability of the results and increase the utility of these models for recruitment from clinical settings into large, multi‐site clinical trials. Moreover, the course of long‐term cognitive decline following surgery may not be linear, and further exploration of potential non‐linear changes over time may improve model fit.
Future studies will need to include other factors, which may be key to predicting long‐term cognitive decline after surgery, such as intra‐operative and peri‐operative factors (eg, anesthesia type, surgical duration, blood loss, hypotension, medications), post‐operative factors (eg, stroke, myocardial infarction, infection), and other biological factors (inflammatory markers, biomarkers for neuronal injury, neuroimaging or electrophysiologic markers). These may represent key factors in the pathophysiologic pathway to delirium, and ultimately, may be important to improve overall prediction in this sample. Investigation of these factors is a critically important next step to advance our understanding of cognitive decline following surgery.
RISE STUDY GROUP
[Presented in alphabetical order; individuals listed may be part of multiple groups, but are listed only once under major activity, listed in parentheses].
Principal Investigator: Sharon K. Inouye, MD, MPH (Overall PI; HSL, BIDMC, HMS).
Executive Committee: Steven Arnold, MD (MGH); Bradford Dickerson, MD (MGH Site PI, HMS); Tamara Fong, MD, PhD (HMS, HSL, BIDMC); Richard Jones, ScD (Brown University); Towia Libermann, PhD (HMS, BIDMC); Edward R. Marcantonio, MD, SM (BIDMC Site PI, HMS); Thomas Travison, PhD (HSL, HMS).
Co‐Investigators: Simon T. Dillon, PhD (HMS, BIDMC); Jacob Hooker, PhD, (MGH, HMS) Tammy Hshieh, MD (BWH); Long Ngo, PhD (HMS, BIDMC), Hasan Otu, PhD (UNL), Annie Racine, PhD (HMS, HSL); Eva M. Schmitt, PhD (Overall Project Director, HSL); Alexandra Touroutoglou, PhD (HMS, MGH); Sarinnapha Vasunilashorn, PhD (BIDMC).
Surgical Leaders: Ayesha Abdeen, MD (HMS, BIDMC); Douglas Ayres, MD (HMS, BIDMC); Brandon Earp, MD (HMS, BWH); Jeffrey Lange, MD (HMS, BWH).
Surgeons: Gregory Brick, MBCHB (HMS, BWH); Antonia Chen, MD (HMS, BWH); Robert Davis, MD (HMS, BIDMC); Jacob Drew, MD (HMS, BIDMC);Richard Iorio, MD (HMS, BWH); Fulton Kornack, MD (HMS, BWH); Michael Weaver, MD (HMS, BWH); Anthony Webber, MD (HMS, BWH); Richard Wilk, MD (HMS, BWH).
Anesthesiology Leaders: Lisa Kunze, MD (BIDMC, HMS); David Shaff, MD (BWH, HMS); Kamen Vlassakov, MD (BWH, HMS).
Epidemiology Core: Brett Armstrong, MPH (BIDMC); Angelee Banda, MA (BIDMC); Sylvie Bertrand, BS (HSL); Madeline D'Aquila (HSL); Jacqueline Gallagher, MS (BIDMC); Baileigh Hightower, BA (MGH); Shannon Malloy, MA (BIDMC); Jacqueline Nee, BA (HSL); Chloe Nobuhara (MGH); Abigail Overstreet, MA (BIDMC); Bianca Trombetta (MGH); David Urick (MGH); Guoquan Xu, MD, PhD (HSL).
Biomedical Imaging Core: Grae Arabasz (MGH); Michael Brickhouse (MGH); Regan Butterfield (MGH); Baileigh Hightower, BA (MGH); Shirley Hsu (MGH); Sara Makaretz (MGH); Judit Sore (MGH).
Data Management and Statistical Analysis Core: Fan Chen, MPH, MS (HSL); Yun Gou, MA (HSL); Douglas Tommet, MS (Brown University).
Fiscal Management Committee: Sabrina Carretie (HSL); Ted Gruen (HSL); Katherine Tasker (Chair, HSL).
CONFLICTS OF INTEREST
The authors declare no competing interests.
Supporting information
Supporting information
Supporting information
ACKNOWLEDGEMENTS
The authors gratefully acknowledge the contributions of the patients, family members, nurses, physicians, staff members, and members of the Executive Committee who participated in the Successful Aging after Elective Surgery (SAGES) study and the Role of Inflammation after Surgery in Elders (RISE) study. Members of the RISE study group are listed in the supplementary material. This work is dedicated to the memory of Joshua Bryan Inouye Helfand. The authors would like to acknowledge all authors who fulfilled authorship criteria, as well as all members of the larger RISE Study group. This work was supported by the Alzheimer's Drug Discovery Foundation, the National Institutes of Health [P01AG031720 (SKI), R24AG054259 (SKI), R01AG044518 (SKI/RNJ), K24AG035075 (ERM)]. Dr. Inouye holds the Milton and Shirley F. Levy Family Chair. The funding sources had no role in the design, conduct, or reporting of this study.
Jones RN, Tommet D, Steingrimsson J, et al. Development and internal validation of a predictive model of cognitive decline 36 months following elective surgery. Alzheimer's Dement. 2021;13:e12201. 10.1002/dad2.12201
Annie M. Racine, Tamara G. Fong, Yun Gou, Eva M. Schmitt, Thomas G. Travison, Edward R. Marcantonio, Sharon K. Inouye: All work on this project was completed while employed at the Aging Brain Center, Marcus Institute for Aging Research, Hebrew SeniorLife, Boston, Massachusetts, USA
REFERENCES
- 1. Selnes OA, Gottesman RF. Neuropsychological outcomes after coronary artery bypass grafting. J Int Neuropsychol Soc. 2010;16(2):221. [DOI] [PubMed] [Google Scholar]
- 2. Avidan MS, Evers AS. Review of clinical evidence for persistent cognitive decline or incident dementia attributable to surgery or general anesthesia. J Alzheimers Dis. 2011;24(2):201‐216. [DOI] [PubMed] [Google Scholar]
- 3. Bi Q, Goodman KE, Kaminsky J, Lessler J. What is machine learning? A primer for the epidemiologist. Am J Epidemiol. 2019;188(12):2222‐2239. [DOI] [PubMed] [Google Scholar]
- 4. Schmitt EM, Marcantonio ER, Alsop DC, et al. Novel risk markers and long‐term outcomes of delirium: the successful aging after elective surgery (SAGES) study design and methods. JAMDA. 2012;13(9):818. e811–810. [DOI] [PMC free article] [PubMed] [Google Scholar]
- 5. Schmitt EM, Saczynski JS, Kosar CM, et al. The successful aging after elective surgery study: cohort description and data quality procedures. J Am Geriatr Soc. 2015;63(12):2463‐2471. [DOI] [PMC free article] [PubMed] [Google Scholar]
- 6. Gross AL, Jones RN, Fong TG, Tommet D, Inouye SK. Calibration and validation of an innovative approach for estimating general cognitive performance. Neuroepidemiology. 2014;42(3):144–153. [DOI] [PMC free article] [PubMed] [Google Scholar]
- 7. Jones RN, Rudolph JL, Inouye SK, et al. Development of a unidimensional composite measure of neuropsychological functioning in older cardiac surgery patients with good measurement precision. J Clin Exp Neuropsychol. 2010;32(10):1041‐1049. [DOI] [PMC free article] [PubMed] [Google Scholar]
- 8. Inouye SK, Marcantonio ER, Kosar CM, et al. The short‐term and long‐term relationship between delirium and cognitive trajectory in older surgical patients. Alzheimers Dement. 2016;12(7):766‐775. [DOI] [PMC free article] [PubMed] [Google Scholar]
- 9. Jia J, Yu B. On model selection consistency of the elastic net when p⪢ n. Statistica Sinica. 2010:595‐611. [Google Scholar]
- 10. Zou H, Hastie T. Regularization and variable selection via the elastic net. J Roy Stat Soc Ser B (Stat Method). 2005;67(2):301‐320. [Google Scholar]
- 11. Kuhn M, Johnson K. Applied Predictive Modeling. Springer; 2013. [Google Scholar]
- 12. Cohen J. Statistical Power Analysis for the Behavioral Sciences. Hillsdale, NJ: Lawrence Erlbaum Associates; 1988. [Google Scholar]
- 13. van der Ploeg T, Austin PC, Steyerberg EW. Modern modelling techniques are data hungry: a simulation study for predicting dichotomous endpoints. BMC Med Res Method. 2014;14(1):137. [DOI] [PMC free article] [PubMed] [Google Scholar]
Associated Data
This section collects any data citations, data availability statements, or supplementary materials included in this article.
Supplementary Materials
Supporting information
Supporting information