

Abstract
Background & Aims:
Histologic features of inflammation (histologic inflammation) are associated with clinical relapse in patients with ulcerative colitis (UC). Concentration of fecal calprotectin (FC) can be used to identify patients with mucosal inflammation. We aimed to assess the accuracy of FC measurements in identifying patients with histologic inflammation and to develop a model to predict outcomes of therapy.
Methods:
We performed a post-hoc analysis of data from a phase 4 trial of the efficacy of multi-matrix mesalamine in patients with mild to moderate UC (the MOMENTUM trial). We obtained clinical, endoscopic, and histology data from week 8 (n=639) and week 52 (n=373) of the trial. We used area under the receiver operating characteristic (AUROC) curves to determine the accuracy and optimal cutoff levels of FC in identifying patients with different therapeutic outcomes (clinical remission, endoscopic healing, deep remission, or histologic remission) at week 8 and week 52. We performed multivariable logistic regression analyses to identify factors associated with these outcomes.
Results:
Median FC concentrations were lower in patients who achieved outcomes of clinical remission, endoscopic healing, deep remission, or histologic remission vs patients who did not. FC concentration identified patients with endoscopic healing and histologic remission with AURUC curve values of 0.77 and 0.76 at week 8, and 0.79 and 0.80 at week 52, respectively. The optimal FC cutoff concentrations for identification of patients with histologic remission were 75 μg/g at week 8 and 99 μg/g at week 52. In the subpopulation with an endoscopy score of 0, median FC concentrations were lower in patients with histologic remission than in patients with microscopic inflammation at week 8 (30 μg/g vs 140 μg/g AUROC, 0.72) and week 52 (21.5 μg/g vs 134.5 μg/g AUROC, 0.71). At both time points, the optimal FC cutoff concentration was approximately 75 μg/g. Our final prediction model for week 52 histologic remission comprised endoscopic score at week 8, FC concentration at week 8, and histologic activity at baseline and week 8.
Conclusions:
A post-hoc analysis of data from a phase 4 trial found that, even in patients with complete endoscopic healing of UC, FC concentration can be used to discriminate patients with ongoing microscopic inflammation from patients with histologic remission. The optimal cutoff concentration of FC is between 75 and 100 μg/g. ClinicalTrials.gov no: NCT01124149.
Keywords: biomarker, histology, inflammatory bowel disease, prognostic
INTRODUCTION
Over the past decade there has been an evolution in therapeutic targets in inflammatory bowel disease (IBD). Treatment success is now defined by a combination of both symptom control and healing of the intestinal mucosa.1 In ulcerative colitis (UC), there is mounting evidence that histological healing is associated with improved outcomes, including a reduced risk of clinical relapse, surgery, and fibrosis.2–8 Whether histological remission should be adopted as a target in clinical practice remains controversial, in part due to the cost and invasive nature of endoscopy with biopsy procurement and analysis. Moreover, considerable discrepancies have been reported between histological disease activity as assessed by general pathologists (in daily practice) and expert gastrointestinal pathologists, which would limit widespread implementation.9 An accurate and noninvasive surrogate marker of histological inflammation would therefore be of great benefit.
The diagnostic accuracy of fecal calprotectin (FC) for endoscopic inflammation in UC is relatively high.10–14 Furthermore, some studies have shown an acceptable correlation between FC values and histological disease activity, however, with great heterogeneity in design, patient numbers, scoring indices, and definitions of remission.15–18 Recently, a large post-hoc analysis on the data from different clinical trials, showed that FC levels are associated with the levels of different histological grading indices and are related to the presence of neutrophils.19
Aminosalicylates are the first line treatment for patients with mild-to-moderate UC.20 In the MOMENTUM trial, adult patients with mild-to-moderate UC who responded to multimatrix mesalamine 4.8 g/day at week 8 received 12 months of multimatrix mesalamine 2.4 g/day maintenance treatment.21 In this post hoc analysis of the MOMENTUM trial, we aimed to (i) investigate the diagnostic accuracy of FC for endoscopic and histological remission and (ii) develop a prediction model for different levels of remission after 1 year of treatment.
MATERIALS AND METHODS
This was a post hoc analysis of a previously published prospective clinical trial, MOMENTUM (ClinicalTrials.gov identifier: NCT01124149).21 Data are reported according to the STARD checklist for the reporting of studies of diagnostic accuracy and the TRIPOD checklist for the reporting of multivariable prediction models.22, 23 All authors had access to the study data and reviewed and approved the final manuscript. This trial was conducted with approval of an Institutional Review Board at each site and in accordance with current applicable regulations, International Conference on Harmonisation Good Clinical Practice, and local ethical and legal requirements, and in line with the principles of the Declaration of Helsinki. All participating patients provided written informed consent prior to screening.
Inclusion and exclusion criteria for study participants and study treatments are detailed in the Supplementary Materials.
Procedures
Fecal samples were collected at screening and at weeks 8 and 52 or at early withdrawal for the measurement of FC concentration. FC was measured by a quantitative enzyme-linked immunosorbent assay, using in-house kits. The upper detection limit was 2500 μg/g. Sigmoidoscopies were performed at screening and at weeks 8 and 52 or at early withdrawal. As predefined in the original study protocol, 2 biopsies were taken in the rectum (≤15 cm of the anal verge, avoiding the center of ulcers) during all endoscopies. If the worst inflamed area was not the rectum, 2 additional biopsies were taken from the worst inflamed area, usually the sigmoid, avoiding the center of ulceration (i.e., total of 4 biopsies).
Histology Scoring
Biopsies were fixed in neutral buffered formalin. Deidentified biopsies were then paraffin embedded at a central histopathology laboratory (GdH). Serial sections (5 μm thickness) were stained with hematoxylin/Eosin and scored using a grading system based on the Geboes grading scale24 by 2 independent histopathologists (GdH and JRT) who were blinded of the time point, participant’s clinical course and endoscopic findings. Participants without histologically active disease at baseline were excluded from the study. If a discrepancy between the score of both histopathologists existed, the score of the lead histopathologist (GdH) was used. To evaluate the correlation between FC and histological disease activity, the histology data were transformed to an ordinal Geboes score, ranging from 0–13. The ordinal score was calculated as the sum of the grading values within each of the Geboes score ≥2B parameters (lamina propria neutrophils, neutrophils in epithelium, crypt destruction, and erosion/ulceration; supplementary table 1). Parameters related to chronic inflammation (architectural disturbance, mononuclear cell infiltrate, and eosinophils) were scored as 0. Where multiple biopsies were performed at a visit, the largest (maximum) score was used in the analyses.
Outcomes
Endpoints analyzed at the end of the induction (week 8) and maintenance (week 52) phase for the current post hoc analyses were clinical remission (rectal bleeding and stool frequency score of 0), endoscopic healing (modified endoscopic Mayo score ≤1, with complete healing defined as score of 0), deep remission (combination of clinical remission and endoscopic healing), and histological remission (absence of acute histological inflammation, i.e., neutrophils with a drop in ordinal transformed Geboes score from >0 at baseline to 0 post-baseline).
Statistical Analyses
The post hoc analyses mainly focused on the diagnostic accuracy of FC and the development of a prediction model for predefined outcomes at week 52; statistical analyses methods are detailed in the Supplementary Materials.
RESULTS
Patients
Detailed descriptions of baseline patient characteristics and patient disposition through the study were reported previously and are summarized in supplementary table 2 and supplementary figure 1.21
Diagnostic accuracy of FC
Correlation between FC and clinical remission and deep remission
Data on clinical remission and deep remission were available for 605/639 (94.7%) and 593/639 (92.8%) patients, respectively, at week 8 and 310/373 (83.1%) and 305/373 (81.8%) patients, respectively, at week 52. Median [IQR] FC values were lower in patients in clinical remission and deep remission than in patients with ongoing disease activity (figure 1). The accuracy of FC to predict clinical remission and deep remission was assessed by plotting a ROC curve (supplementary figure 2). The diagnostic accuracy (AUC [95% CI]) of this assay was low at both week 8 (0.58 [0.54 – 0.63] for clinical remission and 0.60 [0.55 – 0.64] for deep remission) and week 52 (0.66 [0.59 – 0.73] for clinical remission and 0.67 [0.60 – 0.73] for deep remission). FC test characteristics at different predefined cutoff values for both clinical remission and deep remission are shown in table 1.
Figure 1.
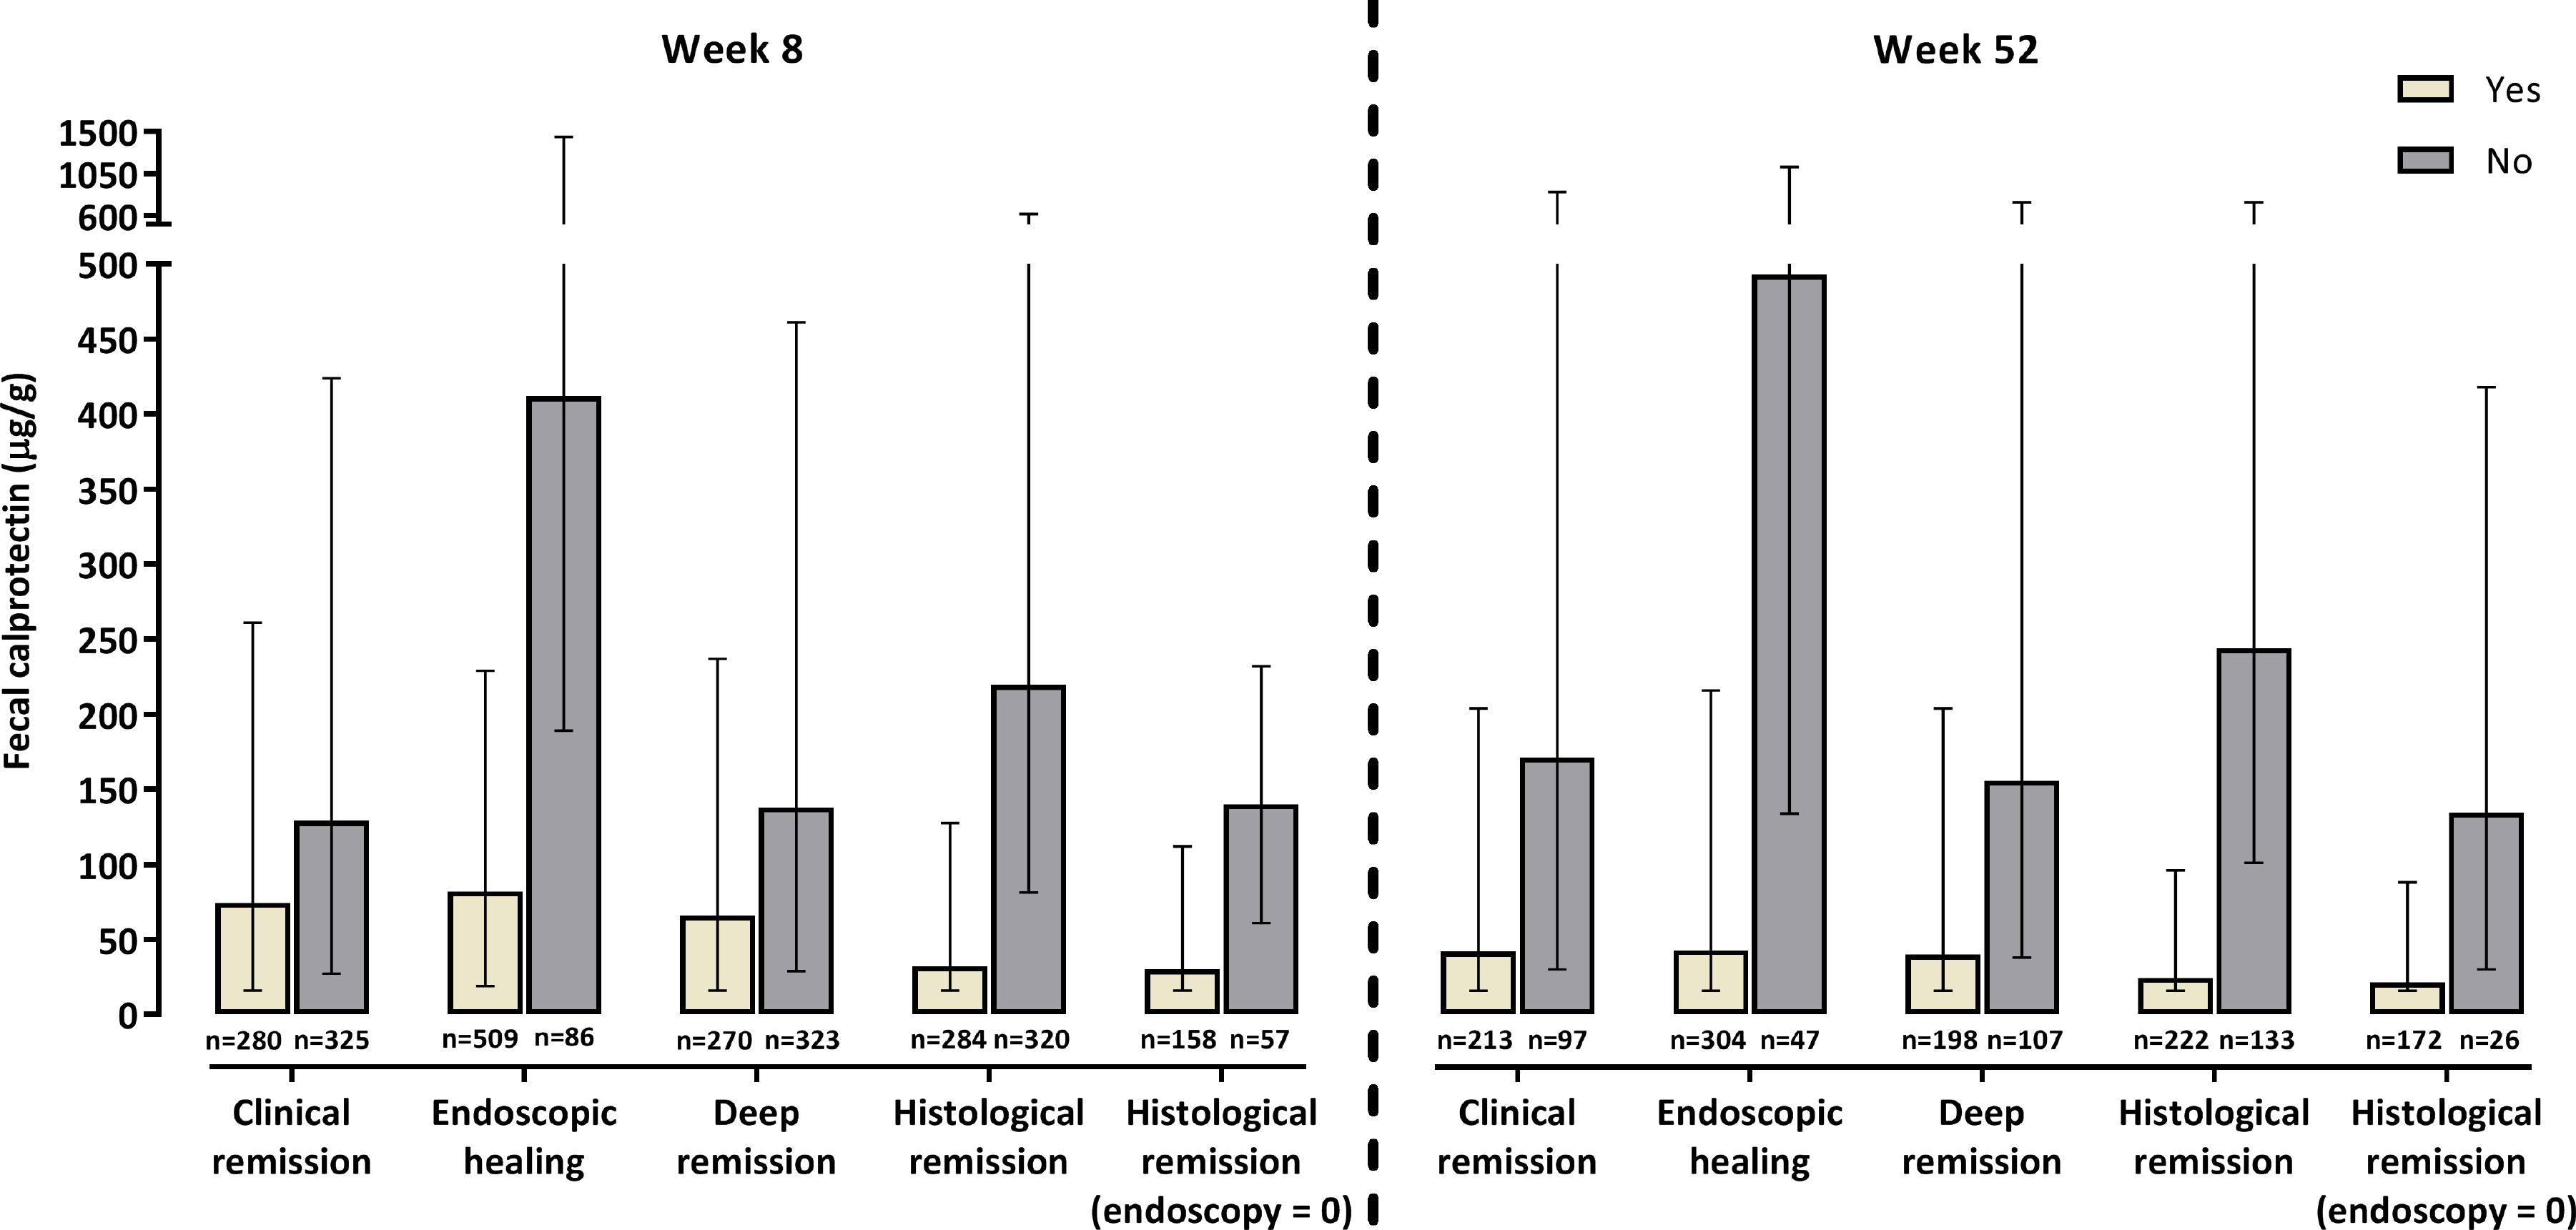
Median FC values at week 8 and week 52 by our predefined outcomes. Whiskers show IQR.
Table 1.
FC test characteristics for several therapeutic outcomes at different FC cutoff values
| FC (μg/g) | Sens | Spec | PPV | NPV | Youden’s Index | FC (μg/g) | Sens | Spec | PPV | NPV | Youden’s Index |
|---|---|---|---|---|---|---|---|---|---|---|---|
|
| |||||||||||
| Week 8 | Week 52 | ||||||||||
|
| |||||||||||
| Clinical remission | |||||||||||
|
|
|||||||||||
| 50 | 0.46 | 0.70 | 0.56 | 0.60 | 0.15 | 50 | 0.53 | 0.72 | 0.81 | 0.41 | 0.25 |
|
|
|||||||||||
| 75 | 0.50 | 0.64 | 0.54 | 0.60 | 0.14 | 76 | 0.58 | 0.65 | 0.78 | 0.41 | 0.23 |
|
|
|||||||||||
| 100 | 0.55 | 0.56 | 0.52 | 0.59 | 0.12 | 99 | 0.66 | 0.63 | 0.80 | 0.46 | 0.29 |
|
|
|||||||||||
| 150 | 0.63 | 0.46 | 0.50 | 0.59 | 0.09 | 147 | 0.71 | 0.56 | 0.78 | 0.47 | 0.27 |
| 202 | 0.68 | 0.40 | 0.49 | 0.59 | 0.07 | 204 | 0.75 | 0.44 | 0.75 | 0.44 | 0.19 |
| 251 | 0.74 | 0.33 | 0.49 | 0.60 | 0.07 | 245 | 0.80 | 0.40 | 0.75 | 0.48 | 0.20 |
| 304 | 0.78 | 0.31 | 0.49 | 0.62 | 0.09 | 296 | 0.81 | 0.36 | 0.74 | 0.47 | 0.17 |
| 348 | 0.81 | 0.30 | 0.50 | 0.65 | 0.11 | 351 | 0.83 | 0.33 | 0.73 | 0.47 | 0.16 |
| 400 | 0.83 | 0.27 | 0.50 | 0.65 | 0.10 | 403 | 0.86 | 0.32 | 0.74 | 0.52 | 0.18 |
| 445 | 0.84 | 0.25 | 0.49 | 0.64 | 0.08 | 447 | 0.87 | 0.30 | 0.73 | 0.52 | 0.17 |
| 498 | 0.85 | 0.24 | 0.49 | 0.65 | 0.09 | 504 | 0.89 | 0.29 | 0.73 | 0.54 | 0.18 |
| Endoscopic healing | |||||||||||
| 50 | 0.42 | 0.88 | 0.95 | 0.20 | 0.30 | 50 | 0.52 | 0.91 | 0.98 | 0.23 | 0.43 |
| 75 | 0.48 | 0.87 | 0.96 | 0.22 | 0.35 | 76 | 0.58 | 0.85 | 0.96 | 0.24 | 0.43 |
|
|
|||||||||||
| 100 | 0.55 | 0.85 | 0.96 | 0.24 | 0.40 | 99 | 0.63 | 0.81 | 0.96 | 0.25 | 0.44 |
|
|
|||||||||||
| 150 | 0.63 | 0.78 | 0.94 | 0.26 | 0.41 | 147 | 0.68 | 0.72 | 0.94 | 0.26 | 0.41 |
| 202 | 0.70 | 0.73 | 0.94 | 0.29 | 0.43 | 204 | 0.74 | 0.66 | 0.93 | 0.28 | 0.40 |
|
|
|||||||||||
| 251 | 0.77 | 0.69 | 0.94 | 0.34 | 0.46 | 245 | 0.79 | 0.62 | 0.93 | 0.31 | 0.40 |
|
|
|||||||||||
| 304 | 0.79 | 0.63 | 0.93 | 0.34 | 0.42 | 296 | 0.81 | 0.62 | 0.93 | 0.33 | 0.43 |
| 348 | 0.81 | 0.59 | 0.92 | 0.35 | 0.41 | 351 | 0.83 | 0.57 | 0.93 | 0.34 | 0.40 |
| 400 | 0.83 | 0.55 | 0.92 | 0.36 | 0.38 | 403 | 0.85 | 0.53 | 0.92 | 0.36 | 0.38 |
| 445 | 0.84 | 0.48 | 0.90 | 0.33 | 0.31 | 447 | 0.87 | 0.51 | 0.92 | 0.37 | 0.38 |
| 498 | 0.85 | 0.44 | 0.90 | 0.33 | 0.29 | 504 | 0.88 | 0.49 | 0.92 | 0.38 | 0.37 |
| Deep remission | |||||||||||
|
|
|||||||||||
| 50 | 0.47 | 0.70 | 0.57 | 0.61 | 0.17 | 50 | 0.54 | 0.74 | 0.79 | 0.46 | 0.28 |
|
|
|||||||||||
| 75 | 0.51 | 0.64 | 0.55 | 0.61 | 0.16 | 76 | 0.59 | 0.65 | 0.76 | 0.46 | 0.25 |
|
|
|||||||||||
| 100 | 0.57 | 0.57 | 0.53 | 0.61 | 0.14 | 99 | 0.67 | 0.63 | 0.77 | 0.50 | 0.29 |
|
|
|||||||||||
| 150 | 0.64 | 0.48 | 0.50 | 0.61 | 0.11 | 147 | 0.71 | 0.54 | 0.74 | 0.50 | 0.25 |
| 202 | 0.69 | 0.41 | 0.49 | 0.61 | 0.10 | 204 | 0.75 | 0.43 | 0.71 | 0.48 | 0.18 |
| 251 | 0.76 | 0.34 | 0.49 | 0.63 | 0.10 | 245 | 0.80 | 0.39 | 0.71 | 0.52 | 0.20 |
| 304 | 0.79 | 0.32 | 0.49 | 0.65 | 0.11 | 296 | 0.82 | 0.36 | 0.70 | 0.51 | 0.17 |
| 348 | 0.83 | 0.31 | 0.50 | 0.68 | 0.14 | 351 | 0.83 | 0.32 | 0.69 | 0.51 | 0.15 |
| 400 | 0.84 | 0.28 | 0.49 | 0.68 | 0.12 | 403 | 0.87 | 0.31 | 0.70 | 0.56 | 0.18 |
| 445 | 0.85 | 0.25 | 0.49 | 0.67 | 0.10 | 447 | 0.88 | 0.30 | 0.70 | 0.57 | 0.18 |
| 498 | 0.86 | 0.24 | 0.49 | 0.68 | 0.10 | 504 | 0.89 | 0.28 | 0.70 | 0.58 | 0.17 |
| Histological remission | |||||||||||
| 50 | 0.59 | 0.82 | 0.74 | 0.69 | 0.41 | 50 | 0.64 | 0.83 | 0.87 | 0.58 | 0.47 |
|
|
|||||||||||
| 75 | 0.65 | 0.77 | 0.71 | 0.71 | 0.42 | 76 | 0.71 | 0.79 | 0.85 | 0.62 | 0.50 |
|
| |||||||||||
| 100 | 0.70 | 0.70 | 0.67 | 0.73 | 0.40 | 99 | 0.77 | 0.75 | 0.84 | 0.66 | 0.52 |
|
|
|||||||||||
| 150 | 0.77 | 0.59 | 0.63 | 0.74 | 0.36 | 147 | 0.80 | 0.65 | 0.79 | 0.66 | 0.46 |
| 202 | 0.82 | 0.53 | 0.61 | 0.77 | 0.35 | 204 | 0.83 | 0.56 | 0.76 | 0.67 | 0.39 |
| 251 | 0.86 | 0.43 | 0.57 | 0.78 | 0.29 | 245 | 0.87 | 0.50 | 0.74 | 0.69 | 0.37 |
| 304 | 0.88 | 0.40 | 0.57 | 0.79 | 0.28 | 296 | 0.88 | 0.47 | 0.73 | 0.70 | 0.35 |
| 348 | 0.91 | 0.39 | 0.57 | 0.83 | 0.30 | 351 | 0.90 | 0.43 | 0.72 | 0.71 | 0.32 |
| 400 | 0.92 | 0.34 | 0.55 | 0.82 | 0.26 | 403 | 0.91 | 0.39 | 0.71 | 0.73 | 0.31 |
| 445 | 0.92 | 0.32 | 0.55 | 0.82 | 0.24 | 447 | 0.93 | 0.37 | 0.71 | 0.75 | 0.30 |
| 498 | 0.93 | 0.31 | 0.54 | 0.84 | 0.24 | 504 | 0.93 | 0.34 | 0.70 | 0.75 | 0.27 |
Bolded values indicate optimal FC cutoffs. Closest data points are presented if cutoffs at 50, 75, 100, 150, 200, 250, 300, 350, 400, 450, 500 are missing in the data.
FC, fecal calprotectin; NPV, negative predictive value; PPV, positive predictive value; Sens, sensitivity; Spec, specificity.
Correlation between FC and endoscopic healing
Data on endoscopic healing were available for 595/639 (93.1%) patients at week 8 and 351/373 (94.1%) patients at week 52. A low positive correlation was observed between FC and the modified endoscopic Mayo score at week 8 (r = 0.359, R2 = 12.9%) and week 52 (r = 0.427, R2 = 18.2%). The distribution of FC across the different endoscopic scores is shown in figure 2. Median FC values were lower in patients with endoscopic healing than in patients without endoscopic healing at week 8 (median [IQR] 82.0 [19.0 – 229.0] vs 412.0 [189.0 – 1442.0] μg/g) and week 52 (43.0 [16.0 – 216.0] vs 493.0 [134.0 – 1125.0] μg/g; figure 1). At week 8, the AUC (95% CI) value for FC and endoscopic healing was 0.77 (0.72 – 0.83; figure 3A). The optimal FC cutoff was 251 μg/g (sensitivity, specificity, positive predictive value [PPV], negative predictive value [NPV], and Youden’s Index for each outcome are shown in table 1). At week 52, the AUC (95% CI) value was 0.79 (0.72 – 0.86; figure 3B), with an optimal FC cutoff of 99 μg/g (table 1).
Figure 2.
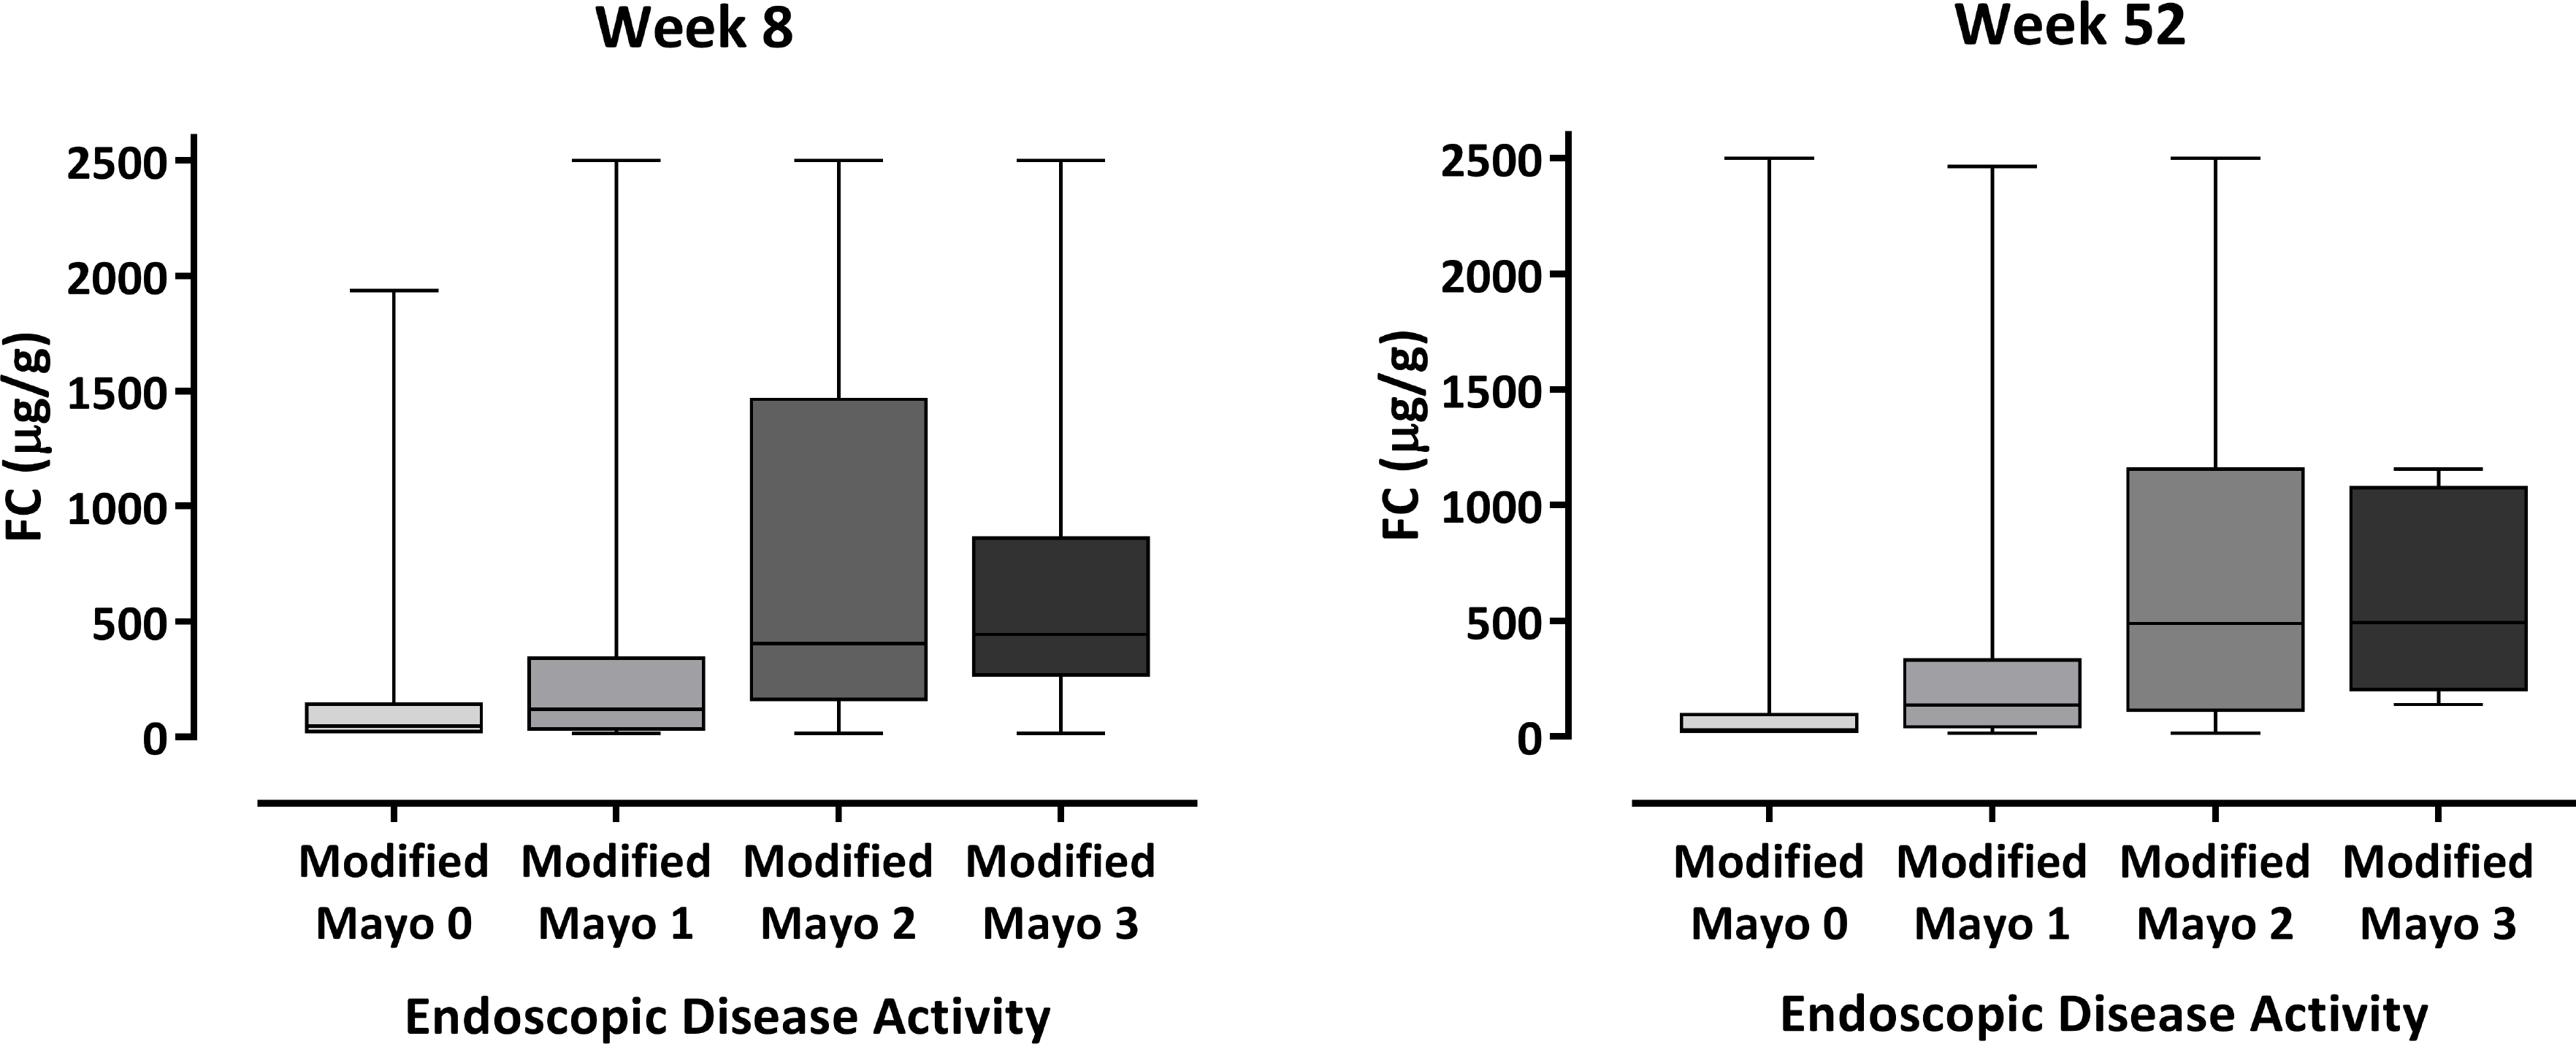
Box plot of FC values at week 8 and week 52 by endoscopic disease activity. The middle line and hinges of the box represent the median FC value with 25th and 75th percentiles, respectively. The whiskers represent the minum and maximum values.
Figure 3.
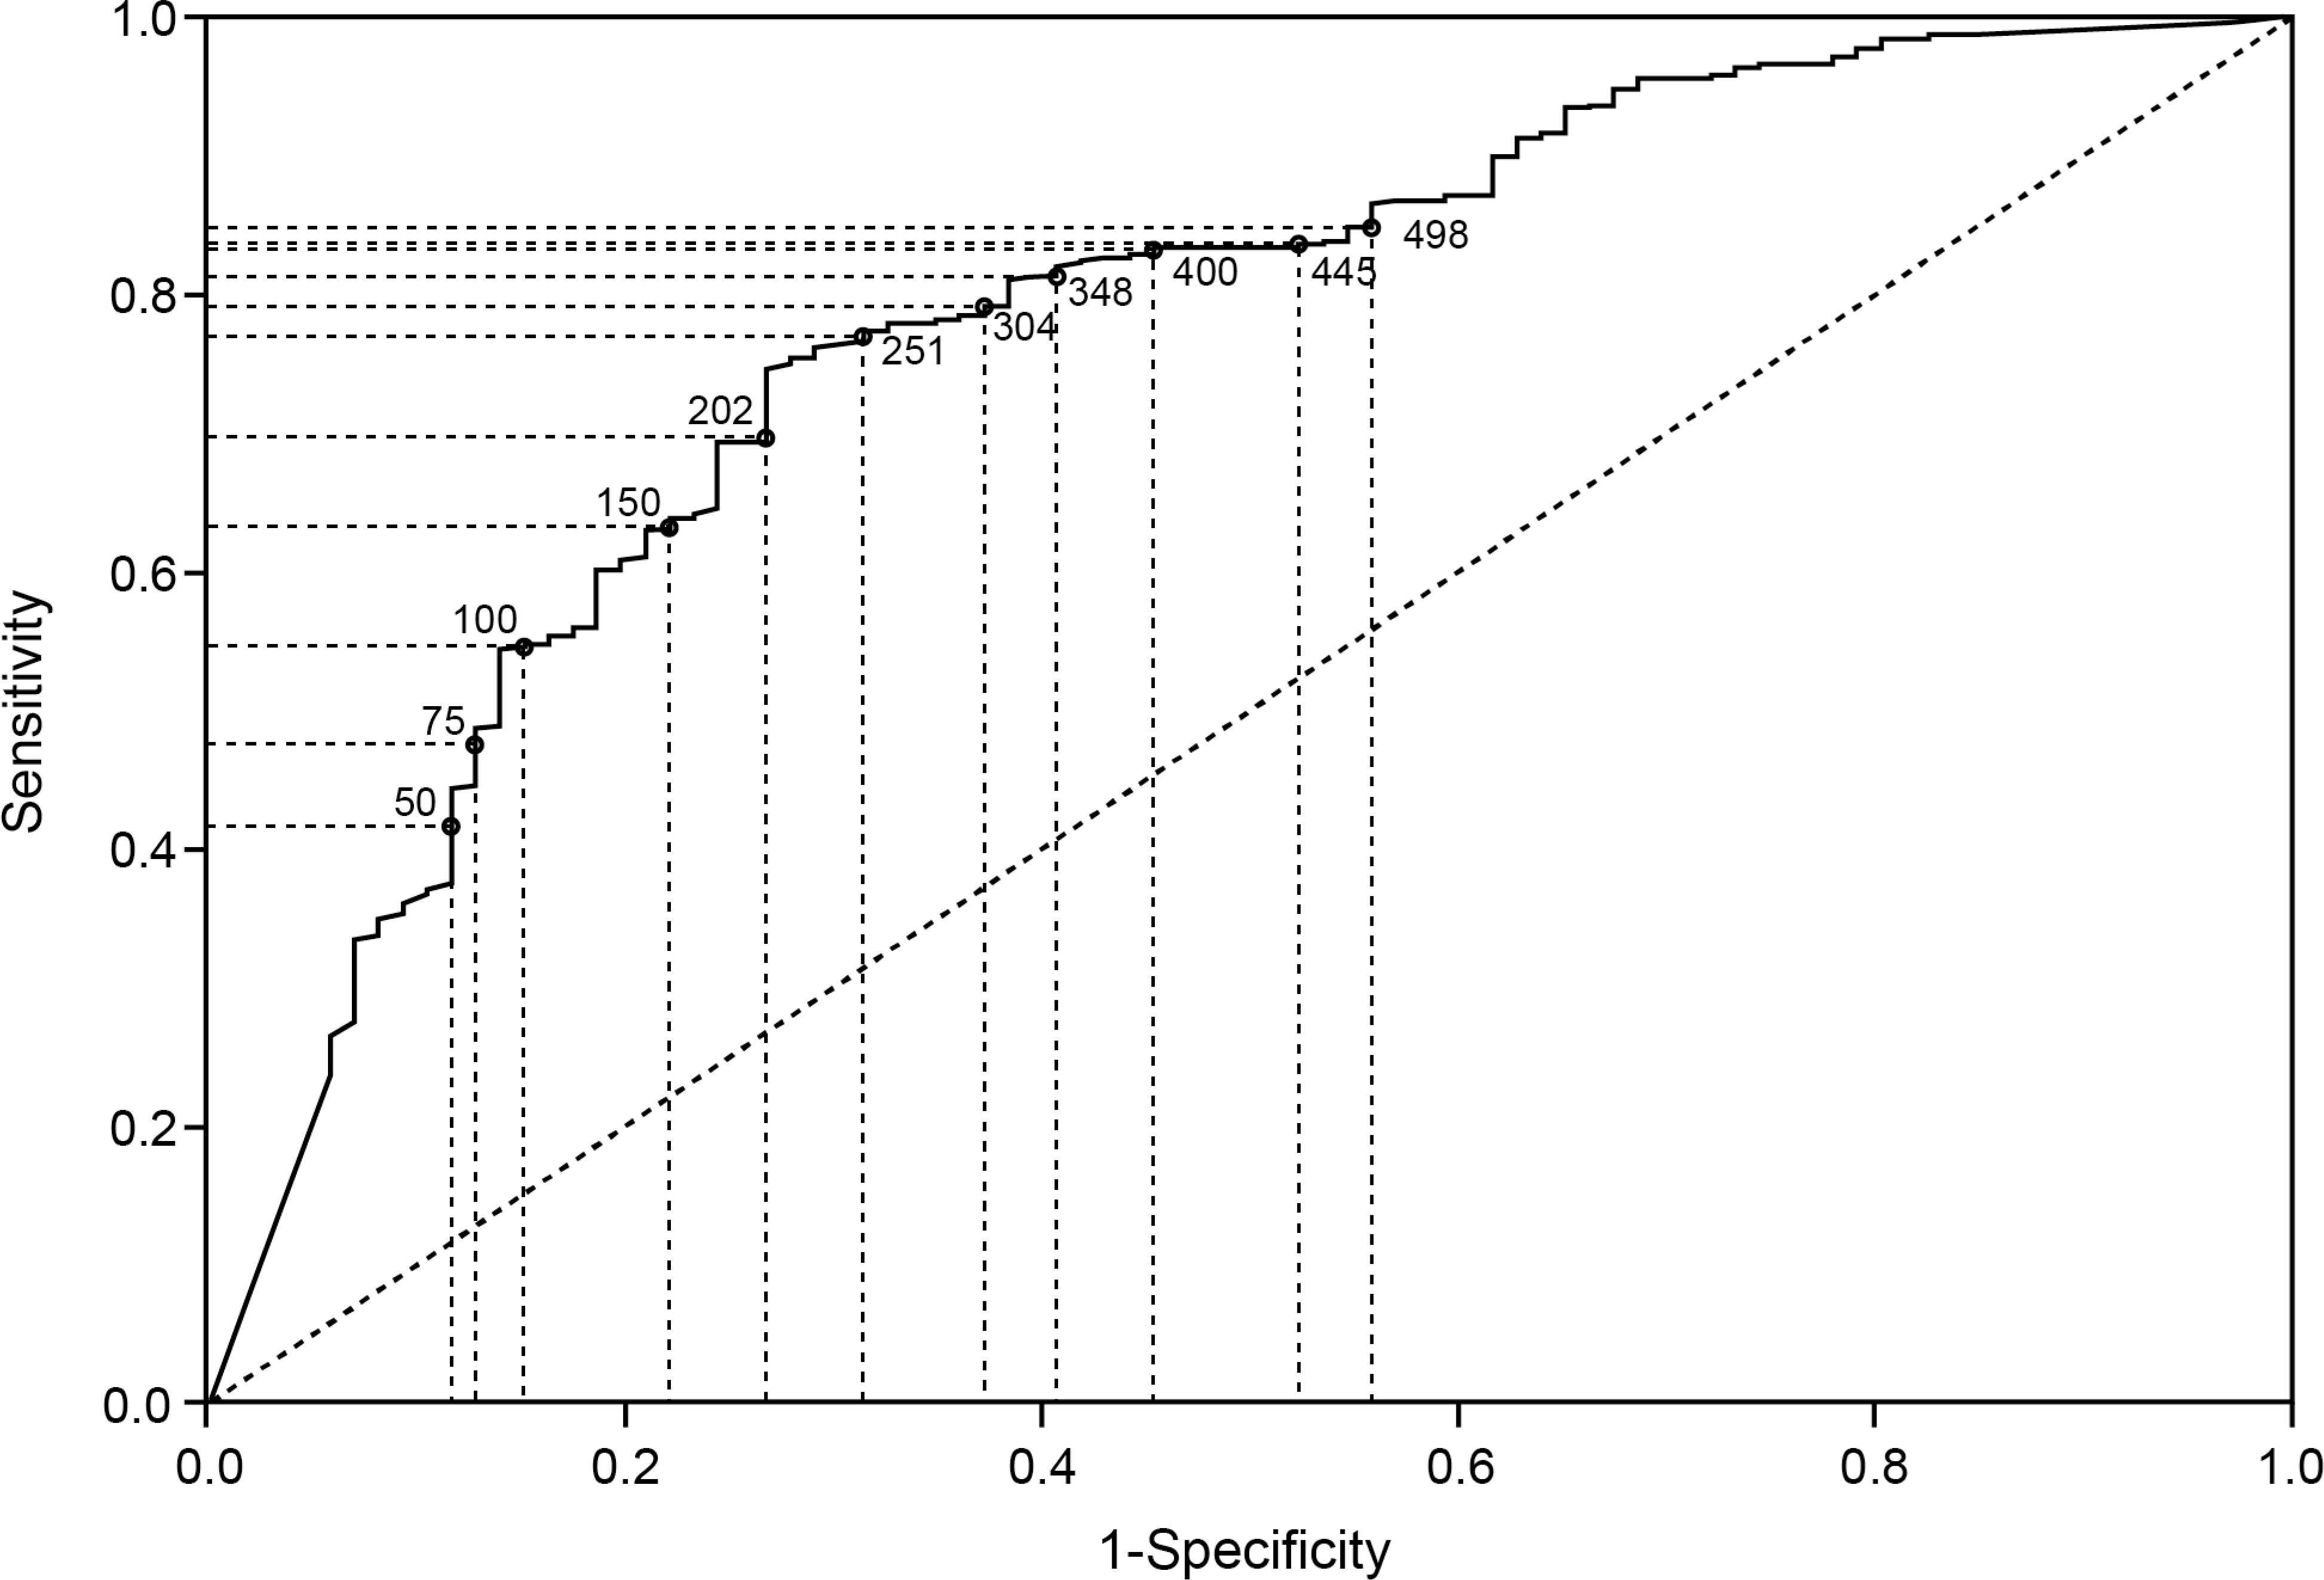
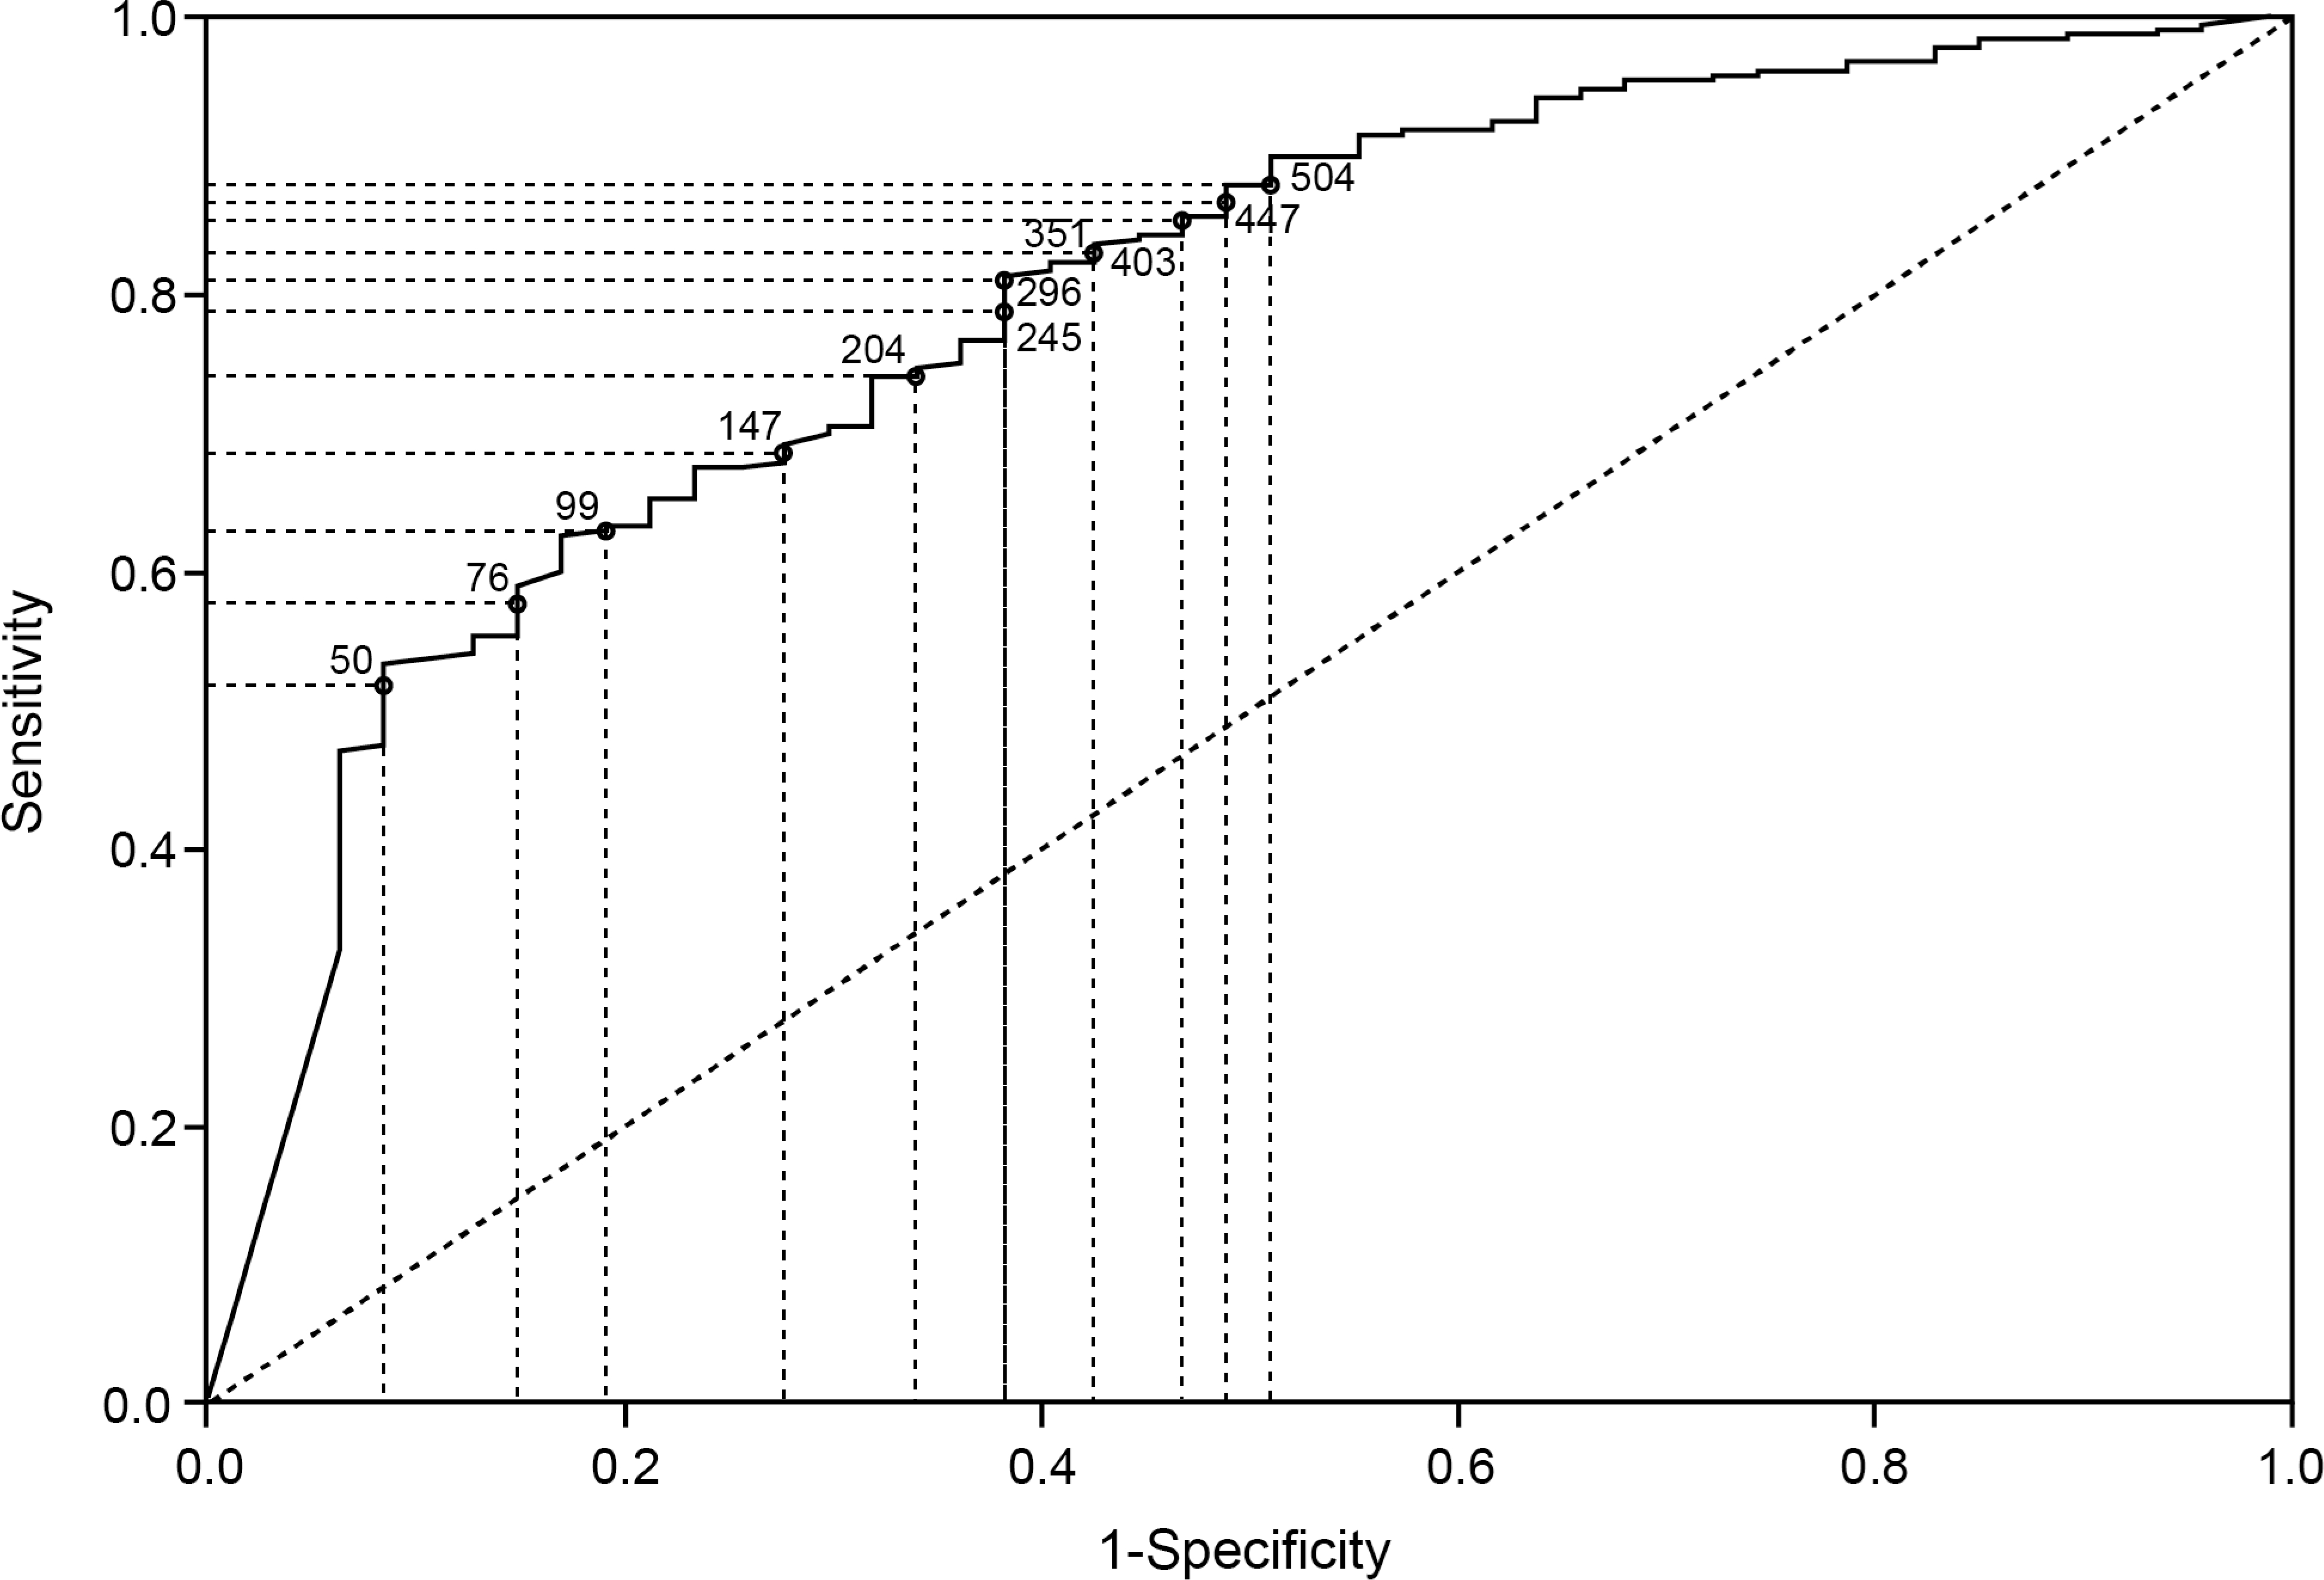
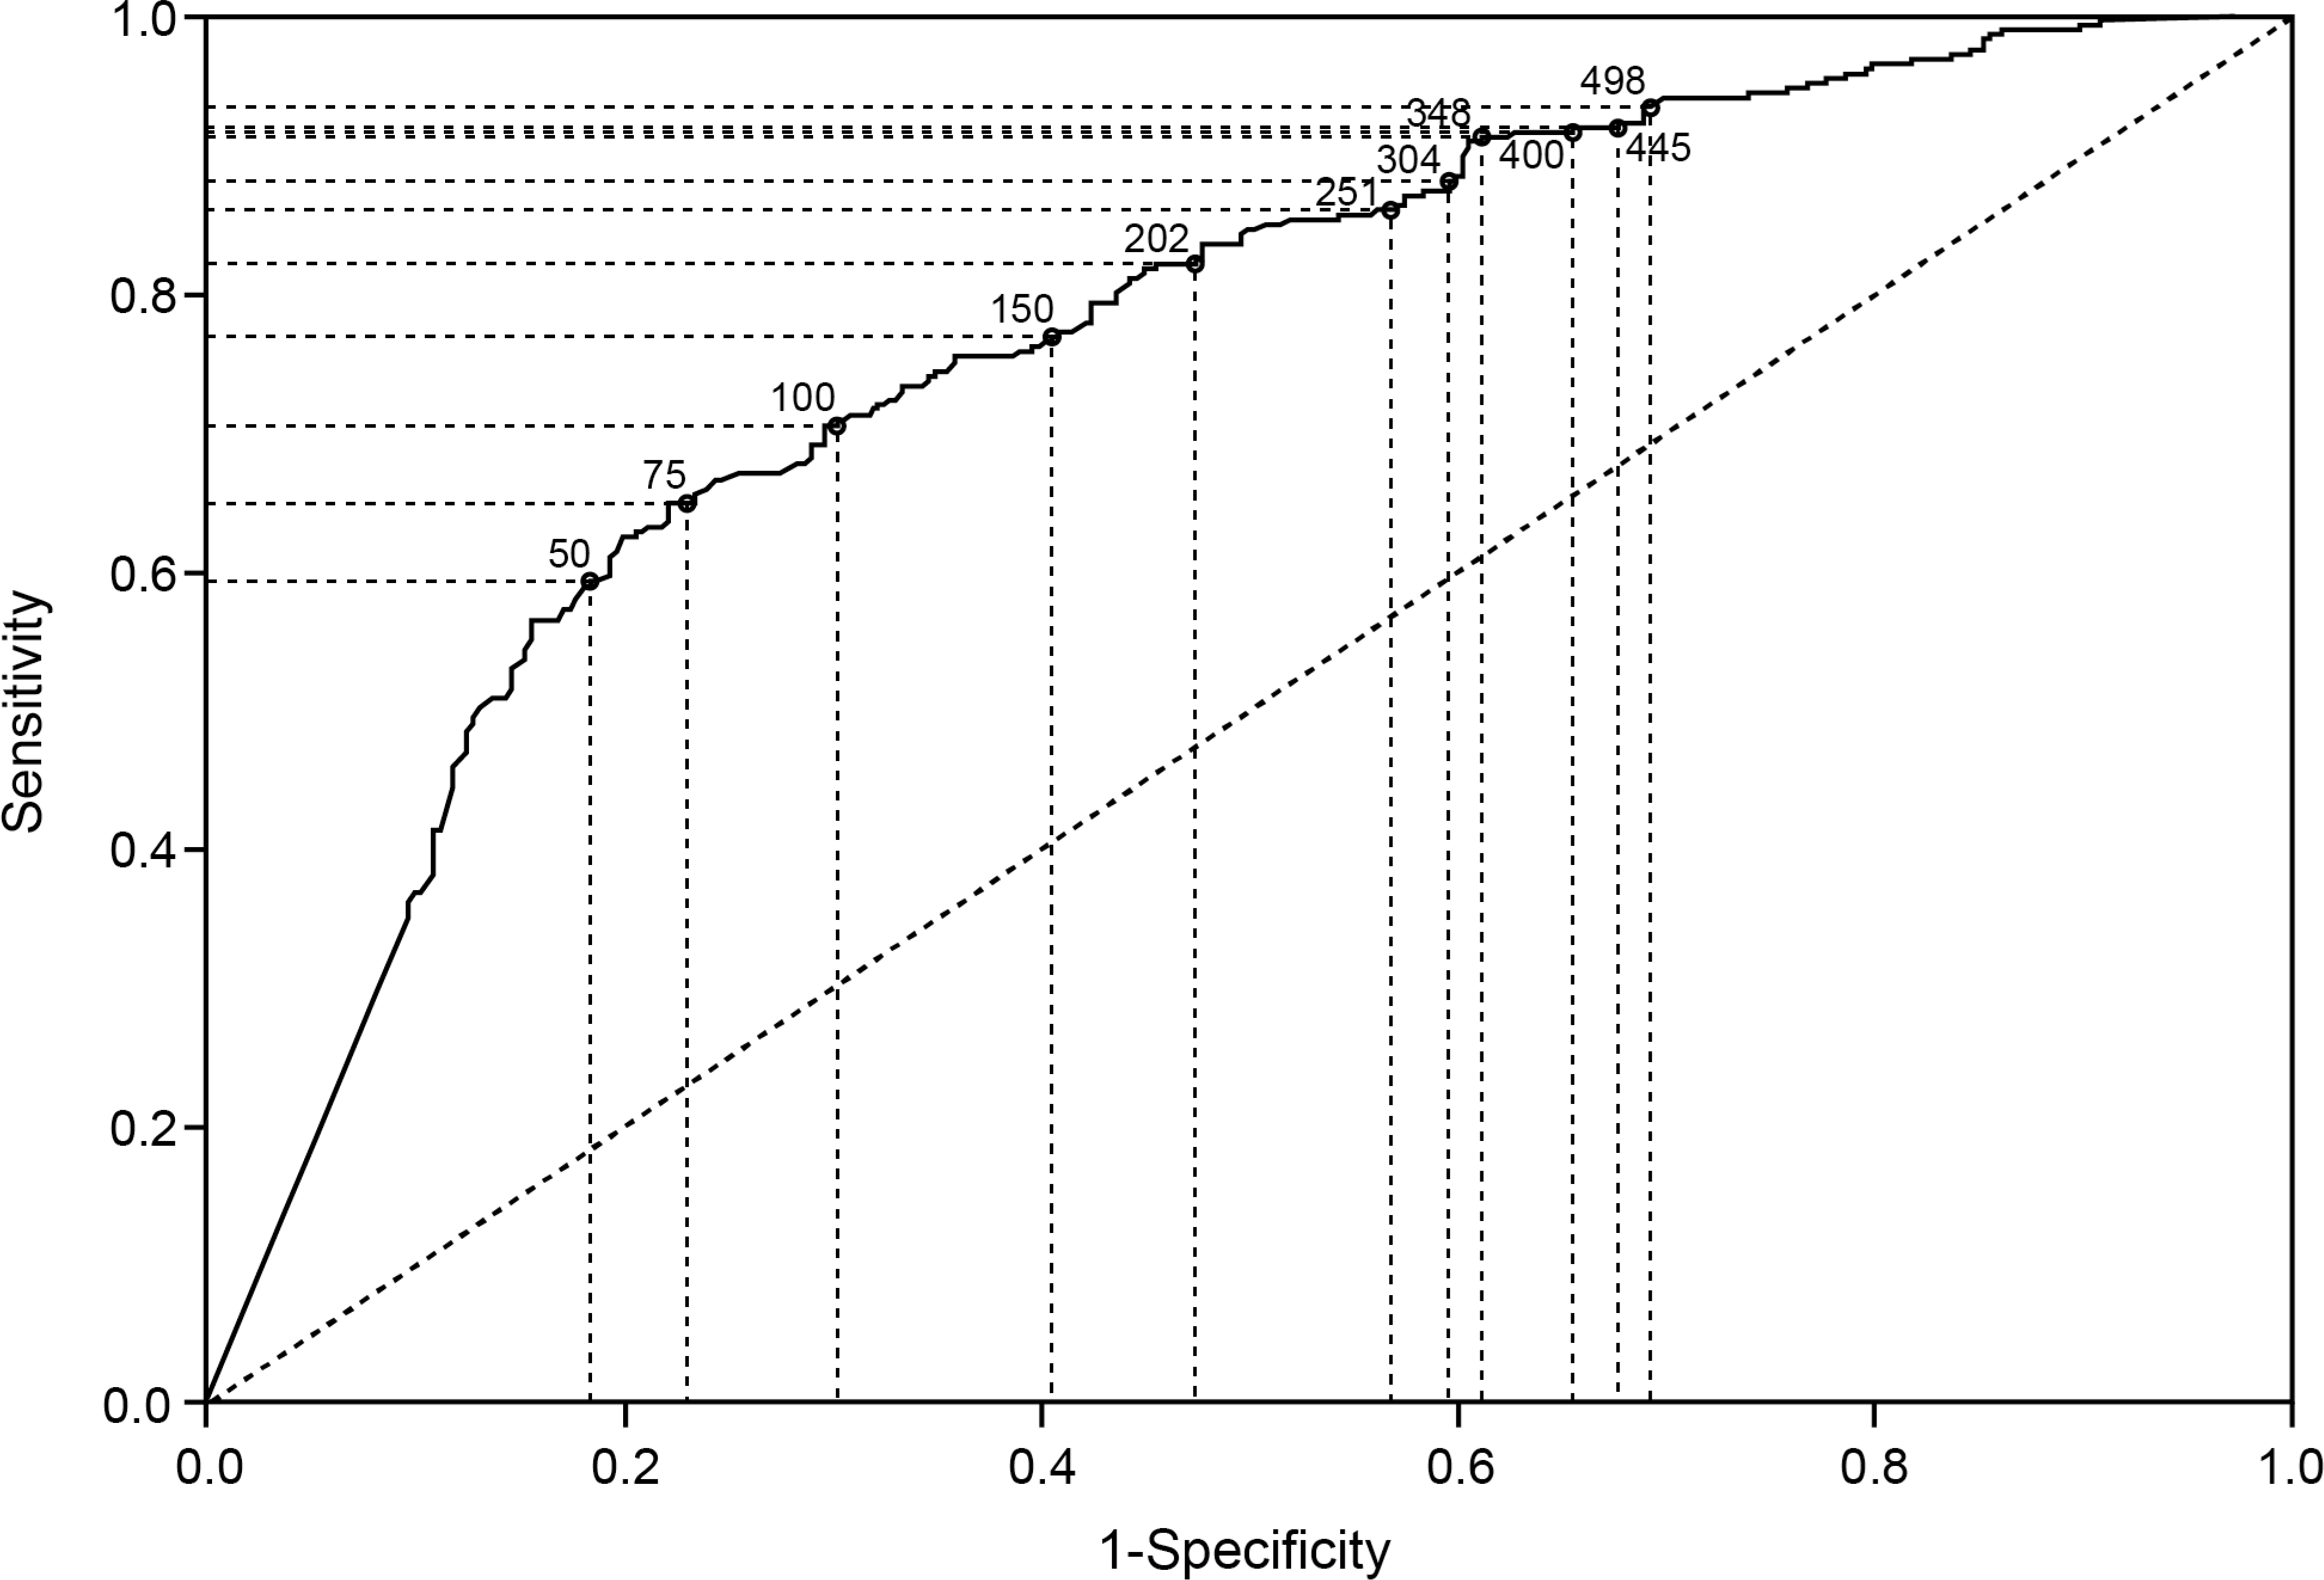
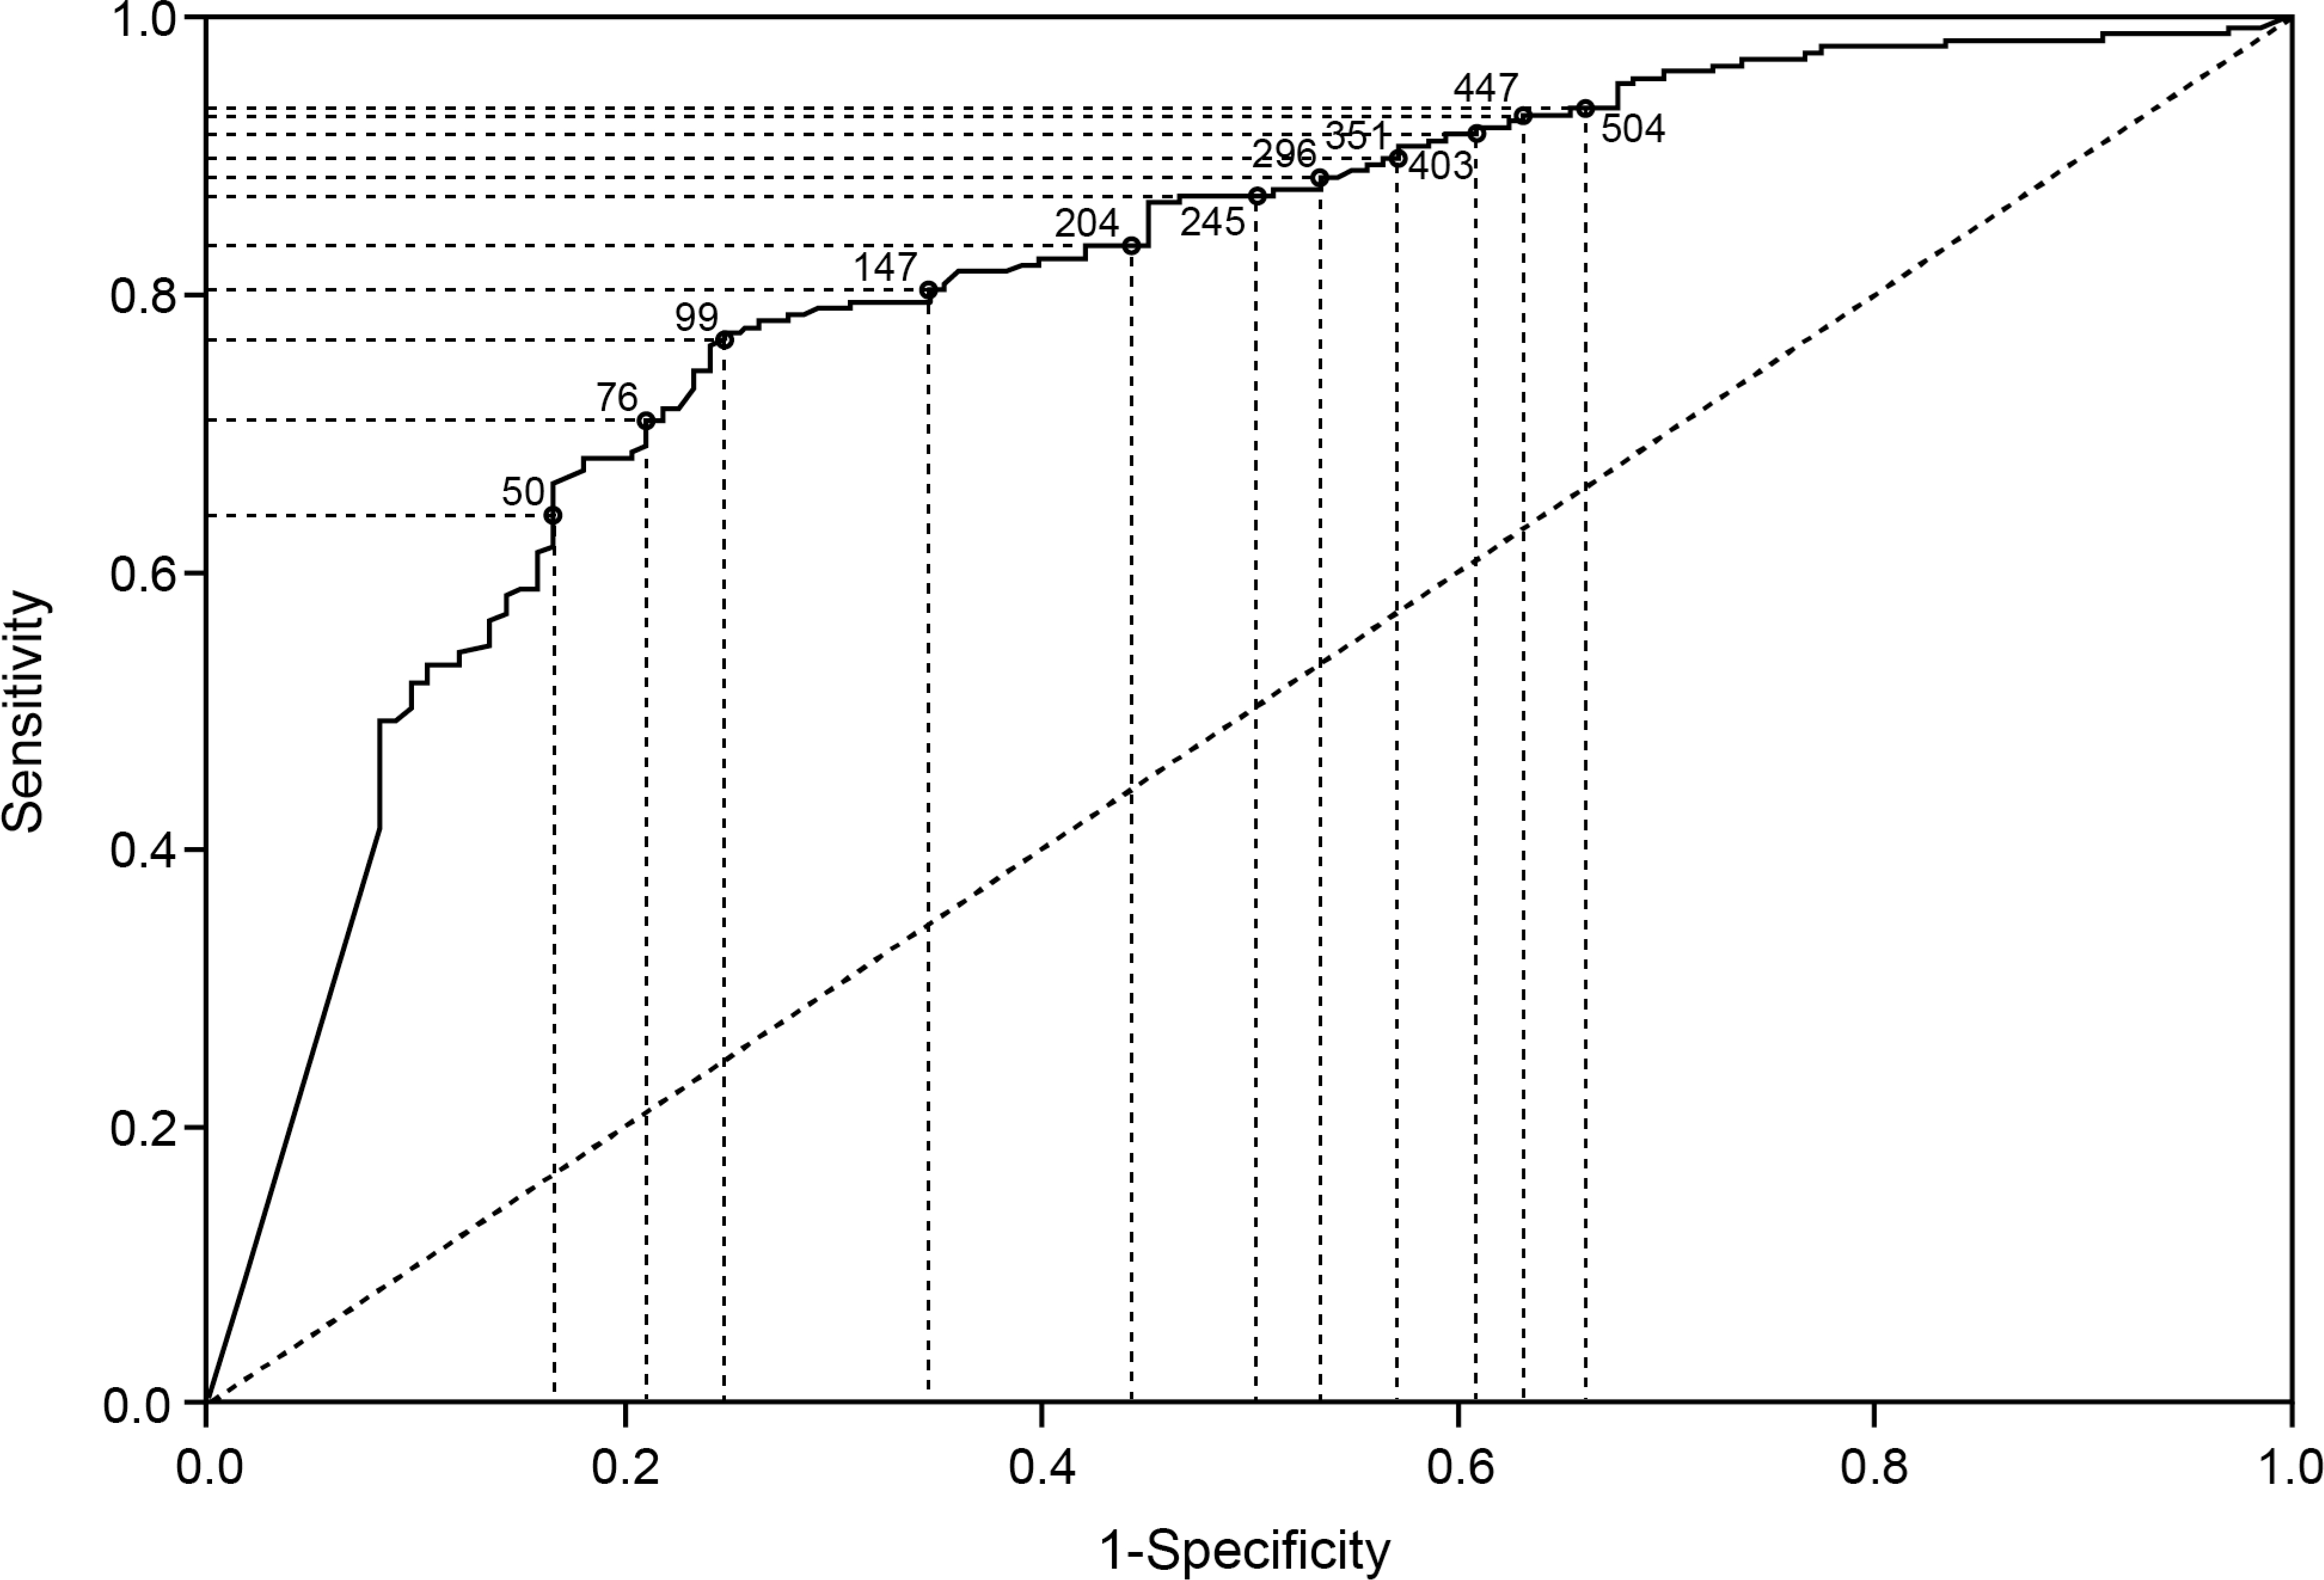
ROC graphs of endoscopic healing by FC at week 8 (A) and week 52 (B) and histological remission by FC at week 8 (C) and week 52 (D).
Correlation between FC and histological disease activity
Data on histological remission were available for 604/639 (94.5%) patients at week 8 and 355/373 (95.2%) patients at week 52. The interobserver agreement between the two independent gastrointestinal pathologists (GDH and JHT) was moderate (Cohen’s weighted kappa coefficient 0.6 [95% CI, 0.33 – 0.87]).25 A moderate positive correlation was observed between FC and the ordinal transformed Geboes score at week 8 (r = 0.510, R2 = 26.0%) and week 52 (r = 0.533, R2 = 28.4%; supplementary figure 3). Median FC values were lower in patients with histological remission than in patients with ongoing histological inflammation at week 8 (median [IQR], 32.0 [16.0 – 127.5] vs 219.5 [81.5 – 618.0] μg/g) and week 52 (24.5 [16.0 – 96.0] vs 244.0 [101.0 – 747.0] μg/g; figure 1).
The accuracy of FC to predict the presence of histological remission was assessed by plotting a ROC curve (figure 3C and D). At week 8, the AUC (95% CI) value was 0.76 (0.72 – 0.80) and the optimal FC cutoff was 75 μg/g (table 1). At week 52, the AUC (95% CI) was 0.80 (0.75 – 0.85). Optimal FC cutoff was 99 μg/g (table 1).
Correlation between FC and histological disease activity in the subpopulation of patients with an endoscopy score of 0
Interestingly, even when the analysis was limited to the subpopulation of patients with complete endoscopic healing, median FC values were lower in patients with histological remission compared to patients with ongoing histological inflammation at week 8 (median [IQR], 30.0 [16.0 – 112.0] vs 140.0 [61.0 – 232.0] μg/g) and week 52 (21.5 [16.0 – 88.0] vs 134.5 [30.0 – 418.0] μg/g). The AUC (95% CI) was 0.72 (0.64 – 0.80) at week 8 and 0.71 (0.60 – 0.82) at week 52 (supplementary figure 3). The optimal cutoff value of FC to predict histological remission (in patients with an endoscopy score of 0) was 73 μg/g at week 8 and 76 μg/g at week 52 (supplementary table 3 and supplementary figure 4).
Multivariable prediction model
Prediction models for both clinical remission and deep remission are presented in supplementary tables 4 and 5.
Prediction model for endoscopic healing at week 8 and 52
During induction, 476/556 patients with available endoscopy data achieved endoscopic healing (86%). During the 12-month follow-up, 304/351 patients with available data during follow up achieved/maintained endoscopic healing (86.6%). The final prediction model for endoscopic healing at week 8 comprised the number of acute episodes in the year prior to enrollment and the baseline stool frequency, endoscopy and histological disease activity scores (table 2). The model for week 52 comprised the endoscopic score at week 8, FC concentration at week 8, and male gender (table 3). The predictors were associated with a lower probability of achieving endoscopic healing (ORs and 95% CIs shown in tables 2 and 3). The ability of the model to discriminate between achieving or failing complete endoscopic healing at week 8 and 52 was assessed by ROC curve (AUC [95% CI], 0.75 [0.69 – 0.81] at week 8 and 0.71 [0.64 – 0.78] at week 52).
Table 2.
Logistic regression analysis of outcomes (endoscopic healing and histological remission) at week 8
| Endoscopic healing at week 8 | Histological healing at week 8 | ||||
|---|---|---|---|---|---|
|
| |||||
| Covariates | OR (95% CI) | P-value | Covariates | OR (95% CI) | P-value |
|
| |||||
| Univariable regression | Univariable regression | ||||
|
| |||||
| Age, years | 0.99 (0.97 – 1.00) | 0.1254 | Age, years | 1.01 (1.00 – 1.02) | 0.2481 |
| Gender, male/female | 0.65 (0.41 – 1.02) | 0.0643 | Gender, male/female | 0.96 (0.70 – 1.32) | 0.8056 |
| Disease extent/locationa | 0.86 (0.52 – 1.45) | 0.5512 | Disease extent/locationa | 0.67 (0.45 – 0.99) | 0.0462 |
| Disease duration at baseline, years | 0.98 (0.37 – 2.87) | 0.9736 | Disease duration at baseline, years | 1.42 (0.69 – 2.92) | 0.3443 |
| Number of acute episodes in preceding year | 0.86 (0.75 – 0.97) | 0.0215 | Number of acute episodes in preceding year | 0.97 (0.87 – 1.08) | 0.6340 |
| Endoscopic score at baseline (0 – 3) | 0.31 (0.20 – 0.49) | <0.001 | Endoscopic score at baseline (0 – 3) | 0.50 (0.36 – 0.68) | <0.001 |
| SF score at baselineb (0 – 3 continuous) | 0.53 (0.40 – 0.71) | <0.001 | SF score at baselineb (0 – 3 continuous) | 0.57 (0.46 – 0.70) | <0.001 |
| RB score at baselineb (0 – 3 continuous) | 0.68 (0.50 – 0.92) | 0.0118 | RB score at baselineb (0 – 3 continuous) | 0.71 (0.57 – 0.89) | 0.0027 |
| Histological activity at baseline (0 – 13) | 0.82 (0.76 – 0.87) | <0.001 | Histological activity at baseline (0 – 13) | 0.80 (0.76 – 0.84) | <0.001 |
| FC at baseline (100 μg/g) | 0.96 (0.94 – 0.99) | 0.0025 | FC at baseline (100 μg/g) | 0.94 (0.92 – 0.96) | <0.001 |
|
| |||||
| Final model | Final model | ||||
|
| |||||
| Number of acute episodes in preceding year | 0.85 (0.74 – 0.96) | 0.0103 | FC at baseline (100 μg/g) | 0.97 (0.95 – 0.99) | 0.0047 |
| Endoscopic score at baseline (0 – 3) | 0.47 (0.27 – 0.79) | 0.0052 | SF score at baseline (0 – 3 continuous) | 0.68 (0.54 – 0.86) | 0.0011 |
| SF score at baseline (0 – 3 continuous) | 0.63 (0.45 – 0.87) | 0.0062 | Histological activity at baseline (0 – 13) | 0.83 (0.79 – 0.87) | <0.001 |
| Histological activity at baseline (0 – 13) | 0.86 (0.79 – 0.92) | <0.001 | |||
CI, confidence interval; FC, fecal calprotectin; OR, odds ratio; RB, rectal bleeding; SF, stool frequency; W, week; Δ, delta (change).
involvement of the transverse colon or pancolitis vs left sided colitis
average of the last 3 days’ scores.
P-value derived from likelihood ratio test.
Table 3.
Logistic regression analysis of outcomes (endoscopic healing and histological remission) at week 52
| Endoscopic healing at week 52 | Histological healing at week 52 | ||||
|---|---|---|---|---|---|
|
| |||||
| Covariates | OR (95% CI) | P-value | Covariates | OR (95% CI) | P-value |
|
| |||||
| Univariable regression | Univariable regression | ||||
|
| |||||
| Age, years | 0.99 [0.97 – 1.02) | 0.551 | Age, years | 1.01 [0.99 – 1.02] | 0.511 |
| Gender, male/female | 0.43 [0.22 – 0.81] | 0.012 | Gender, male/female | 0.75 [0.49 – 1.14] | 0.176 |
| Disease extent/locationa | 0.62 [0.33 – 1.24] | 0.162 | Disease extent/locationa | 1.22 [0.74 – 2.07] | 0.445 |
| Disease duration at baseline, years | 1.01 [0.28 – 4.25] | 0.991 | Disease duration at baseline, years | 0.85 [0.32 – 2.25] | 0.732 |
| Number of acute episodes in preceding year | 0.84 [0.65 – 0.99] | 0.103 | Number of acute episodes in preceding year | 1.00 [0.86 – 1.18] | 0.991 |
| Endoscopic score at baseline (0 – 3) | 0.58 [0.33 – 1.00] | 0.053 | Endoscopic score at baseline (0 – 3) | 0.56 [0.37 – 0.83] | 0.004 |
| Endoscopic score at W8 (0 – 3) | 0.31 [0.16 – 0.58] | <0.001 | Endoscopic score at W8 (0 – 3) | 0.36 [0.23 – 0.55] | <0.001 |
| SF score at baselineb (0 – 3 continuous) | 0.82 [0.55 – 1.22] | 0.321 | SF score at baselineb (0 – 3 continuous) | 0.77 [0.58 – 1.03] | 0.083 |
| RB score at baselineb (0 – 3 continuous) | 1.09 [0.71 – 1.71] | 0.685 | RB score at baselineb (0 – 3 continuous) | 0.90 [0.67 – 1.23] | 0.519 |
| SF score at W8b (0 – 3 continuous) | 0.68 [0.33 – 1.46] | 0.302 | SF score at W8b (0 – 3 continuous) | 0.67 [0.39 – 1.16] | 0.152 |
| RB score at W8b (0 – 3 continuous) | 19.79 [0.71 – 71524.8] | 0.244 | RB score at W8b (0 – 3 continuous) | 0.76 [0.19 – 3.25] | 0.697 |
| Histological activity at baseline (0 – 13) | 0.89 [0.82 – 0.97] | 0.005 | Histological activity at baseline (0 – 13) | 0.88 [0.83 – 0.93] | <0.001 |
| Histological activity at W8 (0 – 13) | 0.87 [0.79 – 0.95] | 0.003 | Histological activity at W8 (0 – 13) | 0.80 [0.74 – 0.86] | <0.001 |
| FC at baseline (100 μg/g) | 0.96 [0.93 – 1.00] | 0.034 | FC at baseline (100 μg/g) | 0.99 [0.96 – 1.01] | 0.363 |
| FC at W8 (100 μg/g) | 0.89 [0.84 – 0.94] | <0.001 | FC at W8 (100 μg/g) | 0.87 [0.81 – 0.93] | <0.001 |
| Δ FC between baseline and W8 (100 μg/g) | 0.99 [0.95 – 1.03] | 0.718 | Δ FC between baseline and W8 (100 μg/g) | 0.98 [0.95 – 1.01] | 0.128 |
|
| |||||
| Final model | Final model | ||||
|
| |||||
| Endoscopic score at W8 (0 – 3) | 0.40 [0.20 – 0.75] | Endoscopic score at W8 (0 – 3) | 0.52 [0.32 – 0.82] | ||
| FC at W8 (100 μg/g) | 0.91 [0.85 – 0.96] | FC at W8 (100 μg/g) | 0.91 [0.85 – 0.97] | ||
| Gender, male/female | 0.53 [0.26 – 1.04] | Histological activity at baseline (0 – 13) | 0.92 [0.86 – 0.98] | ||
| Histological activity at W8 (0 – 13) | 0.89 [0.81 – 0.97] | ||||
CI, confidence interval; FC, fecal calprotectin; OR, odds ratio; RB, rectal bleeding; SF, stool frequency; W, week; Δ, delta (change).
involvement of the transverse colon or pancolitis vs left sided colitis
average of the last 3 days’ scores.
P-value derived from likelihood ratio test.
Prediction model for histological remission at week 8 and 52
During induction, 283/615 patients with available histology data achieved histological remission at week 8 (46%). During subsequent follow up, 228/355 (64.2%) patients with available data achieved histological remission at week 52, of which 222 had non-missing FC data at week 52. The final prediction model for histologic remission at week 8 comprised FC concentration, stool frequency score, and histological disease activity at baseline (table 2). The model for week 52 comprised the endoscopic severity at week 8, FC at week 8, and histological disease activity at both baseline and at week 8. All predictors were associated with a lower probability of achieving histological remission (table 2 and 3). The ability of the model to predict histological remission at week 8 and 52 was assessed by ROC curve (AUC [95% CI], 0.75 [0.71 – 0.78] at week 8 and 0.72 [0.67 – 0.78] at week 52).
DISCUSSION
In this post hoc analysis of a phase 3b/4, 58-week clinical trial in patients with UC receiving multimatrix mesalamine, median FC values were lower in patients who achieved clinical remission, endoscopic healing, deep remission, and histological remission than in patients who did not meet these endpoints. The AUC varied according to therapeutic target and time point. There was poor diagnostic accuracy of FC for prediction of clinical remission and deep remission at both week 8 and week 52. Interestingly, when clinical remission was defined as the absence of rectal bleeding alone (disregarding the severity of diarrhea), the accuracy of FC increased markedly (data not shown). It appears that in terms of clinical symptoms, rectal bleeding is the key driver of FC elevation. This is not surprising as the sensitivity to predict quiescent endoscopic disease is higher for the absence of rectal bleeding than a normalization of the stool frequency.26 As expected, performance of FC for prediction of endoscopic and histological disease activity was better. This corroborates the moderate correlation between symptoms and severity of mucosal inflammation, which has been reported consistently.27, 28 With an AUC of 0.77 at week 8 and 0.79 at week 52, FC had fair diagnostic accuracy for predicting endoscopic healing. Optimal cutoffs varied according to the chosen time point; 251 μg/g at week 8 and 99 μg/g at week 52. Remarkably, the sensitivity for endoscopic healing remained low with concordant low NPV (i.e., that an FC value above the determined cutoff indeed meant there was no endoscopic healing). A considerable proportion of patients with an elevated FC value above the optimal cutoff had endoscopically quiescent disease. Previous studies have shown the inability of endoscopy to visualize residual histological inflammation in UC18, 29, 30. Hence, a possible explanation would be the presence of residual inflammation at a microscopic (histological) level. Indeed, in the subpopulation of patients with complete endoscopic healing (modified Mayo endoscopy subscore 0), FC remained higher in patients with ongoing histological inflammation compared to patients in histological remission and with AUC values of 0.76 and 0.80 at week 8 and 52, respectively, FC had fair to good diagnostic accuracy for the detection of histological inflammation. When limited to the population of patients with an endoscopy score of 0, the accuracy of FC to predict ongoing histological inflammation remained fair (week 8: AUC 0.72; week 52: AUC 0.71). Despite limited large prospective data, there is growing evidence to support the benefit of achieving histological remission in addition to endoscopic healing.2–8 In a recent observational study of 377 UC patients by Magro et al, the Geboes Score, Nancy Index and Robarts Histopathology Index could accurately predict FC levels.19 Overall, the evidence from the available literature and the present study suggest that FC correlates well with histological disease activity and that the optimal cutoff lies between 75 – 150 μg/g.15–17, 19
Even though the clinical utility of FC as a surrogate marker of inflammation is generally accepted, some limitations should be acknowledged. The number of proposed cutoff values in literature is considerable.31 This is in part explained by different FC measurement tools with distinct underlying mechanisms. A recent cross-sectional study in 371 patients with UC showed considerable differences in mean and median FC values according to which FC quantification tool (Quantum Blue vs EliA) was used.18 Another limitation and potential explanation for the wide range in reported cutoff values is the large inter- and intra-individual variability in FC values.10
In the majority of patients with UC, aminosalicylates are recommended as first-line treatment.20 With an increasing focus on identifying the right drug for the right patient, ideally, patients who are most likely to benefit from aminosalicylates would be identified prior to or early in treatment.20 The present study aimed to identify predictors associated with therapeutic outcomes at both week 8 (initial remission) and week 52 (maintained remission). The stool frequency score and histological disease activity at baseline were inversely associated with the likelihood of achieving both endoscopic healing and histological remission after induction treatment. Interestingly, baseline FC concentration was inversely associated with achieving histological remission but not with endoscopic healing at week 8. This could perhaps, in part, be explained by the low number of patients that did not achieve endoscopic healing at week 8. There was a strong inverse association between the week 8 stool frequency score and week 52 therapeutic outcomes that involved clinical assessment (clinical remission and deep remission). Endoscopic severity at week 8 was consistently inversely associated with week 52 therapeutic outcomes (endoscopic healing, deep remission, and histological remission), and histological disease activity both at baseline and week 8 were independently associated with achieving histological remission at week 52. A few limitations to the present study should be acknowledged. The results do not necessarily apply to patients with severe or long-standing UC as this population has not been studied. Endoscopic disease activity assessment was performed by local investigators without the use of central reading. In each center, FC measurements were performed using in-house assays. Even though different assays show comparable performance, there still might be considerable quantitative differences that could influence optimal cut-off determination.32 Furthermore, although this was a multicenter clinical trial with a large sample size, these analyses were completed post hoc with limitations in its study design. The aim of the present analyses was not to develop a prediction algorithm suited for predictions on individual patient level and no formal methods for model validation have been applied. Finally, the Geboes score was transformed to an ordinal score. For the analyses of the correlation between FC and histological disease activity, only parameters 2b to 5 of the Geboes score were evaluated. As parameters 0 to 2A reflect chronic changes rather than active inflammation, chronic inflammatory infiltrates and lamina propria eosinophils were disregarded.
In conclusion, in mild-to-moderate UC, even in the presence of complete endoscopic healing, FC can aid in discriminating between patients with ongoing microscopic inflammation and patients in histological remission. The optimal FC cutoff to predict histological remission varied between 75 and 100 μg/g. If histological remission is adopted as a therapeutic target in UC, FC target values should be considered within this window rather than the commonly accepted 150 – 250 μg/g.10, 12 Furthermore, endoscopic disease activity after the induction phase of mesalamine treatment was the only independent predictor associated with several important therapeutic outcomes (endoscopic healing, deep remission, and histological remission) at week 52. We developed a prediction model for short-term (week 8) and long-term (week 52) histological remission in patients with mild-to-moderate UC treated with multimatrix mesalamine. These models comprised the baseline FC, stool frequency, and histological disease activity score for short-term response and the endoscopic score at week 8, FC concentration at week 8, and histological disease activity at both baseline and week 8 for long-term response. These findings have considerable importance for evolving treatment endpoints.
Supplementary Material
Need to Know.
Background:
Histologic features of inflammation are associated with clinical relapse in patients with ulcerative colitis (UC). Concentration of fecal calprotectin (FC) can be used to identify patients with mucosal inflammation.
Findings:
A post-hoc analysis of data from a phase 4 clinical trial found that even in patients with UC with complete endoscopic healing, FC concentration can be used to discriminate patients with ongoing microscopic inflammation from patients with histologic features of remission (histologic remission).
Implications for patient care:
The optimal cutoff concentration of FC is between 75 and 100 μg/g for identification of patients with UC who are in histologic remission.
Acknowledgements:
We thank Y. Xie for assistance with statistical analyses.
Grant support: not applicable. All aspects of this study were funded by Shire, Inc.
Conflict of interest statement: TS declares no conflicts of interest. GRD has served as advisor for Abbvie, Ablynx, Allergan, Amakem, Amgen, AM Pharma, Arena Pharmaceuticals, AstraZeneca, Avaxia, Biogen, Bristol Myers Squibb, Boerhinger Ingelheim, Celgene/Receptos, Celltrion, Cosmo, Covidien/Medtronics, Ferring, DrFALK Pharma, Eli Lilly, Engene, Galapagos, Genentech/Roche, Gilead, GlaxoSmithKline, Hospira/Pfizer, Immunic, Johnson & Johnson, Lycera, Medimetrics, Millenium/Takeda, Mitsubishi Pharma, Merck Sharp & Dome, Mundipharma, Nextbiotics, Novonordisk, Otsuka, Pfizer/Hospira, Photopill, Prometheus laboratories/Nestle, Progenity, Protagonist, Robarts Clinical Trials, Salix, Samsung Bioepis, Sandoz, Seres/Nestle, Setpoint, Shire, Teva, Tigenix, Tillotts, Topivert, Versant, and Vifor and received speaker fees from Abbvie, Biogen, Ferring, Johnson & Johnson, Merck Sharp & Dome, Mundipharma, Norgine, Pfizer, Samsung Bioepis, Shire, Millenium/Takeda, Tillotts, and Vifor. KG has served as speaker and/or advisor for Amgen, AbbVie, Boehringer Ingelheim, Ferring, Hospira, MSD, Pfizer, Samsung Bioepis, Sandoz, Takeda, and Tigenix. GdH’s institutions (KULeuven, UZLeuven) receive fees for his activities as central pathology reviewer for Centocor and Takeda. DTR has consulted for Abbvie, Abgenomics, Allergan Inc., Amgen, Celgene Corporation, Forward Pharma, Genentech/Roche, Janssen Pharmaceuticals, Merck & Co Inc., Miraca Life Sciences, Napo Pharmaceuticals, Pfizer, Salix Pharmaceuticals, Samsung Bioepis, Sandoz Pharmaceuticals, Shire, Takeda, and Target PharmaSolutions and received grant support from Abbvie, Genentech/Roche, Janssen Pharmaceuticals, Prometheus Laboratories, Shire, Takeda, and UCB Pharma.
Writing assistance: For the methods section, medical writing support under guidance of the authors was provided by Wilson Joe of MedErgy and was funded by Shire, Inc, a Takeda company.
Abbreviations:
- AUC
area under the curve
- CI
confidence Interval
- FC
fecal calprotectin
- HR
histological remission
- IQR
interquartile range
- NPV
negative predictive value
- OR
odds ratio
- PPV
positive predictive value
- ROC
receiver operating characteristic
- UC
ulcerative colitis
- UCDAI
Ulcerative Colitis Disease Activity Index
REFERENCES
- 1.Peyrin-Biroulet L, Sandborn W, Sands BE, et al. Selecting Therapeutic Targets in Inflammatory Bowel Disease (STRIDE): Determining Therapeutic Goals for Treat-to-Target. Am J Gastroenterol 2015;110:1324–1338. [DOI] [PubMed] [Google Scholar]
- 2.Ponte A, Pinho R, Fernandes S, et al. Impact of Histological and Endoscopic Remissions on Clinical Recurrence and Recurrence-free Time in Ulcerative Colitis. Inflamm Bowel Dis 2017;23:2238–2244. [DOI] [PubMed] [Google Scholar]
- 3.Frieri G, Galletti B, Di Ruscio M, et al. The prognostic value of histology in ulcerative colitis in clinical remission with mesalazine. Therap Adv Gastroenterol 2017;10:749–759. [DOI] [PMC free article] [PubMed] [Google Scholar]
- 4.Zenlea T, Yee EU, Rosenberg L, et al. Histology Grade Is Independently Associated With Relapse Risk in Patients With Ulcerative Colitis in Clinical Remission: A Prospective Study. Am J Gastroenterol 2016;111:685–690. [DOI] [PubMed] [Google Scholar]
- 5.Park S, Abdi T, Gentry M, et al. Histological Disease Activity as a Predictor of Clinical Relapse Among Patients With Ulcerative Colitis: Systematic Review and Meta-Analysis. Am J Gastroenterol 2016;111:1692–1701. [DOI] [PubMed] [Google Scholar]
- 6.Bryant RV, Winer S, Travis SP, et al. Systematic review: histological remission in inflammatory bowel disease. Is ‘complete’ remission the new treatment paradigm? An IOIBD initiative. J Crohns Colitis 2014;8:1582–1597. [DOI] [PubMed] [Google Scholar]
- 7.Gordon IO, Agrawal N, Willis E, et al. Fibrosis in ulcerative colitis is directly linked to severity and chronicity of mucosal inflammation. Aliment Pharmacol Ther 2018;47:922–939. [DOI] [PMC free article] [PubMed] [Google Scholar]
- 8.Lobaton T, Bessissow T, Ruiz-Cerulla A, et al. Prognostic value of histological activity in patients with ulcerative colitis in deep remission: A prospective multicenter study. United European Gastroenterol J 2018;6:765–772. [DOI] [PMC free article] [PubMed] [Google Scholar]
- 9.Romkens TEH, Kranenburg P, Tilburg AV, et al. Assessment of Histological Remission in Ulcerative Colitis: Discrepancies Between Daily Practice and Expert Opinion. J Crohns Colitis 2018;12:425–431. [DOI] [PubMed] [Google Scholar]
- 10.Sandborn WJ, Panes J, Zhang H, et al. Correlation Between Concentrations of Fecal Calprotectin and Outcomes of Patients With Ulcerative Colitis in a Phase 2 Trial. Gastroenterology 2016;150:96–102. [DOI] [PubMed] [Google Scholar]
- 11.Schoepfer AM, Beglinger C, Straumann A, et al. Fecal calprotectin more accurately reflects endoscopic activity of ulcerative colitis than the Lichtiger Index, C-reactive protein, platelets, hemoglobin, and blood leukocytes. Inflamm Bowel Dis 2013;19:332–341. [DOI] [PubMed] [Google Scholar]
- 12.D’Haens G, Ferrante M, Vermeire S, et al. Fecal calprotectin is a surrogate marker for endoscopic lesions in inflammatory bowel disease. Inflamm Bowel Dis 2012;18:2218–2224. [DOI] [PubMed] [Google Scholar]
- 13.De Vos M, Dewit O, D’Haens G, et al. Fast and sharp decrease in calprotectin predicts remission by infliximab in anti-TNF naive patients with ulcerative colitis. J Crohns Colitis 2012;6:557–562. [DOI] [PubMed] [Google Scholar]
- 14.Schoepfer AM, Beglinger C, Straumann A, et al. Ulcerative colitis: correlation of the Rachmilewitz endoscopic activity index with fecal calprotectin, clinical activity, C-reactive protein, and blood leukocytes. Inflamm Bowel Dis 2009;15:1851–1858. [DOI] [PubMed] [Google Scholar]
- 15.Patel A, Panchal H, Dubinsky MC. Fecal Calprotectin Levels Predict Histological Healing in Ulcerative Colitis. Inflamm Bowel Dis 2017;23:1600–1604. [DOI] [PubMed] [Google Scholar]
- 16.Zittan E, Kelly OB, Kirsch R, et al. Low Fecal Calprotectin Correlates with Histological Remission and Mucosal Healing in Ulcerative Colitis and Colonic Crohn’s Disease. Inflamm Bowel Dis 2016;22:623–630. [DOI] [PubMed] [Google Scholar]
- 17.Theede K, Holck S, Ibsen P, et al. Fecal Calprotectin Predicts Relapse and Histological Mucosal Healing in Ulcerative Colitis. Inflamm Bowel Dis 2016;22:1042–1048. [DOI] [PubMed] [Google Scholar]
- 18.Magro F, Lopes S, Coelho R, et al. Accuracy of Faecal Calprotectin and Neutrophil Gelatinase B-associated Lipocalin in Evaluating Subclinical Inflammation in UlceRaTIVE Colitis-the ACERTIVE study. J Crohns Colitis 2017;11:435–444. [DOI] [PubMed] [Google Scholar]
- 19.Magro F, Lopes J, Borralho P, et al. Comparison of different histological indexes in the assessment of UC activity and their accuracy regarding endoscopic outcomes and faecal calprotectin levels. Gut 2019;68:594–603. [DOI] [PubMed] [Google Scholar]
- 20.Harbord M, Eliakim R, Bettenworth D, et al. Third European Evidence-based Consensus on Diagnosis and Management of Ulcerative Colitis. Part 2: Current Management. J Crohns Colitis 2017;11:769–784. [DOI] [PubMed] [Google Scholar]
- 21.Rubin DT, Bradette M, Gabalec L, et al. Ulcerative Colitis Remission Status After Induction With Mesalazine Predicts Maintenance Outcomes: the MOMENTUM Trial. J Crohns Colitis 2016;10:925–933. [DOI] [PMC free article] [PubMed] [Google Scholar]
- 22.Bossuyt PM, Reitsma JB, Bruns DE, et al. Towards complete and accurate reporting of studies of diagnostic accuracy: The STARD Initiative. Ann Intern Med 2003;138:40–44. [DOI] [PubMed] [Google Scholar]
- 23.Collins GS, Reitsma JB, Altman DG, et al. Transparent Reporting of a multivariable prediction model for Individual Prognosis or Diagnosis (TRIPOD): the TRIPOD statement. Ann Intern Med 2015;162:55–63. [DOI] [PubMed] [Google Scholar]
- 24.Geboes K, Riddell R, Ost A, et al. A reproducible grading scale for histological assessment of inflammation in ulcerative colitis. Gut 2000;47:404–409. [DOI] [PMC free article] [PubMed] [Google Scholar]
- 25.Landis JR, Koch GG. The measurement of observer agreement for categorical data. Biometrics 1977;33:159–174. [PubMed] [Google Scholar]
- 26.Restellini S, Chao CY, Martel M, et al. Clinical Parameters Correlate With Endoscopic Activity of Ulcerative Colitis: A Systematic Review. Clin Gastroenterol Hepatol 2019;17:1265–1275 e8. [DOI] [PubMed] [Google Scholar]
- 27.Peyrin-Biroulet L, Reinisch W, Colombel JF, et al. Clinical disease activity, C-reactive protein normalisation and mucosal healing in Crohn’s disease in the SONIC trial. Gut 2014;63:88–95. [DOI] [PubMed] [Google Scholar]
- 28.Rutgeerts P, Sandborn WJ, Feagan BG, et al. Infliximab for induction and maintenance therapy for ulcerative colitis. N Engl J Med 2005;353:2462–2476. [DOI] [PubMed] [Google Scholar]
- 29.Bessissow T, Lemmens B, Ferrante M, et al. Prognostic value of serologic and histologic markers on clinical relapse in ulcerative colitis patients with mucosal healing. Am J Gastroenterol 2012;107:1684–1692. [DOI] [PubMed] [Google Scholar]
- 30.Kim DB, Lee KM, Lee JM, et al. Correlation between Histological Activity and Endoscopic, Clinical, and Serologic Activities in Patients with Ulcerative Colitis. Gastroenterol Res Pract 2016;2016:5832051. [DOI] [PMC free article] [PubMed] [Google Scholar]
- 31.Mosli MH, Zou G, Garg SK, et al. C-Reactive Protein, Fecal Calprotectin, and Stool Lactoferrin for Detection of Endoscopic Activity in Symptomatic Inflammatory Bowel Disease Patients: A Systematic Review and Meta-Analysis. Am J Gastroenterol 2015;110:802–819; quiz 820. [DOI] [PubMed] [Google Scholar]
- 32.Labaere D, Smismans A, Van Olmen A, et al. Comparison of six different calprotectin assays for the assessment of inflammatory bowel disease. United European Gastroenterol J 2014;2:30–37. [DOI] [PMC free article] [PubMed] [Google Scholar]
Associated Data
This section collects any data citations, data availability statements, or supplementary materials included in this article.