Abstract
Background
The prevention of type 2 diabetes (T2D) and its associated complications has become a major priority of global public health. In addition, there is growing evidence that nonalcoholic fatty liver disease (NAFLD) is associated with an increased risk of diabetes. Therefore, the purpose of this study was to develop and validate a nomogram based on independent predictors to better assess the 8-year risk of T2D in Japanese patients with NAFLD.
Methods
This is a historical cohort study from a collection of databases that included 2741 Japanese participants with NAFLD without T2D at baseline. All participants were randomized to a training cohort (n = 2058) and a validation cohort (n = 683). The data of the training cohort were analyzed using the least absolute shrinkage and selection operator method to screen the suitable and effective risk factors for Japanese patients with NAFLD. A cox regression analysis was applied to build a nomogram incorporating the selected features. The C-index, receiver operating characteristic curve (ROC), calibration plot, decision curve analysis, and Kaplan-Meier analysis were used to validate the discrimination, calibration, and clinical usefulness of the model. The results were reevaluated by internal validation in the validation cohort.
Results
We developed a simple nomogram that predicts the risk of T2D for Japanese patients with NAFLD by using the parameters of smoking status, waist circumference, hemoglobin A1c, and fasting blood glucose. For the prediction model, the C-index of training cohort and validation cohort was 0.839 (95% confidence interval (CI), 0.804-0.874) and 0.822 (95% CI, 0.777-0.868), respectively. The pooled area under the ROC of 8-year T2D risk in the training cohort and validation cohort was 0.811 and 0.805, respectively. The calibration curve indicated a good agreement between the probability predicted by the nomogram and the actual probability. The decision curve analysis demonstrated that the nomogram was clinically useful.
Conclusions
We developed and validated a nomogram for the 8-year risk of incident T2D among Japanese patients with NAFLD. Our nomogram can effectively predict the 8-year incidence of T2D in Japanese patients with NAFLD and helps to identify people at high risk of T2D early, thus contributing to effective prevention programs for T2D.
1. Introduction
The global prevalence of adult diabetes has increased rapidly in recent decades and has become a major public health problem [1]. Type 2 diabetes (T2D), the most common form of diabetes, is a chronic disease characterized by elevated blood glucose levels due to insufficient insulin production and insulin resistance [2]. In addition, there is growing evidence that nonalcoholic fatty liver disease (NAFLD) is associated with an increased risk of diabetes, independent of traditional diabetes risk factors [3, 4]. As a debilitating chronic epidemic, a core component of T2D prevention strategies is to identify individuals at high risk of T2D [5]. Studies have shown that early identification of people at high risk for T2D and timely lifestyle changes or pharmacological interventions can delay the process of β-cell failure and the development of T2D [6, 7]. Therefore, it is important to study the risk factors for the development of T2D in Japanese patients with NAFLD and to find an easy, reliable, and accurate screening tool for the identification of T2D high-risk groups in NAFLD. This will contribute to the effective implementation of T2D prevention programs in Japanese adults with NAFLD.
Risk prediction models have great potential in the decision-making process for the management of subhealthy populations and patients [8, 9]. Risk prediction models can help guide screening and interventions to predict the onset of diseases. At present, a variety of risk prediction models have been constructed to identify individuals at high risk of T2D, such as Leicester Risk Assessment [10], the Cambridge Risk Score [11], QDiabetes® Calculator [12], and the FINDRISC [13], but they all have a number of limitations. First, most do not take into account lifestyle changes such as physical activity, smoking, and alcohol consumption behaviors. Others are based on invasive and cost-effective data, or small-scale and inappropriate cohort selection. Others are based on short-term follow-up or lack of transparent reporting on the steps that produced the pattern. Most importantly, these diabetes prediction models are based on the general population and limited research focused on individuals at low risk.
The purpose of this paper is to develop a T2D risk prediction model for Japanese patients with NAFLD based on data from the NAGALA cohort study to better screen and assess the 8-year risk of developing T2D in high-risk nondiabetic patients.
2. Materials and Methods
2.1. Data Source
We have downloaded the raw data uploaded by Okamura et al. from the “DATADRYAD” database (http://www.datadryad.org) for free. Since Okamura et al. [14] have granted the data Dryad website ownership of the raw data, we were able to use them for secondary data analysis according to different scientific hypotheses (Dryad data package: 10.5061/dryad.8q0p192).
2.2. Data Description
The raw data variables in the database file included baseline information, incident T2D, and follow-up time. The following variables were extracted: incident T2D, follow-up duration, gender, age, waist circumference (WC), BMI (body mass index), fatty liver, alcohol consumption, smoking status, exercise habits, aspartate transaminase (AST), alanine aminotransferase (ALT), high-density lipoprotein cholesterol (HDL-C), gamma-glutamyl transferase (GGT), triglycerides (TG), total cholesterol (TC), fasting plasma glucose (FPG), hemoglobin A1c (HbA1c), systolic blood pressure (SBP), and diastolic blood pressure (DBP).
2.3. Study Design and Participants
In this study, Okamura et al. [14] used the NAGALA (NAfld in the Gifu Area, Longitudinal Analysis) database to investigate the effect of obesity phenotype on the risk of developing T2D. Since most of the participants require repeated examinations, the researchers conducted a follow-up study of incident T2D diagnosed by blood tests and fatty liver diagnosed by abdominal ultrasound. This study was a secondary analysis of the open data from the NAGALA study. The inclusion criteria for the NAGALA study were described in detail in the original article [15]. Briefly, a total of 15744 participants were selected according to the following exclusion criteria: (1) a lack of important data; (2) the participants had hepatitis B or C virus or fatty liver disease; (3) alcohol intake exceeding 60 g per day for men or 40 g per day for women; (4) the participants took medication at baseline; (5) fasting plasma glucose ≥ 6.1 mmol/L.
2.4. Data Collection and Measurements
In the initial study, a standardized self-administered questionnaire was used to survey all participants about their medical history and lifestyle factors, including physical activity, alcohol consumption, and smoking habits. Researchers assessed alcohol consumption by asking participants about the type and amount of alcohol consumed per week in the previous month and then estimated the average weekly alcohol consumption. Participants were divided into the following four groups: no or light drinking, <40 g/week; light drinking, 40-140 g/week; moderate drinking, 140-280 g/week; or heavy drinking, >280 g/week. The researchers also divided the participants into three groups based on their smoking status: never smokers, past smokers, or current smokers. Nonsmokers were defined as participants who never smoked, past smokers were defined as participants who smoked in the past but quit before the baseline examination, and current smokers were defined as participants who smoked at the time of the baseline examination. Researchers also investigated participants' recreational and physical activities. The researchers defined regular exercisers as participants who participated in any type of exercise at least once a week.
2.5. Definitions
T2D was defined as HbA1c ≥ 48 mmol/mol, FPG ≥ 126 mg/dL, and/or self-reported diabetes during follow-up. NAFLD was defined as having fatty liver demonstrated by abdominal ultrasound.
2.6. Ethical Approval
As this study is the second analysis of existing anonymous data, informed consent of participants is not required. Published paper details the ethical permission [14].
2.7. Statistical Analyses
The study is consistent with the transparent report of the multivariate predictive model of individual prognosis or diagnosis (TRIPOD): the TRIPOD statement [16].
Statistical analyses were performed using R software (version 3.6.3; https://www.R-project.org). First, 2741 Japanese patients with NAFLD were randomly divided into a training cohort of 2058 and a validation cohort of 683 for external validation using the R-caret package, consistent with a theoretical ratio of 3 : 1. Data were expressed as mean ± standard deviation (normal distribution) or median (quartile) (skewed distribution) for continuous variables, and categorical variables were evaluated by calculating frequencies or percentages. Two-sample t-tests were used to analyze differences between the training and validation cohorts for normally distributed continuous variables, the Wilcoxon rank-sum test for nonnormally distributed continuous variables, and the chi-square test for categorical variables. And then, the data of the training cohort were analyzed using the least absolute shrinkage and selection operator (LASSO) method to screen the suitable and effective risk factors for Japanese patients with NAFLD. LASSO regression is a method to simplify high-dimensional data. Features with nonzero coefficients can be selected in the LASSO regression model. Next, indicators selected in the LASSO regression model were included in the univariate and multivariate cox regression analysis of risk factors related to T2D, and the hazard ratio (HR) and 95% confidence interval (CI) were calculated. The results of the univariate and multivariate cox regression analyzes were visualized using forest plots. Finally, results of the multivariate cox regression analysis were used to construct a nomogram prediction model. In addition, a variety of validation methods were used to estimate the accuracy of the risk prediction model by using data from the training and validation cohorts, respectively. C-index and receiver operating characteristic (ROC) curve were used to quantify the discrimination performance of nomogram. We plotted and calculated calibration curves using the rms software package, which was used to evaluate the calibration of the T2D risk nomogram and accompanied by a Hosmer-Lemeshow test. Decision curve analysis was performed to determine the clinical application of the T2D risk prediction model: the proportion of true positive results minus the proportion of false positive results, and then, the relative risks of false positive and false negative results were weighted to obtain the net benefits of decision-making. Bootstraps for 1000 resample were performed on the ROC curve, C-index, calibration curve, and decision curve analysis to reduce overfitting deviation. Survival analysis was also performed using the Kaplan-Meier analysis between low-risk and high-risk groups according to the cut-off value of 50%, and the log-rank test was performed to compare survival variance in different groups. All statistical tests were two-sided, and P values of <0.05 were considered significant.
3. Results
3.1. Baseline Characteristics of the Study Cohort
A total of 2741 participants were included in this study, of which 2058 were in the training cohort and 683 were in the validation cohort. A flow diagram of studying design is depicted in Figure 1. The overall incidence of T2D was 8.14% (223/2518). In the training and validation cohorts, the incidence of T2D was 157 (7.63%) and 66 (9.66%), respectively. The median follow-up time for the training cohort was 1865 days (quartile: 779-3445), and the median follow-up time for the validation cohort was 2073 days (quartile: 1054-3474). In addition, there were no significant differences observed between the two cohorts. Baseline characteristics of training and validation cohorts are summarized in Table 1.
Figure 1.
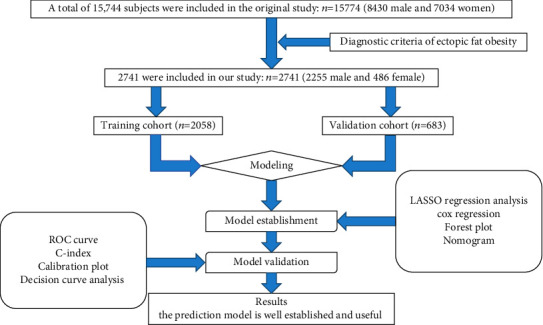
Flow diagram of study design.
Table 1.
Demographic and clinical characteristics of the study population in the training and validation cohorts.
| Variables | Total | Training cohort | Validation cohort | P value |
|---|---|---|---|---|
| No. of participants | 2741 | 2058 | 683 | |
| Age (years) | 44.80 ± 8.29 | 44.98 ± 8.34 | 44.27 ± 8.14 | 0.054 |
| BMI (kg/m2) | 25.48 ± 3.10 | 25.48 ± 3.08 | 25.50 ± 3.18 | 0.898 |
| WC (cm) | 86.10 ± 7.75 | 86.09 ± 7.64 | 86.13 ± 8.07 | 0.706 |
| ALT (IU/L) | 27.00 (20.00-39.00) | 27.00 (20.00-39.00) | 26.00 (20.00-38.00) | 0.843 |
| AST (IU/L) | 22.54 ± 9.94 | 21.00 (17.00-26.00) | 20.00 (16.00-25.50) | 0.805 |
| GGT (IU/L) | 23.00 (17.00-35.00) | 23.00 (17.00-35.00) | 23.00 (16.00-34.00) | 0.139 |
| HDL-C (mmol/L) | 1.19 ± 0.30 | 1.19 ± 0.29 | 1.19 ± 0.31 | 0.564 |
| TC (mmol/L) | 5.44 ± 0.86 | 5.45 ± 0.85 | 5.43 ± 0.92 | 0.559 |
| TG (mmol/L) | 1.25 (0.88-1.82) | 1.25 (0.88-1.82) | 1.25 (0.85-1.82) | 0.526 |
| HbA1c (mmol/mol) | 34.34 ± 3.65 | 34.36 ± 3.66 | 34.29 ± 3.63 | 0.648 |
| FPG (mg/dL) | 97.32 ± 6.56 | 97.27 ± 6.60 | 97.48 ± 6.44 | 0.464 |
| SBP (mmHg) | 123.77 ± 14.79 | 124.01 ± 14.85 | 123.07 ± 14.59 | 0.152 |
| DBP (mmHg) | 78.13 ± 10.18 | 78.28 ± 10.19 | 77.66 ± 10.14 | 0.169 |
| Gender (n (%)) | 0.635 | |||
| Female | 486 (17.73%) | 369 (17.93%) | 117 (17.13%) | |
| Male | 2255 (82.27%) | 1689 (82.07%) | 566 (82.87%) | |
| Habit of exercise (n (%)) | 0.313 | |||
| No | 2340 (85.37%) | 1765 (85.76%) | 575 (84.19%) | |
| Yes | 401 (14.63%) | 293 (14.24%) | 108 (15.81%) | |
| Alcohol consumption (n (%)) | <0.001 | |||
| None | 2088 (76.18%) | 1574 (76.48%) | 514 (75.26%) | |
| Light | 286 (10.43%) | 232 (11.27%) | 54 (7.91%) | |
| Moderate | 250 (9.12%) | 179 (8.70%) | 71 (10.40%) | |
| Heavy | 117 (4.27%) | 73 (3.55%) | 44 (6.44%) | |
| Smoking status (n (%)) | 0.022 | |||
| Never | 1226 (44.73%) | 944 (45.87%) | 282 (41.29%) | |
| Past | 726 (26.49%) | 549 (26.68%) | 177 (25.92%) | |
| Current | 789 (28.79%) | 565 (27.45%) | 224 (32.80%) | |
| Follow-up duration (days) | 1902.00 (826.00-3460.00) | 1865.00 (778.50-3444.75) | 2073.00 (1053.50-3474.00) | 0.195 |
| Incident T2D (n (%)) | 0.092 | |||
| No | 2518 (91.86%) | 1901 (92.37%) | 617 (90.34%) | |
| Yes | 223 (8.14%) | 157 (7.63%) | 66 (9.66%) |
Notes: data are presented as n (%), mean ± SD, or median (IQR). Abbreviations: WC: waist circumference; BMI: body mass index; AST: aspartate aminotransferase; ALT: alanine aminotransferase; HDL-C: high-density lipoprotein cholesterol; GGT: gamma-glutamyl transferase; TG: triglyceride; TC: total cholesterol; FPG: fasting plasma glucose; HbA1c: hemoglobin A1c; DBP: diastolic blood pressure; SBP: systolic blood pressure; T2D: type 2 diabetes.
3.2. Characteristics of Selection by LASSO Regression Analysis
Seventeen potential risk factors were selected from demography and clinical characteristics and analyzed by LASSO regression (Figures 2(a) and 2(b)). Nonzero characteristic variables were selected based on the statistical approach of the LASSO regression model. Therefore, the number of potential variables was reduced from seventeen to four, including smoking status, WC, FPG, and HbA1c. Table 2 shows the specific coefficients corresponding to the variables of lambda.1se.
Figure 2.
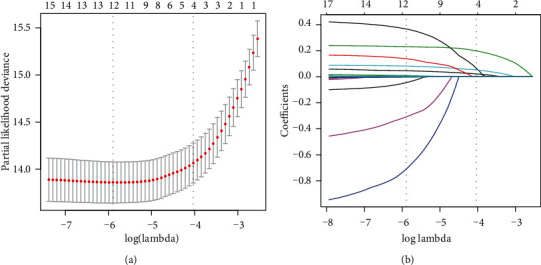
Demographic and clinical feature selection using the LASSO regression model. (a) Tenfold cross-validated error (first vertical line equals the minimum error, whereas the second vertical line shows the cross-validated error within 1 standard error of the minimum). (b) LASSO coefficient profiles of all the clinical features. A coefficient profile plot was produced against the log(lambda) sequence. Each of the different colored curves in the figure represents the trajectory of each independent variable coefficient. The vertical coordinate is the value of the coefficient, the lower horizontal coordinate is log(lambda), and the upper horizontal coordinate is the number of nonzero coefficients in the model. LASSO: least absolute shrinkage and selection operator; SE: standard error.
Table 2.
Coefficients and lambda.1se value of the LASSO regression based on the training cohort.
| Factors | Coefficients | Lambda.1se |
|---|---|---|
| Smoking status | 0.065 | 0.018 |
| WC (cm) | 0.022 | |
| FPG (mg/dL) | 0.052 | |
| HbA1c (mmol/mol) | 0.199 |
Abbreviations: LASSO: least absolute shrinkage and selection operator; WC: waist circumference; FPG: fasting plasma glucose; HbA1c: hemoglobin A1c.
3.3. Univariate and Multivariate cox Regression Analysis in the Training Cohort
Univariate and multivariate cox regression analyses (Figure 3(a) of univariate analysis and Figure 3(b) of multivariate analysis) were performed on 2058 Japanese patients with NAFLD in the training cohort. The results showed that smoking status, WC, FPG, and HbA1c were considered to be independent predictors of T2D (P < 0.05).
Figure 3.
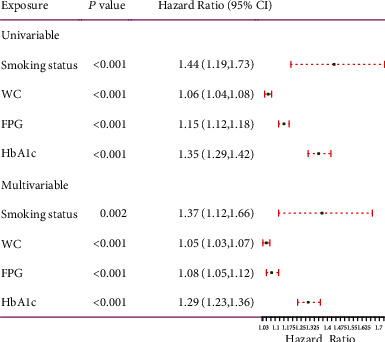
Forest plot of univariable and multivariable cox regression analysis for risk factors associated with T2D. HR: hazard ratio; CI: confidence interval.
3.4. Development of the Individualized Prediction Model
We have combined the above four independent predictors into a predictive model and displayed it in the form of a nomogram. As shown in Figure 4, the nomogram is a quantitative and convenient tool. To obtain a personalized 8-year risk of T2D in Japanese patients with NAFLD, a vertical line was drawn from the values on the point scale to assess these points, which were then summed to obtain values for each variable. The sum includes the total score and matches the risk on the bottom axis.
Figure 4.
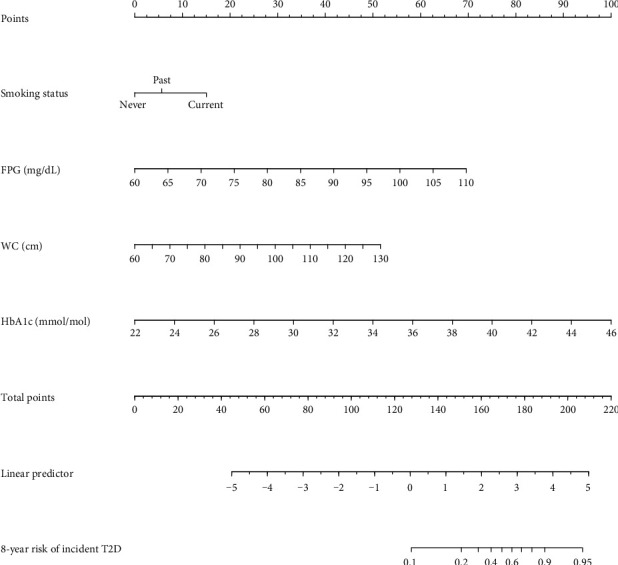
Nomogram for predicting the 8-year risk of T2D in adults with NAFLD. To use the nomogram, an individual patient's value is located on each variable axis, and a line is drawn upward to determine the number of points received for each variable value. The scores for all variables are then added to obtain the total score, and a vertical line is drawn from the total-points row to estimate the 8-year risk of T2D in adults with NAFLD at the lower line of the nomogram.
3.5. Performance of the Nomogram
The ROC curve and C-index were used to evaluate the discriminatory ability of the prediction model. For the prediction model, the pooled area under the ROC of the nomogram was 0.811 with a sensitivity and specificity of 77.49% and 72.36%, respectively, in the training cohort (Figure 5(a)). It was 0.805 in the validation cohort, with sensitivities and specificities of 69.88% and 75.59%, respectively (Figure 5(b)), which indicates a moderately good performance. The C-index of training cohort and validation cohort was 0.839 (95% CI, 0.804-0.874) and 0.822 (95% CI, 0.777-0.868), respectively. As shown in Table 3, the nomogram showed a good prediction model. The prediction model was calibrated using the calibration curve and the Hosmer-Lemeshow test. From the calibration curves, the prediction model showed a good fit in both the training and validation cohorts (Figures 6(a) and 6(b)). As shown by the Hosmer-Lemeshow test, there was good agreement between the predicted and actual probabilities in both the training and validation cohorts. The decision curve analysis of the training cohort (Figure 7(a)) and the validation cohort (Figure 7(b)) indicated that the application of the prediction model in Japanese patients with NAFLD to predict the risk of T2D incidence is more effective than the intervention-for-all-patients scheme. Each patient was divided into a high-risk or low-risk group according to the cut-off value of 50% predicted by nomogram. Kaplan-Meier survival analysis yielded a significant difference in T2D-free survival probability between the training cohort (Figure 8(a)) and the validation cohort (Figure 8(b)). This stratification could effectively discriminate the T2D prevalence outcomes of the two risk groups in the training and validation cohort.
Figure 5.
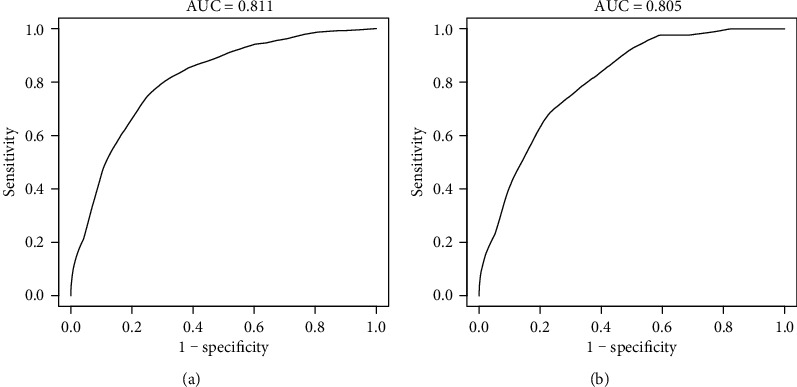
ROC curve of the nomogram in the training and validation cohort. (a) ROC curve of the nomogram in the training cohort. (b) ROC curve of the nomogram in the validation cohort. ROC: receiver operating characteristic; AUC: area under the curve (bootstrap resampling times = 1000).
Table 3.
C-index in the nomogram based on training cohort and validation cohort.
| C-index (95% CI) | Dxy | aDxy | Variance | Z value | P value | n | |
|---|---|---|---|---|---|---|---|
| Training cohort | 0.839 (0.804, 0.874) | 0.678 | 0.678 | 0.036 | 19.055 | <0.001 | 2058 |
| Validation cohort | 0.822 (0.777, 0.868) | 0.644 | 0.644 | 0.047 | 13.827 | <0.001 | 683 |
Figure 6.
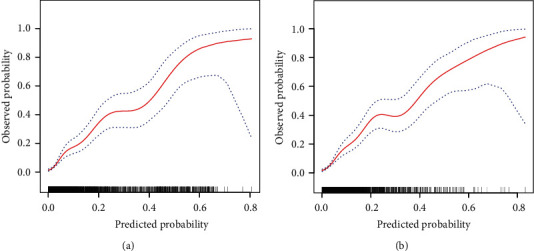
Calibration curves for the training and validation cohort models. (a) Calibration curve of the nomogram in the training cohort. (b) Calibration curve of the nomogram in the validation cohort. The red curve is a calibration curve corresponding to the actual situation. The blue curve represents the 95% CI range of the calibration curve (bootstrap resampling times = 1000).
Figure 7.
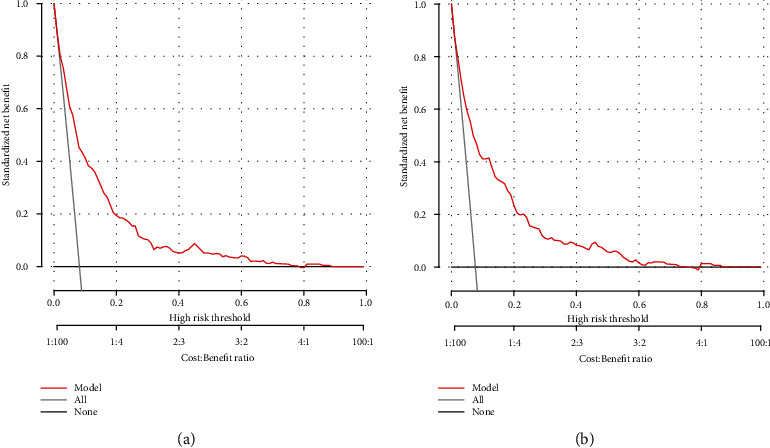
Decision curve analysis of the nomogram in the training (a) and validation cohorts (b). The y-axis stands the net benefit. The x-axis indicates the threshold probability. The red line represents the nomogram. The black line displays the net benefit of the strategy of treating no patients. The gray line displays the net benefit of the strategy of treating all patients (bootstrap resampling times = 1000).
Figure 8.
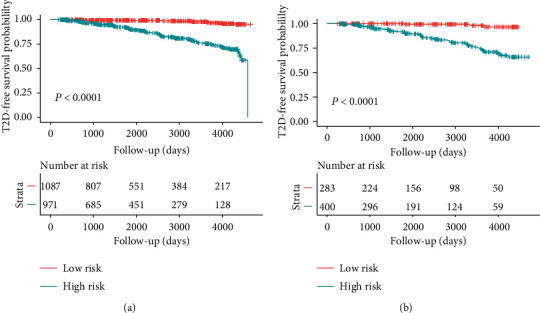
Kaplan-Meier curves of risk group stratification based on the predictor from nomogram prediction. Kaplan-Meier curves show the T2D-free survival probability of high risk (blue) and low risk (red) groups between the training cohort (a) and the validation cohort (b). Risk tables are also added.
4. Discussion
With rapid economic development, human lifestyles have changed dramatically worldwide. The prevalence and incidence of T2D are rapidly increasing worldwide [17]. T2D is associated with an increased risk of cardiovascular disease and premature death. It is the main cause of end-stage renal disease, blindness, and nontraumatic amputations resulting from microvascular complications, thus imposing a significant economic burden on society [18, 19]. The risk of T2D is strongly associated with lifestyle, nutritional status, and environmental factors [20]. Several large intervention studies have shown that lifestyle changes or pharmacological interventions targeting people at risk of T2D can effectively prevent or delay the onset of T2D and reduce the risk of death from T2D and its complications [21, 22]. The key to successful intervention is the early identification of people at high risk of T2D [18]. In recent years, numerous T2D risk prediction models have been developed and tested, such as the Australian Type 2 Diabetes Risk Assessment Tool [23], the Cambridge Risk Score [11], the Finnish Risk Score [13], the Framingham Diabetes Risk Score [24], and among others [25–27]. However, there is a lack of a risk prediction model based on cohort study data for the Japanese population, especially for patients with NAFLD. Most of the available T2D risk prediction models are only applicable to the target population, and direct application of these models constructed mainly from populations of European origin may underestimate the risk of developing T2D in the Japanese population. Based on data from the NAGALA cohort study, we aimed to develop a T2D risk prediction model for Japanese patients with NAFLD to identify individuals with high risk of T2D.
In this retrospective cohort study, we developed and validated a nomogram model using cost-effective and easily available parameters to predict the 8-year risk of T2D in Japanese patients with NAFLD and to help clinicians identify high-risk populations for T2D. In the training and validation cohorts, our nomogram has excellent prediction performance and also has excellent consistency on the calibration curve. The decision curve analysis illustrates the clinical application value of nomogram. To the best of our knowledge, this study is the first nomogram to use continuous values instead of segmented values to estimate the risk of type 2 diabetes in Japanese patients with NAFLD. In addition, the nomogram will be of great practical value due to its easily available parameters.
Our prediction model includes four parameters: smoking status, WC, FPG, and HbA1c. These variables identified as risk factors for T2D were consistent with previous studies [28, 29]. In our nomogram, current or past smokers have a higher risk of developing T2D than never-smokers. Numerous epidemiological studies have confirmed that smoking is associated not only with the occurrence of T2D but also with the increased risk of T2D hospitalization and mortality, and the risk increases in a dose-dependent manner with the increase of daily smoking [30–32]. According to the 2014 US secretary of health report, compared with nonsmokers, smoking increases the risk of T2D of active smokers by 30-40%, which indicates that smoking cessation should be emphasized as a basic public health strategy to combat the global diabetes epidemic [33]. The World Health Organization also recognizes that smoking is a preventable risk factor for T2D and agrees to avoid smoking/quit smoking as part of its lifestyle recommendations [30], although there is a lack of a complete understanding of the potential pathways of tobacco abuse, especially the mechanism of pancreatic beta cells. However, data from numerous clinical studies suggest that smoking and nicotine have effects on body composition, pancreatic beta cell function, and peripheral insulin sensitivity [20, 29, 34, 35].
Obesity has become a major global epidemic affecting more than 300 million people, and it is the most important risk factor leading to the onset of T2D [36, 37]. BMI has been used as a surrogate marker of obesity and as one of the predictor variables in most diabetes risk models [38–41]. However, BMI does not reflect central obesity. Compared with BMI, WC has a better predictive value for incident T2D, which is consistent with the results of this study [42–44]. WC is a simple anthropometric parameter of abdominal obesity; it is an indicator of central obesity, whereas BMI is an indicator of general obesity [45, 46]. Central obesity is a recognized risk factor for the metabolic syndrome and is strongly associated with the secretion of adipocytokines and inflammatory cytokines, all of which are strongly associated with an increased risk of developing T2D [47–49]. Elevated WC always leads to an accumulation of abdominal fat and a subsequent increase in free fatty acid levels [50]. Excess of circulating free fatty acids leads to insulin resistance by inhibiting insulin signalling and directly accelerating the rate of hepatic gluconeogenesis, coupled with desensitization of the hepatic regulatory loop involving fatty acids by hypothalamic sensing [51–53]. Therefore, waist circumference was used as the basis for the construction of the predictive model in this study.
The FPG level can reflect the secretion level and function of basal insulin [54]. Many epidemiological studies have shown that baseline FPG levels are highly predictive of T2D, and the elevated baseline FPG levels are closely related to the increased risk of developing T2D [55–58]. HbA1c is a comprehensive measurement method of circulating blood glucose level, which reflects the average blood glucose level over the previous 2-3 months and is used as the gold standard for long-term follow-up of blood glucose control [59, 60]. Compared with the oral glucose tolerance test (OGTT) and 2hPG, the measurement of HbA1c is faster and more convenient and can be measured at any time, regardless of the length of fasting or the composition of the previous meal [61, 62]. Epidemiological studies show that elevated HbA1c in nondiabetic adults is associated with T2D incidence rate, incidence rate of cardiovascular disease, and mortality [63–65]. A recent recommendation by the American Diabetes Association Committee on the Diagnosis and Classification of Diabetes Mellitus advocates the use of HbA1c as a practical and effective test method in the diagnosis of prediabetes to identify high-risk groups, and it may be cost-effective to carry out intensive lifestyle interventions to prevent T2D. The decision of the American Diabetes Association Committee is mainly based on the established association between HbA1c and microvascular diseases [59].
Although our nomogram performed well, several limitations warrant mention. First, we relied on FPG and HbA1c, rather than OGTT, to define incident T2D. However, OGTT is not feasible to carry out this test in a large sample. HbA1c does not need fasting, reflecting the long-term blood glycemic status. In addition, the International Expert Committee also recommended the use of HbA1c to diagnose diabetes [66]. Second, our validation cohort was derived from the same population as the training cohort, which may indicate that the findings were overly optimistic. Future research could verify the performance of this prediction model with other databases. Third, this large-scale cohort study was conducted in Japan. Therefore, whether the results of this study can be generalized to other ethnic groups and some specific groups, such as pregnant women and children, requires further validation by external cohorts. Fourth, the current assessment results might not be satisfactory in practice, and some novel biochemical markers or indicators, especially of genetic factors, could improve the performance of the prediction model in the future. Finally, this report is a second analysis based on the existing database. Although many confounding factors have been adjusted, these potential predictors were not included in our prediction model because data on socioeconomic status, lifestyle (except for smoking, drinking, and exercise habits), disease history (such as cardiovascular disease and chronic kidney disease), family health history (such as diabetes), and specific timing of diabetes diagnosis (especially for self-reported diabetes) were not collected in the database.
5. Conclusion
In summary, we developed and validated a nomogram for the 8-year risk of incident in T2D among Japanese patients with NAFLD, including smoking status, WC, FPG, and HbA1c. Our prediction model can effectively predict the 8-year incidence of T2D in Japanese patients with NAFLD and helps to identify people at high risk of T2D early, thus contributing to effective prevention programs for T2D.
Acknowledgments
The study was supported by the National Key Research and Development Program (grant no. 2018YFC1311503).
Data Availability
All datasets generated and/or analyzed during the present study are included in this published article and available in Dryad (http://www.datadryad.org/).
Conflicts of Interest
The authors declare that they have no conflicts of interest.
Authors' Contributions
Xintian Cai and Nanfang Li conceived and designed the study, are involved in data management, wrote the first draft, and revised the final manuscript. Yuanyuan Cao, Qing Zhu, Jing Hong, and Shasha Liu screened data from the database. Ayguzal Ahmat, Xiayire Aierken, Ting Wu, and Mengru Wang contributed to the collection and analysis of the data and the preparation of figures and tables. All authors read and approved the final manuscript.
References
- 1.Magliano D. J., Sacre J. W., Harding J. L., Gregg E. W., Zimmet P. Z., Shaw J. E. Young-onset type 2 diabetes mellitus -- implications for morbidity and mortality. Nature Reviews. Endocrinology. 2020;16(6):321–331. doi: 10.1038/s41574-020-0334-z. [DOI] [PubMed] [Google Scholar]
- 2.Nair G. G., Tzanakakis E. S., Hebrok M. Emerging routes to the generation of functional β-cells for diabetes mellitus cell therapy. Nature Reviews. Endocrinology. 2020;16(9):506–518. doi: 10.1038/s41574-020-0375-3. [DOI] [PMC free article] [PubMed] [Google Scholar]
- 3.Tilg H., Moschen A. R., Roden M. NAFLD and diabetes mellitus. Nature Reviews. Gastroenterology & Hepatology. 2017;14(1):32–42. doi: 10.1038/nrgastro.2016.147. [DOI] [PubMed] [Google Scholar]
- 4.Hazlehurst J. M., Woods C., Marjot T., Cobbold J. F., Tomlinson J. W. Non-alcoholic fatty liver disease and diabetes. Metabolism, Clinical and Experimental. 2016;65(8):1096–1108. doi: 10.1016/j.metabol.2016.01.001. [DOI] [PMC free article] [PubMed] [Google Scholar]
- 5.Strain W. D., Paldánius P. M. Diabetes, cardiovascular disease and the microcirculation. Cardiovascular Diabetology. 2018;17(1):p. 57. doi: 10.1186/s12933-018-0703-2. [DOI] [PMC free article] [PubMed] [Google Scholar]
- 6.Zhao R., Hui A. L., Yao X., Zhang C., Shen F. Diabetes prevention, early intervention, and nondrug therapy. Journal of Diabetes Research. 2017;2017:2. doi: 10.1155/2017/5184250.5184250 [DOI] [PMC free article] [PubMed] [Google Scholar]
- 7.Brannick B., Dagogo-Jack S. Prediabetes and cardiovascular disease: pathophysiology and interventions for prevention and risk reduction. Endocrinology and Metabolism Clinics of North America. 2018;47(1):33–50. doi: 10.1016/j.ecl.2017.10.001. [DOI] [PMC free article] [PubMed] [Google Scholar]
- 8.Lucaroni F., Cicciarella Modica D., Macino M., et al. Can risk be predicted? An umbrella systematic review of current risk prediction models for cardiovascular diseases, diabetes and hypertension. BMJ Open. 2019;9(12, article e030234) doi: 10.1136/bmjopen-2019-030234. [DOI] [PMC free article] [PubMed] [Google Scholar]
- 9.Jiang W., Wang J., Shen X., et al. Establishment and validation of a risk prediction model for early diabetic kidney disease based on a systematic review and meta-analysis of 20 cohorts. Diabetes Care. 2020;43(4):925–933. doi: 10.2337/dc19-1897. [DOI] [PubMed] [Google Scholar]
- 10.Gray L. J., Taub N. A., Khunti K., et al. The Leicester Risk Assessment score for detecting undiagnosed type 2 diabetes and impaired glucose regulation for use in a multiethnic UK setting. Diabetic Medicine. 2010;27(8):887–895. doi: 10.1111/j.1464-5491.2010.03037.x. [DOI] [PubMed] [Google Scholar]
- 11.Griffin S. J., Little P. S., Hales C. N., Kinmonth A. L., Wareham N. J. Diabetes risk score: towards earlier detection of type 2 diabetes in general practice. Diabetes/Metabolism Research and Reviews. 2000;16(3):164–171. doi: 10.1002/1520-7560(200005/06)16:3<164::AID-DMRR103>3.0.CO;2-R. [DOI] [PubMed] [Google Scholar]
- 12.Hippisley-Cox J., Coupland C., Robson J., Sheikh A., Brindle P. Predicting risk of type 2 diabetes in England and Wales: prospective derivation and validation of QDScore. BMJ. 2009;338(mar17 2):p. b880. doi: 10.1136/bmj.b880. [DOI] [PMC free article] [PubMed] [Google Scholar]
- 13.Lindström J., Tuomilehto J. The diabetes risk score: a practical tool to predict type 2 diabetes risk. Diabetes Care. 2003;26(3):725–731. doi: 10.2337/diacare.26.3.725. [DOI] [PubMed] [Google Scholar]
- 14.Okamura T., Hashimoto Y., Hamaguchi M., Obora A., Kojima T., Fukui M. Ectopic fat obesity presents the greatest risk for incident type 2 diabetes: a population-based longitudinal study. International Journal of Obesity. 2019;43(1):139–148. doi: 10.1038/s41366-018-0076-3. [DOI] [PubMed] [Google Scholar]
- 15.Hamaguchi M., Kojima T., Takeda N., et al. The metabolic syndrome as a predictor of nonalcoholic fatty liver disease. Annals of Internal Medicine. 2005;143(10):722–728. doi: 10.7326/0003-4819-143-10-200511150-00009. [DOI] [PubMed] [Google Scholar]
- 16.Collins G. S., Reitsma J. B., Altman D. G., Moons K. G. Transparent reporting of a multivariable prediction model for individual prognosis or diagnosis (TRIPOD): the TRIPOD statement. BMJ. 2015;350:p. g7594. doi: 10.1136/bmj.g7594. [DOI] [PubMed] [Google Scholar]
- 17.Lascar N., Brown J., Pattison H., Barnett A. H., Bailey C. J., Bellary S. Type 2 diabetes in adolescents and young adults. The lancet. Diabetes & endocrinology. 2018;6(1):69–80. doi: 10.1016/S2213-8587(17)30186-9. [DOI] [PubMed] [Google Scholar]
- 18.Zheng Y., Ley S. H., Hu F. B. Global aetiology and epidemiology of type 2 diabetes mellitus and its complications. Nature Reviews. Endocrinology. 2018;14(2):88–98. doi: 10.1038/nrendo.2017.151. [DOI] [PubMed] [Google Scholar]
- 19.Gloyn A. L., Drucker D. J. Precision medicine in the management of type 2 diabetes. The lancet. Diabetes & endocrinology. 2018;6(11):891–900. doi: 10.1016/S2213-8587(18)30052-4. [DOI] [PubMed] [Google Scholar]
- 20.Kolb H., Martin S. Environmental/lifestyle factors in the pathogenesis and prevention of type 2 diabetes. BMC Medicine. 2017;15(1):p. 131. doi: 10.1186/s12916-017-0901-x. [DOI] [PMC free article] [PubMed] [Google Scholar]
- 21.Captieux M., Prigge R., Wild S., Guthrie B. Defining remission of type 2 diabetes in research studies: a systematic scoping review. PLoS Medicine. 2020;17(10, article e1003396) doi: 10.1371/journal.pmed.1003396. [DOI] [PMC free article] [PubMed] [Google Scholar]
- 22.Wang N., Zhu F., Chen L., Chen K. Proteomics, metabolomics and metagenomics for type 2 diabetes and its complications. Life Sciences. 2018;212:194–202. doi: 10.1016/j.lfs.2018.09.035. [DOI] [PubMed] [Google Scholar]
- 23.Chen L., Magliano D. J., Balkau B., et al. AUSDRISK: an Australian type 2 diabetes risk assessment tool based on demographic, lifestyle and simple anthropometric measures. The Medical Journal of Australia. 2010;192(4):197–202. doi: 10.5694/j.1326-5377.2010.tb03478.x. [DOI] [PubMed] [Google Scholar]
- 24.Wannamethee S. G., Shaper A. G., Lennon L., Morris R. W. Metabolic syndrome vs Framingham risk score for prediction of coronary heart disease, stroke, and type 2 diabetes mellitus. Archives of Internal Medicine. 2005;165(22):2644–2650. doi: 10.1001/archinte.165.22.2644. [DOI] [PubMed] [Google Scholar]
- 25.Cai X., Zhu Q., Wu T., et al. Development and validation of a novel model for predicting the 5-year risk of type 2 diabetes in patients with hypertension: a retrospective cohort study. BioMed Research International. 2020;2020:12. doi: 10.1155/2020/9108216.9108216 [DOI] [PMC free article] [PubMed] [Google Scholar]
- 26.Reitmeier S., Kiessling S., Clavel T., et al. Arrhythmic gut microbiome signatures predict risk of type 2 diabetes. Cell Host & Microbe. 2020;28(2):258–272.e6. doi: 10.1016/j.chom.2020.06.004. [DOI] [PubMed] [Google Scholar]
- 27.Wilkinson L., Yi N., Mehta T., Judd S., Garvey W. T. Development and validation of a model for predicting incident type 2 diabetes using quantitative clinical data and a Bayesian logistic model: a nationwide cohort and modeling study. PLoS Medicine. 2020;17(8, article e1003232) doi: 10.1371/journal.pmed.1003232. [DOI] [PMC free article] [PubMed] [Google Scholar]
- 28.Weisman A., Fazli G. S., Johns A., Booth G. L. Evolving trends in the epidemiology, risk factors, and prevention of type 2 diabetes: a review. The Canadian Journal of Cardiology. 2018;34(5):552–564. doi: 10.1016/j.cjca.2018.03.002. [DOI] [PubMed] [Google Scholar]
- 29.Rawshani A., Rawshani A., Gudbjörnsdottir S. Smoking and other risk factors in type 2 diabetes. The New England Journal of Medicine. 2018;379(26):p. 2575. doi: 10.1056/NEJMc1812842. [DOI] [PubMed] [Google Scholar]
- 30.Maddatu J., Anderson-Baucum E., Evans-Molina C. Smoking and the risk of type 2 diabetes. Translational research : the journal of laboratory and clinical medicine. 2017;184:101–107. doi: 10.1016/j.trsl.2017.02.004. [DOI] [PMC free article] [PubMed] [Google Scholar]
- 31.Pan A., Wang Y., Talaei M., Hu F. B., Wu T. Relation of active, passive, and quitting smoking with incident type 2 diabetes: a systematic review and meta-analysis. The lancet. Diabetes & endocrinology. 2015;3(12):958–967. doi: 10.1016/S2213-8587(15)00316-2. [DOI] [PMC free article] [PubMed] [Google Scholar]
- 32.Yuan S., Larsson S. C. A causal relationship between cigarette smoking and type 2 diabetes mellitus: a Mendelian randomization study. Scientific Reports. 2019;9(1, article 19342) doi: 10.1038/s41598-019-56014-9. [DOI] [PMC free article] [PubMed] [Google Scholar]
- 33.Warren G. W., Alberg A. J., Kraft A. S., Cummings K. M. The 2014 surgeon General’s report: “the health consequences of smoking--50 years of progress”: a paradigm shift in cancer care. Cancer. 2014;120(13):1914–1916. doi: 10.1002/cncr.28695. [DOI] [PMC free article] [PubMed] [Google Scholar]
- 34.Pan A., Wang Y., Talaei M., Hu F. B. Relation of smoking with total mortality and cardiovascular events among patients with diabetes mellitus: a meta-analysis and systematic review. Circulation. 2015;132(19):1795–1804. doi: 10.1161/CIRCULATIONAHA.115.017926. [DOI] [PMC free article] [PubMed] [Google Scholar]
- 35.Śliwińska-Mossoń M., Milnerowicz H. The impact of smoking on the development of diabetes and its complications. Diabetes & Vascular Disease Research. 2017;14(4):265–276. doi: 10.1177/1479164117701876. [DOI] [PubMed] [Google Scholar]
- 36.Bhupathiraju S. N., Hu F. B. Epidemiology of obesity and diabetes and their cardiovascular complications. Circulation Research. 2016;118(11):1723–1735. doi: 10.1161/CIRCRESAHA.115.306825. [DOI] [PMC free article] [PubMed] [Google Scholar]
- 37.Boles A., Kandimalla R., Reddy P. H. Dynamics of diabetes and obesity: epidemiological perspective. Biochimica et Biophysica Acta, Molecular Basis of Disease. 2017;1863(5):1026–1036. doi: 10.1016/j.bbadis.2017.01.016. [DOI] [PMC free article] [PubMed] [Google Scholar]
- 38.Leitner D. R., Frühbeck G., Yumuk V., et al. Obesity and type 2 diabetes: two diseases with a need for combined treatment strategies - EASO can lead the way. Obesity Facts. 2017;10(5):483–492. doi: 10.1159/000480525. [DOI] [PMC free article] [PubMed] [Google Scholar]
- 39.Sutkowska E., Sutkowski K., Sokołowski M., Franek E., Sr D. S. Distribution of the highest plantar pressure regions in patients with diabetes and its association with peripheral neuropathy, gender, age, and BMI: one centre study. Journal of Diabetes Research. 2019;2019 doi: 10.1155/2019/7395769.7395769 [DOI] [PMC free article] [PubMed] [Google Scholar]
- 40.Svensson M. K., Tyrberg M., Nyström L., et al. The risk for diabetic nephropathy is low in young adults in a 17-year follow-up from the Diabetes Incidence Study in Sweden (DISS). Older age and higher BMI at diabetes onset can be important risk factors. Diabetes/Metabolism Research and Reviews. 2015;31(2):138–146. doi: 10.1002/dmrr.2574. [DOI] [PubMed] [Google Scholar]
- 41.Chiu C. J., Li S. L., Wu C. H., Du Y. F. BMI trajectories as a harbinger of pre-diabetes or underdiagnosed diabetes: an 18-year retrospective cohort study in Taiwan. Journal of General Internal Medicine. 2016;31(10):1156–1163. doi: 10.1007/s11606-016-3750-y. [DOI] [PMC free article] [PubMed] [Google Scholar]
- 42.Wei J., Liu X., Xue H., Wang Y., Shi Z. Comparisons of visceral adiposity index, body shape index, body mass index and waist circumference and their associations with diabetes mellitus in adults. Nutrients. 2019;11(7):p. 1580. doi: 10.3390/nu11071580. [DOI] [PMC free article] [PubMed] [Google Scholar]
- 43.Seo D. C., Choe S., Torabi M. R. Is waist circumference ≥ 102/88 cm better than body mass index ≥ 30 to predict hypertension and diabetes development regardless of gender, age group, and race/ethnicity? Meta-analysis. Preventive Medicine. 2017;97:100–108. doi: 10.1016/j.ypmed.2017.01.012. [DOI] [PubMed] [Google Scholar]
- 44.Venkatrao M., Nagarathna R., Patil S. S., Singh A., Rajesh S. K., Nagendra H. A composite of BMI and waist circumference may be a better obesity metric in Indians with high risk for type 2 diabetes: an analysis of NMB-2017, a nationwide cross-sectional study. Diabetes Research and Clinical Practice. 2020;161:p. 108037. doi: 10.1016/j.diabres.2020.108037. [DOI] [PubMed] [Google Scholar]
- 45.Zeng Q., He Y., Dong S., et al. Optimal cut-off values of BMI, waist circumference and waist:height ratio for defining obesity in Chinese adults. The British Journal of Nutrition. 2014;112(10):1735–1744. doi: 10.1017/S0007114514002657. [DOI] [PubMed] [Google Scholar]
- 46.Oliveros E., Somers V. K., Sochor O., Goel K., Lopez-Jimenez F. The concept of normal weight obesity. Progress in Cardiovascular Diseases. 2014;56(4):426–433. doi: 10.1016/j.pcad.2013.10.003. [DOI] [PubMed] [Google Scholar]
- 47.Smith U. Abdominal obesity: a marker of ectopic fat accumulation. The Journal of Clinical Investigation. 2015;125(5):1790–1792. doi: 10.1172/JCI81507. [DOI] [PMC free article] [PubMed] [Google Scholar]
- 48.Salehinia F., Abdi H., Hadaegh F., et al. Abdominal obesity phenotypes and incident diabetes over 12 years of follow-up: the Tehran lipid and glucose study. Diabetes Research and Clinical Practice. 2018;144:17–24. doi: 10.1016/j.diabres.2018.07.021. [DOI] [PubMed] [Google Scholar]
- 49.Bragg F., Tang K., Guo Y., et al. Associations of general and central adiposity with incident diabetes in Chinese men and women. Diabetes Care. 2018;41(3):494–502. doi: 10.2337/dc17-1852. [DOI] [PMC free article] [PubMed] [Google Scholar]
- 50.Tchernof A., Després J. P. Pathophysiology of human visceral obesity: an update. Physiological Reviews. 2013;93(1):359–404. doi: 10.1152/physrev.00033.2011. [DOI] [PubMed] [Google Scholar]
- 51.Han T. S., Al-Gindan Y. Y., Govan L., Hankey C. R., Lean M. Associations of BMI, waist circumference, body fat, and skeletal muscle with type 2 diabetes in adults. Acta Diabetologica. 2019;56(8):947–954. doi: 10.1007/s00592-019-01328-3. [DOI] [PMC free article] [PubMed] [Google Scholar]
- 52.Vazquez G., Duval S., Jacobs D. R., Jr., Silventoinen K. Comparison of body mass index, waist circumference, and waist/hip ratio in predicting incident diabetes: a meta-analysis. Epidemiologic Reviews. 2007;29(1):115–128. doi: 10.1093/epirev/mxm008. [DOI] [PubMed] [Google Scholar]
- 53.Ren Y., Liu Y., Sun X., et al. Cohort study to determine the waist circumference cutoffs for predicting type 2 diabetes mellitus in rural China. Diabetes/Metabolism Research and Reviews. 2018;34(6):p. e3007. doi: 10.1002/dmrr.3007. [DOI] [PubMed] [Google Scholar]
- 54.Lu J., He J., Li M., et al. Predictive value of fasting glucose, postload glucose, and hemoglobin A1c on risk of diabetes and complications in Chinese adults. Diabetes Care. 2019;42(8):1539–1548. doi: 10.2337/dc18-1390. [DOI] [PubMed] [Google Scholar]
- 55.Bozorgmanesh M., Hadaegh F., Ghaffari S., Harati H., Azizi F. A simple risk score effectively predicted type 2 diabetes in Iranian adult population: population-based cohort study. European Journal of Public Health. 2011;21(5):554–559. doi: 10.1093/eurpub/ckq074. [DOI] [PubMed] [Google Scholar]
- 56.Tabák A. G., Jokela M., Akbaraly T. N., Brunner E. J., Kivimäki M., Witte D. R. Trajectories of glycaemia, insulin sensitivity, and insulin secretion before diagnosis of type 2 diabetes: an analysis from the Whitehall II study. Lancet. 2009;373(9682):2215–2221. doi: 10.1016/S0140-6736(09)60619-X. [DOI] [PMC free article] [PubMed] [Google Scholar]
- 57.Strandberg A. Y., Pienimäki T., Pitkälä K. H., Tilvis R. S., Salomaa V. V., Strandberg T. E. Comparison of normal fasting and one-hour glucose levels as predictors of future diabetes during a 34-year follow-up. Annals of Medicine. 2013;45(4):336–340. doi: 10.3109/07853890.2013.785233. [DOI] [PubMed] [Google Scholar]
- 58.Danaei G., Finucane M. M., Lu Y., et al. National, regional, and global trends in fasting plasma glucose and diabetes prevalence since 1980: systematic analysis of health examination surveys and epidemiological studies with 370 country-years and 2∗7 million participants. Lancet. 2011;378(9785):31–40. doi: 10.1016/S0140-6736(11)60679-X. [DOI] [PubMed] [Google Scholar]
- 59.Okosun I. S., Davis-Smith M., Paul Seale J., Ngulefac J. Applicability of a combination of hemoglobin A(1c) and fasting plasma glucose in population-based prediabetes screening. Journal of Diabetes. 2012;4(4):407–416. doi: 10.1111/j.1753-0407.2012.00188.x. [DOI] [PubMed] [Google Scholar]
- 60.Jia W. Standardising HbA1c-based diabetes diagnosis: opportunities and challenges. Expert Review of Molecular Diagnostics. 2016;16(3):343–355. doi: 10.1586/14737159.2016.1133299. [DOI] [PubMed] [Google Scholar]
- 61.Chatzianagnostou K., Vigna L., di Piazza S., et al. Low concordance between HbA1c and OGTT to diagnose prediabetes and diabetes in overweight or obesity. Clinical Endocrinology. 2019;91(3):411–416. doi: 10.1111/cen.14043. [DOI] [PubMed] [Google Scholar]
- 62.Janghorbani M., Amini M. Incidence of type 2 diabetes by HbA1c and OGTT: the Isfahan diabetes prevention study. Acta Diabetologica. 2012;49(1):S73–S79. doi: 10.1007/s00592-011-0260-6. [DOI] [PubMed] [Google Scholar]
- 63.Carson A. P., Fox C. S., McGuire D. K., et al. Low hemoglobin A1c and risk of all-cause mortality among US adults without diabetes. Circulation. Cardiovascular Quality and Outcomes. 2010;3(6):661–667. doi: 10.1161/CIRCOUTCOMES.110.957936. [DOI] [PMC free article] [PubMed] [Google Scholar]
- 64.Lu J., Wang W., Li M., et al. Associations of hemoglobin A1c with cardiovascular disease and mortality in Chinese adults with diabetes. Journal of the American College of Cardiology. 2018;72(24):3224–3225. doi: 10.1016/j.jacc.2018.09.062. [DOI] [PubMed] [Google Scholar]
- 65.Mancini G., Maron D. J., Hartigan P. M., et al. Lifestyle, glycosylated hemoglobin A1c, and survival among patients with stable ischemic heart disease and diabetes. Journal of the American College of Cardiology. 2019;73(16):2049–2058. doi: 10.1016/j.jacc.2018.11.067. [DOI] [PubMed] [Google Scholar]
- 66.International Expert Committee. International expert committee report on the role of the A1C assay in the diagnosis of diabetes. Diabetes Care. 2009;32(7):1327–1334. doi: 10.2337/dc09-9033. [DOI] [PMC free article] [PubMed] [Google Scholar]
Associated Data
This section collects any data citations, data availability statements, or supplementary materials included in this article.
Data Availability Statement
All datasets generated and/or analyzed during the present study are included in this published article and available in Dryad (http://www.datadryad.org/).


