

Summary
The apolipoprotein E (APOE) gene is the strongest genetic risk factor for Alzheimer disease and directly influences tauopathy and tau-mediated neurodegeneration. ApoE4 has strong deleterious effects on both parameters. In the brain, apoE is produced and secreted primarily by astrocytes and also by activated microglia. The cell-specific role of each form of apoE in the setting of neurodegeneration has not been determined. We generated P301S Tau/Aldh1l1-CreERT2/apoE3flox/flox or apoE4flox/flox mice. At 5.5-months-of-age, after the onset of tau pathology, we administered tamoxifen or vehicle and compared mice at 9.5-months-of-age. Removing astrocytic APOE4 markedly reduced tau-mediated neurodegeneration and decreased p-tau pathology. Single-nucleus RNA sequencing analysis revealed striking gene expression changes in all cell types with astrocytic APOE4 removal decreasing disease-associated gene signatures in neurons, oligodendrocytes, astrocytes, and microglia. Importantly, removal of astrocytic APOE4 decreased tau-induced synaptic loss and microglial phagocytosis of synaptic elements suggesting a key role for astrocytic apoE in synaptic degeneration.
Keywords: Astrocyte, APOE, tau, neurodegeneration, microglia
eTOC Blurb
Wang et al. demonstrate that removal of astrocytic APOE4 decreases tau-mediated brain atrophy and synaptic loss as well as ameliorating disease-associated gene signatures in multiple cell types. Removal of astrocytic APOE4 even after the onset of neurodegeneration reduces tauopathy and tau-mediated neurodegeneration.
INTRODUCTION
The apolipoprotein E gene (APOE) is the strongest genetic risk factor for late-onset Alzheimer’s disease (AD) with the ε4 allele increasing and the ε2 allele decreasing AD risk relative to the ε3 allele (Holtzman et al., 2012; Strittmatter et al., 1993). Although the mechanisms are not fully elucidated, apoE appears to influence AD at least in part by promoting amyloid-β (Aβ) aggregation and reducing Aβ clearance (Castellano et al., 2011; Huynh et al., 2017; Liu et al., 2017). ApoE also modulates microglial responses to amyloid plaque pathology (Sala Frigerio et al., 2019; Ulrich et al., 2018). Other ways that apoE may facilitate AD or brain injury is via modulating synaptic function (Arendt et al., 1997; Zhao et al., 2020), blood-brain barrier integrity (Bell et al., 2012; Montagne et al., 2020; Zlokovic, 2013), neuronal receptor recycling (Chen et al., 2010), and numerous metabolic pathways, such as lipid transport (Zhao et al., 2017a), glucose metabolism (Drzezga et al., 2005; Wu et al., 2018), and insulin signaling (Geijselaers et al., 2018; Zhao et al., 2017b). ApoE can also affect tauopathy and tau-mediated neurodegeneration (Brecht et al., 2004; Shi and Holtzman, 2018; Zhao et al., 2018). Human tau positron emission tomography (PET) imaging studies found that tau PET burden is highly correlated with cognitive deficits and brain atrophy with APOE-ε4 increasing these associations (Therriault et al., 2020; Weigand et al., 2020). In addition, we have reported in mouse studies that apoE isoforms directly affect tauopathy and tau-mediated neurodegeneration in P301S tau transgenic mice expressing different human apoE isoforms (Shi et al., 2017). Specifically, the expression of apoE4 resulted in a significant increase in the loss of neurons, brain volume, and glial inflammatory responses compared to other apoE isoforms, while the absence of apoE throughout life alleviated neurodegeneration and inflammation.
How tau and apoE together influence tau-mediated neurodegeneration is not clear, although recent data suggest that microglia are required (Mancuso et al., 2019; Shi et al., 2019), despite the main producers of apoE in the brain being astrocytes (Pitas et al., 1987). However, microglia also produce apoE when activated. The role of apoE derived from specific cell types such as astrocytes or microglia on tau pathology, neuroinflammation, and neurodegeneration is not understood, but could differ in function. In a recent study, we found that astrocyte-derived apoE particles are significantly larger in size and are thus contain much more lipid compared to apoE secreted by microglia (Huynh et al., 2019), foreshadowing a differential role and function of apoE derived from these two cell types.
We crossed Aldh1l1-Cre/ERT2 BAC transgenic mice, in which the Aldh1l1 promoter drives expression of an inducible Cre-recombinase specifically in astrocytes, to P301S Tau/apoE3 or apoE4 knockin mice (Srinivasan et al., 2016). Our goal was to determine whether removing astrocytic APOE would affect tau pathology, tau-mediated neurodegeneration, and the inflammatory response.
RESULTS
Tamoxifen administration reduces astrocytic APOE mRNA and protein levels in both TAFE4 and TAFE3 mice
To investigate the effects of astrocyte-specific APOE deletion on tauopathy, we used Aldh1l1-Cre/ERT2 BAC transgenic mice (Srinivasan et al., 2016). We generated P301S Tau/Aldh1l1-Cre/apoE3flox/flox or apoE4flox/flox (TAFE3 or TAFE4, respectively) mice (see Methods). These animals were administered tamoxifen (TAM) to determine whether decreasing astrocytic APOE would reduce tau pathology and neurodegeneration (Figure 1A). To assess the efficacy of TAM treatment, we treated 2-month-old non-tau transgenic littermates (AFE4 and AFE3) with TAM or oil control. Four weeks following injection, we assessed apoE levels in cortical tissue. TAM treatment reduced apoE protein levels by > 80% relative to controls (Figure 1B), showing that most apoE under physiological conditions is derived from astrocytes.
Figure 1. Tamoxifen treatment reduces astrocytic APOE mRNA and protein levels in both TAFE4 and TAFE3 mice.
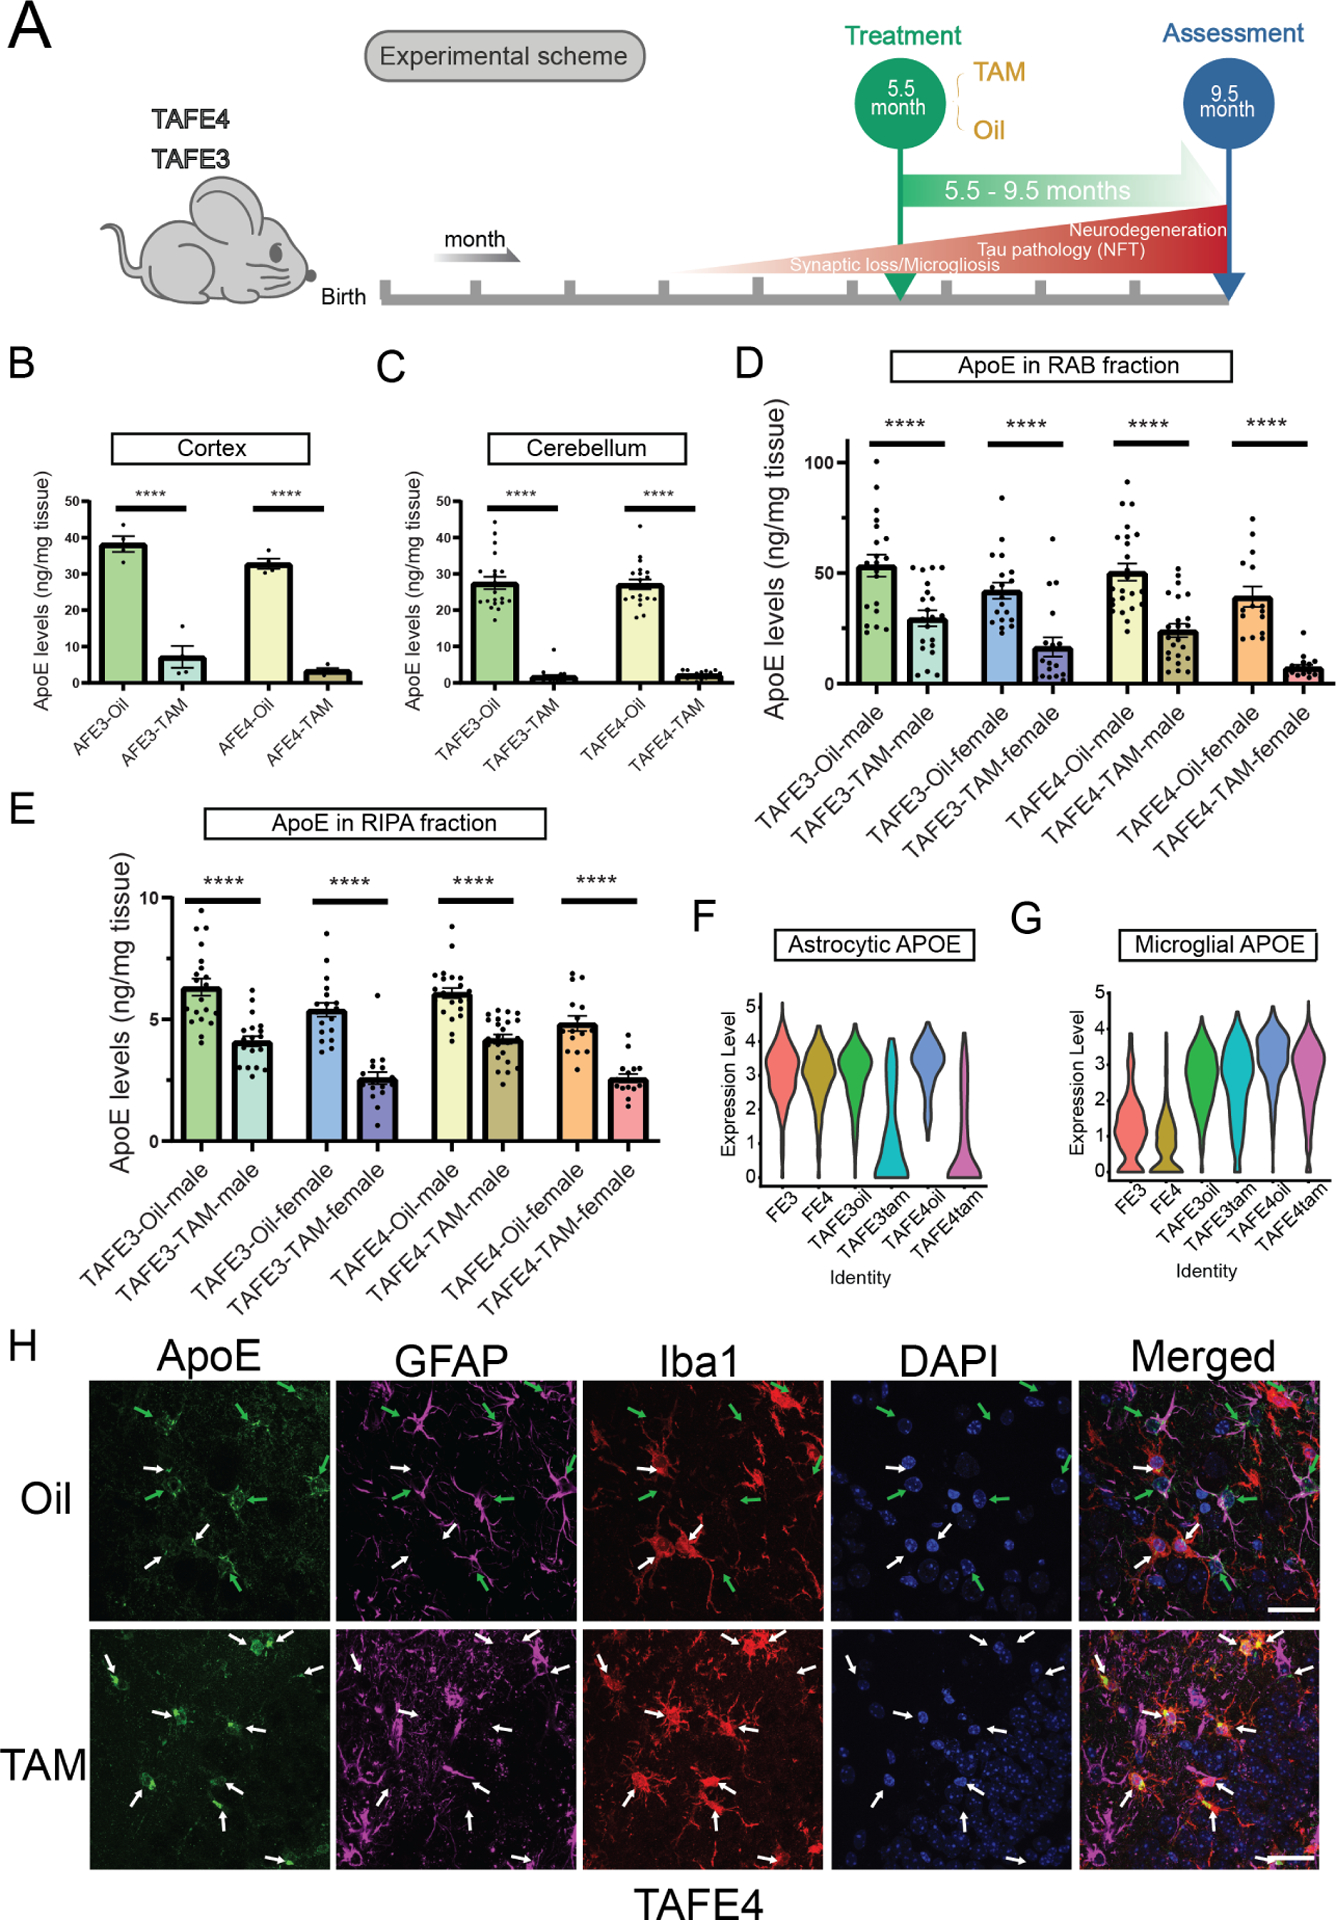
(A) Timeline of tamoxifen treatment in TAFE mice. Neurofibrillary tangle: NFT. (B) RAB-soluble apoE levels in cortical tissue in male AFE mice (n=4). (C) RAB-soluble apoE levels in the cerebellum in male TAFE mice (n=20). (D and E) RAB-soluble (D) and RIPA-soluble (E) apoE levels in cortical tissue assessed in TAFE mice (n=15–24). (F) Violin plots of astrocytic APOE expression (Y-axis, log normalized values). (G) Violin plots of microglial APOE expression (Y-axis, log normalized values). (H) Brain sections from TAFE4 mice treated with oil (top row) or TAM (bottom row) co-stained with ApoE (green), GFAP (magenta), Iba1 (red), and DAPI (blue). Green arrows – apoE expression by astrocyte cells; White arrows – apoE expression by microglia. Scale bar = 25 μm. In (B–E), ****p<0.0001; Two-way ANOVA and Sidak’s post hoc test in (B) and (C); Three-way ANOVA and Sidak’s post hoc test in (D) and (E). Data expressed as mean ± SEM. See also Figure S1 and Table S1.
To assess the effect of astrocyte-specific APOE removal on tau pathology and neurodegeneration, we administered TAM or oil-control to TAFE4 and TAFE3 mice at 5.5 months-of-age, when tau pathology begins to develop and then assessed the mice at 9.5 months of age (~285 days), when mice exhibit robust tau pathology, neurodegeneration, and glial activation (Figure 1A). To validate that TAM treatment reduced apoE in TAFE4 and TFAE3 mice, we measured apoE protein in the cerebellum, a brain region unaffected by tau pathology. RAB (salt-soluble) apoE levels were significantly reduced by >90% (Figure 1C) in the cerebellum, showing that most apoE produced in brain regions not associated with injury is derived from astrocytes in tau transgenic mice. Next, we measured apoE protein in the cortex of tau transgenic mice, a region severely affected by tau pathology. In the presence of tau-mediated neurodegeneration, TAM treatment significantly reduced apoE in the RAB (Figure 1D) and RIPA (detergent soluble, Figure 1E) fractions in both TAFE4 and TAFE3 mice. We confirmed the astrocyte-specific deletion of APOE by performing single-nucleus RNA sequencing (snRNAseq) in hippocampal tissue and observed very low levels of astrocyte APOE mRNA expression in TAM-treated TAFE4 and TAFE3 mice (Figure 1F). There was a trend towards increased microglial APOE expression after astrocytic APOE4 deletion in isolated cells (Figure S1A), which was greatly upregulated in P301S Tau mice. However, snRNAseq data showed no clear effect of astrocytic APOE4 deletion on microglial APOE expression (Figure 1G). We further characterized the expression pattern of apoE in the brain of TAM or oil-treated TAFE mice by co-staining for apoE and markers for astrocytes (GFAP) and microglia (Iba1) (Figure 1H and S1B). As expected, in oil-treated TAFE mouse brain tissue, apoE co-localized with GFAP+ astrocytes and some Iba1+ microglia (Figure 1H and S1B, top row). In contrast, staining in TAM-treated TAFE mice revealed that apoE co-localized with Iba1+ microglia, but not with GFAP+ astrocytes (Figure 1H and S1B, bottom row. Together, our results show that our treatment strategy sufficiently and specifically reduces astrocytic apoE mRNA and protein.
Decreasing astrocytic APOE4 but not APOE3 expression at 5.5-months-of-age reduces brain atrophy and rescues nest-building behavior
We next assessed whether astrocyte apoE affected tau-dependent neurodegeneration. P301S Tau transgenic mice with human APOE4 knocked-in develop significantly more hippocampal and entorhinal cortex/piriform cortex (EC/PC) volume loss than APOE3-expressing mice at this age (Shi et al., 2017). Volumetric analysis of the hippocampus and EC/PC revealed marked hippocampal (~25% – 40%) and EC/PC volume loss (~30% – 50%) in the TAFE3 and TFAE4 mice relative to their volumes observed at 5.5 months-of-age (Figure 2A–2C). TAM-treatment significantly attenuated brain atrophy in both male and female TAFE4 mice, but not in TAFE3 mice (Figure 2A–2C). Importantly, comparing Oil-treated TAFE4 and TAM-treated P301S Tau/apoE4flox/flox (TFE4) mice (which lack the Aldh1l1-Cre/ERT2 transgene in which astrocyte APOE4 is not removed), there was no difference in hippocampal or EC/PC volume (Figure S2A–S2C), which indicates that the week-long TAM treatment in and of itself has no clear long-term effect on tau-mediated neurodegeneration. Additionally, the granule cell layer in the dentate gyrus of the hippocampus was significantly thicker in TAM-treated TAFE4 mice (Figure S2D and S2E). Ventricular volume, which is expanded concomitant with brain tissue atrophy, was also notably reduced in female TAM-treated TAFE4 mice (Figure 2D). TAM-treated TAFE4 female mice also had higher total brain weight, an indication of preserved brain volume, relative to oil-control (Figure 2E). In addition to brain structure alterations, nest-building, an innate mouse behavior, is also sensitive to neurodegeneration in response to tau pathology and is used to evaluate mouse health conditions in response to neurological changes (DeVos et al., 2017). Tamoxifen treatment to ablate astrocytic APOE expression rescued mouse nest-building behavior in TAFE4 mice (Figure 2F). We also assessed plasma protein levels of neurofilament light chain (NFL), a marker of neuro-axonal damage and neurodegeneration (Khalil et al., 2018). We observed a significant reduction in plasma NFL concentration in TAM-treated TAFE4 mice (Figure 2G). Altogether, these results implicate astrocyte-derived APOE4 as playing a major role in facilitating tau-dependent neurodegeneration.
Figure 2. Decreasing astrocytic APOE4 but not APOE3 expression starting at 5.5-months-of-age rescues mouse nest-building behavior and reduces brain atrophy at 9.5 months of age.

(A) Representative Sudan Black staining images of 9.5-month-old TAFE mice. (B–F) Quantification of hippocampal volumes (B), EC/PC volumes (C), ventricular volumes (D), brain weight (E), and nest-building behavior (F). All mice in B–G are 9.5 months of age except the first 2 groups in B–D and F which are at 5.5 months of age. (G) Protein levels of neurofilament light chain (NFL). B–G: TAFE: n=11–24; **p<0.01; *p<0.05; Three-way ANOVA and Sidak’s post hoc test (B–E); Chi-square (F); Three-way ANOVA with Sidak’s post hoc test and unpaired Student’s t-test (G); Data plotted as mean ± SEM. See also Figure S2 and Table S1.
Reducing astrocyte-derived apoE4 decreases phosphorylated tau accumulation
9.5-month-old P301S tau transgenic mice exhibit substantial tau pathology, including elevated levels of insoluble tau, hyperphosphorylated tau, and neurofibrillary tangles (Yoshiyama et al., 2007). We assessed total human tau and phosphorylated tau (pTau) levels in mouse cortical tissue by ELISA after sequential biochemical extraction with RAB, RIPA, and 70% formic acid (FA), containing highly soluble, less soluble, and insoluble tau proteins, respectively (Figure 3A–3F and S3A–S3F). We did not observe a significant effect of TAM treatment on total human tau levels in any of the biochemical fractions (Figure 3A–3C).
Figure 3. Knocking down astrocytic APOE4 expression at 5.5-months-of-age reduces phosphorylated tau deposition.

(A–C) Total cortical tau concentrations in RAB (A), RIPA (B), and FA (C) fractions assessed by ELISA. (D–F) pTau concentrations in RAB fraction (D), RIPA fraction (E), and FA fractions (F) measured by ELISA. (G and H) Representative AT8 hippocampal staining of 9.5-month-old TAFE mice (G) and quantification (H). Scale bar = 500 μm. n=15–24; *p<0.05; Three-way ANOVA and Sidak’s post hoc test; Data expressed as mean ± SEM. See also Figure S3 and Table S1.
Lower levels of pTau and reduced pTau deposition correlate with less neurodegeneration (Shi et al., 2017). Given that astrocytic APOE4 removal significantly attenuated tau-mediated neurodegeneration, we assessed pTau levels in extracts from cortical tissue (Figure 3D–3F). In TAM-treated female TAFE3 and TAFE4 mice, there was a significant reduction of insoluble pTau in the FA fraction and a trend towards less pTau in TAM-treated male TAFE4 mice. After being normalized to total tau levels (Figure S3A–S3C), in TAM-treated female TAFE3 mice, there was a significant reduction of pTau in the RIPA fraction. In addition to biochemical analysis, we performed pTau immunohistochemical staining using the AT8 antibody to assess pathological tau deposition in the hippocampus. TAM treatment reduced AT8 immunoreactivity in female TAFE4, but not in male TAFE4 or in TAFE3 mice. (Figure 3G and 3H, Figure S3D–S3G). Overall, these data indicate that genetic deletion of astrocytic APOE4 significantly decreases pathological tau phosphorylation in females. In comparison, astrocytic APOE3 removal had minimal effect on pTau pathology, which is consistent with the lack of protection on tau-mediated neurodegeneration (Figure 2).
snRNAseq reveals cell-type specific changes regulated by astrocytic APOE removal in tauopathy
In order to obtain an unbiased understanding of cell-type specific transcriptional changes associated with tau pathology and APOE expression, we performed snRNAseq using hippocampal tissue from 9.5-month-old TAFE3 and TAFE4 mice treated with TAM or oil-control, as well as age-matched non-tau transgenic FE3 and FE4 littermates. Following removal of poor-quality nuclei, we obtained transcriptional data for 71,129 nuclei (Table S2) that we then subjected to unsupervised clustering by uniform manifold approximation and projection (UMAP) into 16 distinct clusters. (Cluster 1 – 16) (Figure 4A and S4). Based on the expression of well-known cell-type specific markers, these clusters were categorized into neurons (clusters 1, 3, 4, 6 – 9, 11, 12, 14, and 15), oligodendrocytes (cluster 2), microglia (cluster 5), astrocytes (cluster 10), oligodendrocyte progenitor cells (OPCs) (cluster 13), and choroid plexus epithelial cells (cluster 16) (Figure 4A, 4B, and Table S3).
Figure 4. snRNAseq reveals cell-type specific changes regulated by astrocytic APOE removal in tauopathy.

(A) snRNAseq of hippocampal tissues from 9.5-month-old male mice (n=5 pooled per group). UMAP plot showing 16 distinguishable clusters (1–16) with corresponding cell-types identified using known cell markers. (B) UMAP plot split by experimental groups. (C) Relative frequency of cell clusters in each experimental group. Cluster 1 (black) starts at bottom of graph with increasing numbers going bottom to top. See also Figure S4, Table S2, and S3.
Cell proportion analysis for each experimental group showed distinct effects of tau pathology and astrocytic APOE removal on gross hippocampal cell-type composition. Specifically, certain neuronal populations (clusters 1 and 3) were strongly reduced in the presence of tau pathology and neurodegeneration (Figure 4B and 4C). This reduction was attenuated in TAM-treated animals (Figure 4B and 4C), suggesting a protective effect of astrocytic APOE removal on neurons. Compared to astrocytic APOE3, removal of astrocytic APOE4 had a qualitatively greater effect in altering the proportion of cells in clusters 1 and 3, indicating a stronger protective effect of astrocytic APOE4 removal in these neuronal clusters. Furthermore, neuronal cluster 6 was drastically expanded in P301S tau transgenic mice (Figure 4B and 4C), an expansion that was attenuated by tamoxifen treatment, suggesting a hippocampal neuronal gene signature associated with tau pathology. As expected, we also noted a robust expansion in the microglia population (cluster 5) in mice with tau pathology (Figure 4B and 4C).
Identification of distinct neuronal subpopulations associated with tau pathology and astrocytic APOE removal
The dramatic expansion of an excitatory neuron population in Cluster 6 in tau transgenic mice suggested the possibility that these nuclei could reflect a unique transcriptional profile for neurons with tau pathology, particularly since the relative proportion of nuclei in Cluster 6 was reduced in mice lacking astrocytic APOE3 and APOE4 (Figure 4B and 4C). Gene set enrichment analysis (GSEA) for marker genes in cluster 6 found several significantly enriched pathways, including KEGG pathways for spliceosome and ubiquitin-mediated proteolysis and Hallmark pathways for DNA repair (Figure 5A). Specific marker genes for cluster 6 included RNA binding proteins (RBPs) Arpp21 and R3hdm1 (Figure S4, S5A, and Table S3) and several genes (Rorb, Cux1, Cux2, and Mef2c) that are typically repressed in hippocampal pyramidal neurons by Zbtb20 and are normally expressed within cortical neurons (Figure S4, S5B, and Table S3) (Nielsen et al., 2014; Rehfeld et al., 2018). Likewise, gene expression analysis using qPCR on mRNA from mouse hippocampal tissue found significant upregulation of Rorb, Cux2, Arpp21, and R3hdm1 in oil-treated TAFE4 compared to TAM-treated TAFE4 mice (Figure 5B–5E). In adult mice, Cux1 and Cux2 are expressed in upper cortical layer neurons, but are also involved in regulating neurogenesis, as is Mef2c. We investigated Rorb protein expression in the hippocampus. In non-transgenic FE4 hippocampus, Rorb staining was almost absent (Figure S5C, top row). In contrast, in oil-treated TAFE4 mice, Rorb staining was strong in both neurons and astrocytes (Figure S5C, middle row). However, in TAM-treated mice, immunofluorescent staining of Rorb was co-localized with GFAP-positive astrocytes, but not with NeuN-positive neurons (Figure S5C, bottom row). Together, these findings suggest that neuronal expression of Rorb in the hippocampus is dramatically increased in the presence of tau pathology, and that removal of astrocytic APOE4 attenuates neuronal Rorb expression, consistent with an association between this distinct neuronal subpopulation and tau pathology. Interestingly, a recent study found that Rorb+ excitatory neurons exhibited selective vulnerability in AD (Leng et al., 2021).
Figure 5. Identification of distinct neuronal subpopulations associated with tau pathology and astrocytic APOE removal.

(A) Hallmark and KEGG pathways in Cluster 6. (B–E) Marker genes Rorb (B), Arpp21 (C), Cux2 (D), and R3hdm1 (E) from Cluster 6 verified by qPCR in female mice. FE: n=5; TAFE: n=8 per group; ***p<0.001; **p<0.01; Two-way ANOVA and Sidak’s post hoc test; Data expressed as mean ± SEM. (F) Brain sections from TAFE4-Oil (top row), TAFE4-TAM (second row), TAFE3-Oil (third row), TAFE3-TAM (fourth row), and AD human patient (bottom row) co-stained with Arpp21 (red), and AT8 (Green). Scare bar = 25 μm. See also Figure S5, Table S1, and S3.
Accumulating evidence has shown that RBPs can potentially co-localize with tau protein and promote its aggregation (Wolozin and Ivanov, 2019). Therefore, we investigated potential interactions between Arpp21, an RBP enriched in Cluster 6, and hyperphosphorylated tau detected by AT8 staining (Figure 5F). In both TAFE mouse (Figure 5F, top row, and third row) and AD human brain tissue (Figure 5F, bottom row), Arpp21 co-localized with AT8 staining. Interestingly, in TAM-treated mice, while only minimal neuronal Arpp21 staining was detected in TAFE4 mice (Figure 5F, second row), no noticeable reduction of neuronal Arpp21 staining was observed in TAFE3 mice (Figure 5F, fourth row). This suggests that P301S Tau mice, in the presence of human apoE4, respond to a greater extent with astrocytic APOE removal compared to astrocyte removal of the apoE3 isoform. Notably, apoE was not co-localized with intraneuronal AT8 staining (Figure S5D), indicating that the co-aggregation of Arpp21 and AT8 is potentially mediated by an indirect effect of astrocytic APOE.
Astrocytes shift from activated to a more homeostatic signature after astrocytic APOE4 removal
Numerous human and rodent model studies have highlighted the important role of astrocytes in AD and tau pathology, with astrocyte activation occurring prior to large scale NFT formation, synaptic dysfunction, and neuronal loss (Bussian et al., 2018; Shi et al., 2017; Yoshiyama et al., 2007). The amount of astrogliosis is also highly correlated with mouse brain volume in a mouse model of tauopathy (Shi et al., 2017). Cluster 10, containing astrocytic nuclei, was rescaled and re-clustered to identify three sub-clusters (Astro1–3) of astrocytes (Figure 6A). Tau pathology resulted in a strong shift from a homeostatic astrocyte subcluster – Astro1 (Ntm, Dclk1, Slc1a3, and Gria2) to a robust expansion of activated astrocyte subcluster – Astro2 (Cst3, Gfap, Vim, and Clu) (Figure 6B, 6C, S6A, and Table S4). A third, small subcluster, Astro3, was enriched for genes associated with DNA transcriptional activity (Id1, Id3, and Mat2a) as well as Cdkn1a, a marker of senescence (Figure S6A and Table S4). Deleting astrocyte APOE slightly increased the proportion of homeostatic astrocytes and reduced the proportion of activated astrocytes, consistent with a protective effect of APOE removal (Figure 6B). In addition, astrocytic APOE4 removal resulted in a larger proportion of alterations compared to APOE3, consistent with a stronger protective effect associated with astrocytic APOE4 removal (Figure 6B). Multiple top upregulated pathways in Astro2 were identified by GSEA, including oxidative phosphorylation, MYC targets V1, ribosome function, as well as adipogenesis (Figure S6B). We verified upregulation of a subset of Astro2 genes (Gfap, Clu, Vim, Prdx1, and Prdx6) in hippocampal tissue by qPCR and found these genes were upregulated in the presence of tau pathology and significantly decreased after removing astrocytic APOE4 (Figure 6D–6F, S6C, and S6D).
Figure 6. Tau-dependent changes in astrocyte transcriptional profile are attenuated by deletion of astrocytic APOE.

(A) UMAP plot of re-clustered astrocyte population showing 3 distinguishable clusters (Astro1–3). (B) Relative frequency of all astrocyte clusters per genotype and treatment. (C) Volcano plots showing differentially expressed genes (DEGs) in Astro1 vs. Astro2. (D–F) Marker genes GFAP (D), Clu (E), and Vim (F) from Astro2 verified by qPCR in female mice. FE: n=5; TAFE: n=8 per group. (G and H) Representative GFAP-stained hippocampal images of 9.5-month-old TAFE mice that received different treatments (G) with quantification (H). Scale bar = 500 μm; n=15–24. (I and J) Brain sections from female TAFE4-Oil (upper panel), and TAFE4-TAM (bottom panel) co-stained with AQP4 (green) and GFAP (red) (I) with quantification of coverage in hippocampus (J). Scale bar = 200 μm; n=15–16. **p<0.01; *p<0.05; Two-way ANOVA and Sidak’s post hoc test (D–F); Three-way ANOVA and uncorrected Fisher’s LSD (H); Student t-test (J); Data expressed as mean ± SEM. See also Figure S5, Table S1, and S4.
Next, we confirmed astrocytic tauopathy-associated signatures at the protein level by immunohistochemical and immunofluorescent staining (Figure 6G–6J, S6E–S6G). TAM-treated TAFE4 females showed a significant reduction in GFAP coverage in the hippocampus compared to oil-treated animals (Figure 6G and 6H). There was also a trend towards reduced GFAP coverage in TAM-treated TAFE3 males. Importantly, GFAP coverage in TAFE4 female hippocampus was strongly negatively correlated with hippocampal volume (Figure S6E).
Aquaporin-4 (Aqp4) is upregulated in the rTg4510 model of tauopathy, but exhibits reduced polarization towards astrocytic endfeet in reactive astrocytes in response to tau pathology (Harrison et al., 2020). While TAM treatment did not affect Aqp4 coverage in AFE4 mice (Figure S6F), we observed significantly decreased Aqp4 immunoreactivity in TAFE4 hippocampus after knocking down astrocytic APOE4 (Figure 6I and 6J) and more specific co-localization with the vasculature in TAM-treated TAFE4 mice (S6G), suggesting that increased Aqp4 expression and polarization was partially restored after astrocytic APOE4 removal. Combined, these results indicate that after astrocytic APOE4 removal, astrocyte activation is reduced, which may contribute to the protective effect on tau-mediated neurodegeneration following astrocytic APOE4 removal.
Oligodendrocytes exhibit a reactive state in the presence of tauopathy that is attenuated with astrocytic APOE deletion
Dysfunction of oligodendrocytes, the myelinating cells of the CNS, may contribute to AD pathogenesis (Nugent et al., 2020; Zhou et al., 2020). Therefore, we also assessed oligodendrocyte populations in our snRNAseq dataset. One major oligodendrocyte cluster (cluster 2) was identified from the original dataset and further rescaled and re-clustered into two sub-clusters (Oligo1 and 2) (Figure 4, S7A and Table S5). In P301S mice, there was a strong shift towards oligodendrocytes expressing C4b, and H2–d1, as well as apparent upregulation of more broadly expressed oligodendrocyte genes such as Ptgds, Neat1, and Apod (Oligo2) (Figure S7A–S7C). A similar C4b and H2-D1-expressing oligodendrocyte population was recently described in mouse models of Aβ pathology (Nugent et al., 2020; Zhou et al., 2020). The Oligo2 subcluster was modestly reduced after astrocytic APOE removal, suggesting downregulation of these genes may implicate a protective effect of astrocytic APOE removal.
We verified the expression of C4b at the protein-level by immunofluorescent staining (Figure S7D). Co-staining of C4b and Olig2 showed that while C4b expression was not detected in non-tau transgenic FE4 mouse brain tissue, oligodendrocyte expression of C4b was clearly observed in the presence of tauopathy. Expression of C4b potentially activates the complement pathway, which may induce prolonged inflammation throughout the course of tauopathy. The downregulation of genes from Oligo2 suggests a protective effect of astrocytic APOE removal on oligodendrocyte health.
Genetic deletion of astrocytic APOE4 decreases DAM/MGnD genes
Microglia play a crucial role in tau pathology and tau-mediated neurodegeneration. Neuroinflammation is one of the hallmarks of tauopathy-linked neurodegeneration, and microglia are a major driving force for this biological process (Shi et al., 2017; Yoshiyama et al., 2007). Microglial depletion from tauopathy mouse models strongly inhibits tau-induced neuronal loss and completely blocks tau-mediated brain atrophy (Mancuso et al., 2019; Shi et al., 2019). Therefore, we investigated whether the attenuated neurodegeneration after astrocytic APOE4 removal was associated with reduced microglial activation in our snRNAseq data. Reclustering of the microglia cluster (Cluster 5) yielded three sub-clusters (Micro1–3) (Figure 7A and Table S6). Micro1 was enriched for the disease-associated microglia (DAM) (Keren-Shaul et al., 2017)/microglial neurodegenerative phenotype (MGnD) (Krasemann et al., 2017) and was dramatically expanded in TAFE3 and TAFE4 mice compared to FE3 and FE4 (Figure 7B). Top enriched genes included APOE, H2–d1, H2–k1, Spp1, and Cd74 (Figure 7C, S8A, and S8B). Micro2 was enriched with genes typically considered to be homeostatic, including Selplg, Cst3, P2ry12, and Hexb (Figure 7C, and S8A). There was a strong switch from a homeostatic state to a DAM/MGnD state in the presence of tau pathology (Micro2 to Micro1). A third cluster (Micro3) was enriched for markers of peripheral macrophages, and while small, did not appear to vary in abundance with either tau pathology or astrocytic APOE expression (Figure 7B and S8A). Removal of astrocytic APOE did not strongly influence the overall cell-type composition of the microglial clusters (Figure 7B). GSEA revealed several top upregulated pathways in Micro1, including ribosome function, oxidative phosphorylation, mTORC1 signaling, and interferon-γ response (Figure 7D). We then assessed gene expression of a subset of homeostatic and DAM/MGnD genes in hippocampal tissue by immunofluorescence staining and qPCR (Figure 7E–7K, S8C, and S8D). There was a decrease in P2ry12 immunostaining (homeostatic gene) (Butovsky et al., 2014) in oil-treated TAFE3 and TAFE4 mice, which was significantly increased following TAM treatment (Figure 7E and 7F). We also detected a strong upregulation in MHC-II and Spp1 gene expression in the presence of tau pathology, which was significantly attenuated by astrocytic APOE4 removal (Figure 7G–7I, S8C, and S8D). There was also a marked increase in immunostaining for the DAM/MGnD gene Clec7a in TAFE3 and TFAE4 microglia, which was significantly decreased with astrocyte APOE4 removal (Figure 7J and 7K). Thus, while we did not detect major differences in microglial subcluster proportions, astrocytic removal of APOE decreased the expression of several MgnD/DAM genes, particularly in TAFE4 mice.
Figure 7. Tau and astrocyte-APOE dependent changes in microglial activation.

(A) UMAP plot of re-clustered microglial population showing 3 distinguished clusters (Micro1 – 3). (B) Relative frequency of all microglial clusters in each experimental group. (C) Volcano plots showing DEGs in Micro1 vs. Micro2. (D) Hallmark and KEGG pathways enriched in Micro1. (E) P2ry12 immunofluorescent staining in representative TAFE4-Oil vs. TAFE4-TAM treated mice. Scale bar = 50 μm. (F) Quantification of % area of hippocampus covered by P2ry12 staining in FE3, FE4, TAFE3 and TAFE4 mice. FE: n = 4; TAFE: n = 15–19. (G–I) Verification of marker genes H2-Aa (G), H2-Eb1 (H), and SPP1 (I) from Micro1 (activated cluster) with qPCR in female mice. FE: n=5; TAFE: n=8 per group. (J) Clec7a immunofluorescent staining in representative TAFE4-Oil vs. TAFE4-TAM treated mice. Scale bar = 50 μm. (K) Quantification of % area of hippocampus covered by Clec7a staining in FE3, FE4, TAFE3 and TAFE4 mice. FE: n = 4; TAFE: n = 15–19. ***p<0.001, **p<0.01, *p<0.05; Two-way ANOVA and Sidak’s post hoc test (F–I, K); Data expressed as mean ± SEM. See also Figure S8, Table S1 and S6.
Microglial phagocytosis of synapses is attenuated by removal of astrocytic APOE4
Along with overall brain atrophy, P301S mice exhibit decreased synaptic density and increased microglial engulfment of synaptic material. Recently, we reported that microglial engulfment of synapses in P301S mice was reduced in mice that expressed AD-associated TREM2 variants (Gratuze et al., 2020). Previous in vitro and in vivo studies suggested a role for apoE in mediating TREM2-dependent phagocytosis of apoptotic neurons (Atagi et al., 2015; Krasemann et al., 2017). We reasoned that astrocyte-derived apoE might contribute to decreased synaptic density and microglial engulfment of synaptic material in the presence of tau pathology. To investigate whether reduced tauopathy and neurodegeneration in TAFE4 mice would correlate with improved synaptic integrity, we quantified the PSD-95 puncta coverage in EC/PC areas (Figure 8A and 8B). Immunofluorescent staining of PSD-95 revealed increased PSD-95 puncta in TAFE4 mice after knocking down astrocytic APOE4 (Figure 8A and 8B). Western blot analysis of PSD-95 levels also showed significantly greater PSD-95 protein expression after APOE4 removal from astrocytes (Figure 8C and 8D). We hypothesized that phagocytosis of synaptic material by microglia contributed to synaptic loss. Therefore, we quantified CD68 coverage, a microglial phagocytic and lysosomal marker, as well as the co-localization of PSD-95 within CD68 positive lysosomal vesicles (Figure 8E–8I). We observed a significant decrease in CD68 coverage in TAM-treated TAFE4 mice and TAM-treated TAFE3 female mice (Figure 8E and 8F). Furthermore, in TAM-treated TAFE4 mice, the volume of CD68 positive lysosomal vesicles (Figure 8G and 8H) containing PSD-95 puncta (Figure 8G and 8I) was significantly reduced compared to oil-treated controls. Taken together, these results demonstrate that astrocyte-derived apoE4 contributes to microglial-dependent removal of synapses in the presence of tauopathy.
Figure 8. Reduction of synaptic loss by microglial engulfment after removal of astrocytic APOE4.

(A) Representative PSD-95 puncta staining in 9.5-month-old TAFE female mice in EC/PC. (B) Quantification of PSD-95 puncta using Imaris. FE4: n=2; TAFE4: n=14–17. (C) Western blot detection of PSD-95 and α-tubulin protein levels from female hippocampal tissue. (D) Quantitative analysis of PSD-95 expression after normalized to α-tubulin (n=7 per group). (E and F) Representative CD68 staining images of 9.5-month-old TAFE mice that received different treatments (E) with percent area covered in hippocampus (F). n=15–24; Scale bar = 500 μm. (G) Representative confocal images (upper panel) and relative 3D surface rendering (bottom panel) showing volume reconstruction of Iba1 (white), CD68 (green), and engulfed PSD-95 puncta (red), detected within microglial CD68 positive vesicles in female hippocampus. Scale bar = 5 μm. (H) CD68 volume normalized to Iba1 volume in hippocampal area. (I) Quantification of engulfed PSD-95 puncta within CD68 positive vesicles per microglial. ****p<0.0001; **p<0.01; *p<0.05; Student t-test (B, D, H, and I); Three-way ANOVA and Sidak’s post hoc test (F); Data expressed as mean ± SEM. See also Table S1.
Discussion
In the CNS, under basal conditions, astrocytes produce the majority of apoE. However, in the setting of brain injury or neurodegeneration, APOE expression is strongly upregulated in microglia (Krasemann et al., 2017). Since apoE4 strongly exacerbates tauopathy and tau-mediated neurodegeneration in P301S Tau transgenic mice and the absence of apoE throughout life abrogates the majority of the severe brain damage that occurs in this model, we sought to understand the role of apoE3 and apoE4 produced by astrocytes (Shi et al., 2019; Shi et al., 2017). Genetic deletion of astrocytic APOE4 after the onset of tau pathology strongly attenuated neurodegeneration as reflected by a significant decrease in brain atrophy, neuronal loss, synaptic density, p-tau pathology, and improved nesting behavior. In addition, tau pathology was associated with strong gene expression changes in neurons, astrocytes, microglia, and oligodendrocytes, and some of these changes were partially attenuated with apoE4 reduction. Interestingly, in addition to relative synapse preservation with astrocyte apoE4 reduction, there was a significant decrease in synaptic phagocytosis by microglia, suggesting a role for astrocytic apoE in modulating this process. These results suggest a specific role of astrocyte-apoE in tau-mediated neurodegeneration and that lowering apoE4 even after neurodegeneration begins could be a potential treatment strategy to slow neuronal and synaptic loss and preserve function in AD and in primary tauopathies.
In both AD and primary tauopathies, the accumulation of pathological forms of tau is closely linked with brain atrophy, neuronal and synaptic loss, and cognitive and functional decline linked to the location of these changes (Bejanin et al., 2017; La Joie et al., 2020; Petersen et al., 2019). In the P301S Tau mouse model, pathological tau accumulates in synaptic regions, and apoE and microglia are required for tau-mediated neurodegeneration. Different components of complement, including C1q and C3a receptor also play a role in mediating tau-induced injury (Litvinchuk et al., 2018; Mancuso et al., 2019; Shi et al., 2019; Shi et al., 2017; Wu et al., 2019). The C3a receptor is expressed by microglia and C1q-mediated injury is blocked by antibodies to C1q, suggesting neuroinflammation-mediated injury likely involves a multicellular response, an important component of which is elevated microglial-mediated synaptic phagocytosis (Dejanovic et al., 2018). Such phagocytosis can be stimulated by opsonins at damaged synapses, such as C1q (Dejanovic et al., 2018; Gratuze et al., 2020; Hong et al., 2016; Stevens et al., 2007). Our data that selective removal of astrocyte-apoE4 reduces microglial-mediated phagocytosis suggests the possibility that astrocyte-secreted apoE4, either alone or together with other molecules such as C1q, could also serve as an opsonin for specific microglia receptors. Candidates for such receptors include TREM2, members of the LDLR family, and others (Atagi et al., 2015; McQuade et al., 2020).
While our current study supports an important role for astrocytic apoE4 in tau-mediated neurodegeneration, several studies suggest microglial apoE may also play a key role in the setting of CNS injury and disease. In the context of CNS damage resulting from Aβ, tau, SOD-1, or other pathologies, apoE is strongly upregulated in microglia coincident with the DAM or MGnD phenotype (Butovsky et al., 2015; Keren-Shaul et al., 2017; Krasemann et al., 2017; Parhizkar et al., 2019; Shi et al., 2017). Selective removal of APOE from microglia attenuated facial motor neuron death after axotomy, indicating that microglial apoE expression plays a key role in promoting the DAM/MGnD transcriptional state (Krasemann et al., 2017). It is possible that the effect of lowering astrocytic apoE4 resulted in neuroprotective effects via microglial modulation. We previously showed and again found that in the presence of apoE4 or apoE3, there was marked neurodegeneration and elevations in DAM/MGnD gene expression in P301S Tau transgenic mice which was greater with apoE4 than with apoE3. Genetic deletion of astrocytic APOE4 but not APOE3 was significantly neuroprotective in P301S Tau mice; however, it should be noted that crossing P301S Tau mice to Apoe KO mice or eliminating microglia resulted in no significant evidence of neurodegeneration/brain volume loss by 9 months of age relative to non-Tau transgenic mice (Shi et al., 2019; Shi et al., 2017). In contrast, even though astrocytic APOE4 deletion was neuroprotective resulting in reduced brain volume loss in regions such as hippocampus by ~25%, P301S Tau mice with genetic deletion of astrocytic APOE4 and P301S/APOE3 mice still displayed brain atrophy with ~25% smaller hippocampi relative to their volumes observed at 5.5 months-of-age (Figure 2). We found that astrocytic APOE4 removal had a stronger effect than astrocytic APOE3 removal on DAM/MGnD gene expression (e.g. Clec7a) and that this correlated with the observed neuroprotection. These results suggest that the stronger suppression of DAM/MGnD gene expression accounts in some way for the differential effects of apoE4 vs. apoE3 on neuroprotection.
While our data clearly demonstrate that astrocyte-produced apoE4 plays an important role in tau-mediated neurodegeneration, it is also likely that microglial apoE plays a role in the setting of different CNS diseases and pathologies that can be defined by specifically deleting microglial apoE in model systems. There is a strong reason to think that the role and function of apoE will differ based on the cell type by which it is produced. Cells secrete apoE in lipidated lipoprotein particles. In the CNS, apoE is only present in HDL-like particles, and the size and form of these particles are dependent on the lipid-transport protein ABCA1 (Hirsch-Reinshagen et al., 2004; Wahrle et al., 2004). Microglia secrete apoE in smaller, lipid-poor lipoproteins (Huynh et al., 2019). In addition, apoE, particularly in microglia, plays a key role in preventing accumulation of cholesterol ester species both normally and in the setting of demyelination in a TREM2-dependent fashion (Nugent et al., 2020). Understanding the structure-function relationship of apoE lipoprotein particles derived from different cell types will be key in understanding cell-type specific effects of APOE in disease.
Tau pathology resulted in prominent gene expression changes in different cell types in our snRNAseq data, and the magnitude of those changes was influenced by suppressing astrocytic APOE3 or APOE4 expression. In the presence of tauopathy we detected a robust expansion of a unique subset of excitatory neurons (Cluster 6) which was attenuated in mice lacking astrocytic APOE. A noticeable feature of this cluster was an enrichment in genes associated with RNA processing, particularly the enrichment of RBPs such as Arpp21 and R3hdm1. RBPs are a class of proteins responsible for the regulation of mRNA maturation and translation and are increasingly implicated in multiple neurodegenerative diseases, including tauopathies (Wolozin and Ivanov, 2019). Fibrillar tau can reportedly interact with several RBPs (Apicco et al., 2018; Drummond et al., 2020; Hsieh et al., 2019). Tau-RBP interactions disrupt RNA splicing resulting in gene dysregulation and neurotoxicity (Apicco et al., 2018; Bai et al., 2013; Hsieh et al., 2019). We found that Arpp21, an RBP associated with stress granule formation, exhibited co-localization with aggregated p-tau in P301S mice and in human AD brain tissue. In addition, our GSEA for Cluster 6 identified significant enrichment of spliceosome and DNA repair pathways, supporting the idea that tau pathology is associated with disruption of gene transcription and translation. How astrocyte-derived apoE contributes to tau-RBP binding and RNA dysregulation is unclear. Thus, apoE may play an isoform-specific role in mediating tau-dependent RNA dyshomeostasis.
We identified groups of homeostatic and activated astrocyte genes associated with tau pathology and astrocytic APOE removal. The presence of tau pathology resulted in an expansion of a GFAP+ astrocyte population (Astro2), which appeared to be attenuated by removal of astrocytic APOE. The gene expression profile of Cluster 2 was remarkably similar to that described for GFAP+ astrocytes from the 5xFAD model of Aβ pathology, including enrichment of Clu, Cst3, metalothioneins (Mt1 and Mt3), and peroxiredoxins (Prdx6) (Habib et al., 2020; Nugent et al., 2020). GSEA analysis identified enrichments in pathways pertaining to oxidative phosphorylation, suggestive of an increase in overall metabolic activity within astrocytes. Proteomic analysis of AD brain identified a glial metabolism correlated gene network that was significantly correlated with disease severity. Several of the hub proteins in this glial metabolism network (Cd44, Prdx1, Ldhb, Pkm, Gapdh) were also significantly enriched in Astro2 (Johnson et al., 2020). A similar enrichment in oxidative phosphorylation pathways was observed in the DAM/MGnD-like Micro1 cluster. Whether an increase in glial oxidative phosphorylation contributes to neurodegeneration, and how metabolism may be influenced by apoE is unclear.
Predictably, our snRNAseq data show that tau pathology increased the overall proportion of microglial nuclei and promoted a profound switch from a homeostatic state to a DAM/MGnD state (Micro1). While the removal of astrocytic APOE did not grossly affect the overall homeostatic-DAM/MGnD proportions, removal of particularly astrocytic APOE4 did lower the expression of DAM/MGnD genes such as Clec7a and increased the expression of the homeostatic marker P2ry12. In studies of microglial activation in amyloid models, MHC-II and Spp1 were elevated in an advanced activated state (activated response microglia (ARM)) that corresponded with high levels of Apoe expression (Krasemann et al., 2017; Sala Frigerio et al., 2019). This subset of microglia was also enriched for several genetic risk factors for AD, including Trem2, and in the case of amyloid may exert a protective role in mitigating amyloid-induced damage (Sala Frigerio et al., 2019). On the contrary, removal of astrocytic APOE, which exerted protective effects in P301S mice, reduced expression of genes associated with ARMs, such as Spp1. This further supports a potentially dichotomous role for microglial responses, with Apoe and Trem2-dependent functions being protective in response to amyloid, but harmful in the presence of intracellular tau pathology (Gratuze et al., 2020; Shi et al., 2017; Ulrich et al., 2018). An additional similarity between glial responses to tau and amyloid that emerged from our snRNAseq analysis was the identification of a unique subcluster of oligodendrocytes in P301S mice. The presence of tauopathy led to a dramatic increase in oligodendrocyte expression of C4b and H2–D1. C4b+/H2–D1+ oligodendrocytes have also been observed in models of amyloid pathology (Nugent et al., 2020; Zhou et al., 2020). Expression of C4b may be involved with other complement pathway genes in inducing prolonged inflammation and increasing the activity of microglial-dependent phagocytosis. The modest reduction of these genes in TAM-treated mice suggests another mechanism by which protection may be afforded by astrocytic APOE removal.
In sum, astrocyte-derived apoE4 contributes importantly to tau-mediated neurodegeneration in a mouse model of tauopathy and removal of astrocyte APOE4 is associated with decreased synaptic phagocytosis by microglia as well as with decreases in several diseased linked pathways in multiple cell types.
STAR★Methods
RESOURCE AVAILABILITY
Lead contact
Further information and requests for resources and reagents should be directed to and will be fulfilled by the Lead Contact, David M. Holtzman (holtzman@wustl.edu).
Material availability
This study did not generate new unique reagents.
Data and code availability
Mouse snRNA-seq data that support the findings of this study have been deposited in the Gene Expression Omnibus (GEO) database with accession number GSE164507. Further data and code supporting the findings of this study are available from the corresponding authors on request.
EXPERIMENTAL MODEL AND SUBJECT DETAILS
Animals
P301S Tau transgenic mice (Stock No. 008169, Jackson Laboratories) harbors 1N4R tau overexpressing the human P301S tau mutation, driven by the mouse prion protein promoter. These mice have been backcrossed to C57BL/6 mice (Stock No. 027, Charles River) for more than 10 times. Human apoE knock-in mice, apoE3flox/flox and apoE4flox/flox (FE3 and FE4, respectively), were generated by replacing the mouse genomic sequence from the translation initiation codon in exon 2 to the termination codon in exon 4 with its human counterparts flanked by loxP sites (Huynh et al., 2019). Aldh1l1-Cre/ERT2 mice were purchased from Jackson Laboratories (Stock No. 031008). To generate P301S Tau/apoE3flox/flox or apoE4flox/flox mice (TFE3 or TFE4, respectively), we crossed P301S Tau transgenic mice with FE3 or FE4 for several generations. Similarly, we generated Aldh1l1-Cre/ERT2/apoE3flox/flox or apoE4flox/flox mice (AFE3 or AFE4, respectively) by crossbreeding Aldh1l1-Cre/ERT2 mice to FE3 or FE4 for several generations. Then we crossed TFE3 or TFE4 mice to AFE3 or AFE4 mice to produce P301S Tau/Aldh1l1-Cre/apoE3flox/flox or apoE4flox/flox (TAFE3 or TAFE4, respectively). Finally, we crossed TAFE3 or TAFE4 mice to FE3 or FE4 mice to produce experimental mice. All P301S Tau transgenic mice involved in the final analysis were obtained from the same generation. Littermates of the same sex were randomly assigned to experimental groups. The sex of animals in each specific experiment can be found in the corresponding figure legends. All animal procedures and experiments were performed under guidelines approved by the Institutional Animal Care and Use Committee (IACUC) at Washington University School of Medicine. All of the phenotyping and data analysis were accomplished by researchers who were completely blind to the genotype of the mice.
Human AD tissues
All participants gave prospective pre-mortem written consent for their brains to be banked and used for research. Patient demographics can be found in Table S7.
METHOD DETAILS
Volumetric analysis
The left hemispheres were fixed by 4% paraformaldehyde for overnight and then sunk in 30% sucrose for at least 24 h. Serial free-floating coronal sections (50 μm thickness) were cut on a Leica SM2010 Sliding Microtome. Volumetric analysis of the hippocampus, EC/PC, and ventricle was performed via stereological methods by assessing sections spaced 300 μm starting from bregma −1.3 mm to bregma −3.1 mm (6 – 7 sections per mouse depending on the severity of brain atrophy). All sections were mounted, completely dried, then rinsed in water for 1 min, and stained with 0.1% Sudan black in 70% ethanol at room temperature for 20 min, then washed in 70% ethanol 3 times – for 50 sec each. Finally, the sections were washed in Milli-Q water 3 times – for 10 min each and coverslipped with Fluoromount-G slide mounting medium. Slides were scanned using Hamamatsu’s Nanozoomer microscope at 20X magnification. Hippocampus, EC/PC, and ventricles were traced using the NDP.view 2. The formula for the volumetric calculation was volume = (sum of area) * 0.3 mm (Shi et al., 2017).
Neuronal layer thickness measurement
Two sections, corresponding approximately to bregma coordinates −2.7 and −3.0 mm, were selected for cresyl violet staining. Sections were first incubated with 0.25% cresyl violet solution for 5 min, then rinsed in phosphate-buffered saline (PBS) solution for a few seconds to remove excess stain, followed by dehydration in series increasing concentration of ethanol solutions (ranging from 50% to 100%), and finally saturated with xylene solution for 2 times, 4 min each. Slides were coverslipped by cytoseal60 and scanned using Hamamatsu’s Nanozoomer microscope at 20X magnification. Images were analyzed by using the NDP.view 2. Quantification of the thickness of the dentate granular cell layer was carried out by drawing a scale line crossed the cell layer at two areas in both sections and getting the average value.
Immunohistochemistry
Two hippocampal-containing sections (300 μm spaced), were selected for AT8-biotinylated, GFAP-biotinylated, Iba1, and CD68 Immunohistochemical staining. Sections were washed in Tris-buffered saline (TBS) buffer for 3 times, 5 min each. After washing, sections were incubated in 0.3% hydrogen peroxide in TBS for 10 min at room temperature in order to block endogenous peroxidase activity, followed by 3 times TBS washing, 5 min each. After washing, sections were blocked by 3% milk in TBS with 0.25% Triton X-100 (TBSX) for 1 h at room temperature in order to prevent non-specific antibody binding. Then sections were incubated at 4°C overnight with AT8-biotinylated antibody (mouse monoclonal, 1:500), GFAP-biotinylated antibody (mouse monoclonal, 1:200), and CD68 (rat monoclonal, 1:500), respectively. The next day, after 3 times washing with TBS, sections, incubated with non-biotinylated Iba1 and CD68 primary antibodies, were incubated with goat anti-rabbit biotin conjugated secondary antibody and goat anti-rat biotin conjugated secondary antibody, respectively for 1 h at room temperature. After 3 washes in TBS, all sections were kept in VECTASTAIN Elite ABC-HRP Kit for 1 h at room temperature, followed by 3 times washes in TBS. Finally, sections were developed and stained using ImmPACT DAB EqV Peroxidase Substrate. Slides were coverslipped by cytoseal60 and scanned using Hamamatsu’s Nanozoomer microscope at 20X magnification. Images were analyzed by using the NDP.view 2.
For immunofluorescent staining (except PSD-95 staining), sections were washed in TBS for 3 times, 5 min each. After washing, sections were permeabilized with 0.25 % TBSX for 10min, followed by 3 times washes in TBS. Then sections were blocked in 10% donkey serum in TBS for 1 h at room temperature, followed by overnight incubation at 4°C with primary antibodies (rabbit polyclonal apoE, 1:500; mouse monoclonal GFAP, 1:1000; goat polyclonal Iba1, 1:500; rabbit polyclonal Rorb, 1:200; mouse monoclonal NeuN, 1:200; goat polyclonal GFAP, 1:500; rabbit Arpp21, 1:250; mouse monoclonal AT8-biotinylated, 1:500; rabbit polyclonal Aqp4, 1:1000; rabbit polyclonal olig2, 1:500; and rat monoclonal C4b, 1:25; rabbit polyclonal P2ry12, 1:1000; rat monoclonal Clec7a, 1:300). The next day, after 3 times washes in TBS, sections were incubated with corresponding fluorescence-labeled secondary antibodies for 1 h at room temperature. Then sections were washed in TBS for 6 times, 10 min each, followed by incubation in 0.1% Sudan black solution in 70% ethanol for 10 min. Finally, sections were washed in TBS for 3 times and mounted in MWL4–88 with antifade 300 added (9 parts of MWL 4–88 to 1 part antifade 300). Images in Figure 1H, Figure 5E, Figure 6I, Figure 7E, Figure 7J, Figure S1B, Figure S3E, Figure S5C, Figure S5D, Figure S6F, Figure S6G, and Figure S7D were taken by Nikon A1Rsi Confocal Microscope or Lecia Stellaris 5, and analyzed by Image J. Images in Figure 6I, Figure 7E, Figure 7J, and Figure S3E were taken by Cytation 5 and analyzed by Image J.
PSD-95, Iba1, and CD68 co-staining was carried out using following protocol. After 3 times washes in PBS, sections were permeabilized with PBS containing 0.25% Triton X-100 (PBSX) for 30 min, followed by 3 times washes in PBS. Then sections were blocked in 10% donkey serum in 0.25% PBSX solution at 4°C for overnight. The next day, sections were incubated at 4°C with primary antibodies (rabbit polyclonal PSD-95, 1:500; goat polyclonal Iba1, 1:500; and rat monoclonal CD68, 1:500). After 48 h incubation, sections were washed by PBS and incubated with corresponding fluorescence-labeled secondary antibodies for 2 h at room temperature. Then sections were washed in PBS for 3 times, 20 min each, followed by incubation in 0.1% Sudan black solution in 70% ethanol for 10 min. Finally, sections were washed in TBS for 3 times and mounted in MWL4–88 with antifade 300 added (9 parts of MWL 4–88 to 1 part antifade 300). Images were taken using Zeiss LSM 880 II Confocal Microscope and analyzed by Image J and Imaris.
Brain extraction
Mouse posterior cortical tissues were sequentially homogenized with cold RAB, RIPA, and 70% FA buffer. The recipe for RAB buffer is 0.1 M MES, 0.5mM MgSO4, 1mM EGTA, 0.75 M NaCl, pH = 7.0. The recipe for RIPA buffer is 50mM Tris, 150mM NaCl, 0.5% sodium deoxycholate, 1% Triton X-100, 0.1% SDS, 5mM EDTA, and pH = 8.0. Complete Protease Inhibitor and phosSTOP Phosphatase Inhibitor were added freshly to RAB and RIPA buffer. First, tissues were weighed and homogenized, using a hand-holder electric homogenizer (Bel-Art lab supplier, Cat# F65000–0000), in cold RAB buffer at 20 μl buffer/1 mg tissue. Equal amount of RAB homogenates was transfer to centrifuge tubes and centrifuge 20min at 50,000 × g at 4°C. Supernatant was saved as RAB fraction. Then equal amount of RIPA buffer was added to the pellet and sonicated for 1 min at 20% pulse, 1 sec interval, followed by 20 min centrifugation at 50,000 × g at 4°C. Supernatant was collected as RIPA fraction and equal amount of 70% FA was added to the pellet. After same precedence of sonication and centrifugation, supernatant was saved at FA fraction. All fractions were stored in −80°C until further analyzed.
Sandwich ELISA
The levels of total human tau, and pTau in RAB, RIPA and 70% FA fractions, and human apoE in RAB and RIPA fractions were measured by sandwich ELISA and normalized to tissue weight. pTau values were also normalized to their relative total human tau levels. The coating antibodies for human apoE, total human tau, and pTau were HJ15.3 (mouse monoclonal, 5 μg/ml), TAU-5 (mouse monoclonal, 20 μg/ml), and HJ14.5 (mouse monoclonal, 20 μg/ml), respectively. The capture antibodies for human apoE, total human tau, and pTau were HJ15.7-biotinlyated (mouse monoclonal, 150 ng/ml), HT7-biotinlyated (mouse monoclonal, 200 ng/ml) and AT8-biotinlyated (mouse monoclonal, 300 ng/ml), respectively.
Western Blotting
Female mouse hippocampus tissues were lysed using cold RIPA buffer. Samples were selected based on the mean values of hippocampal volumes. Complete Protease Inhibitor and phosSTOP Phosphatase Inhibitor were added freshly to RIPA buffer. Tissues were weighed and homogenized, using a hand-holder electric homogenizer, in cold RIPA buffer at 20 μl buffer/1 mg tissue. Homogenate was sonicated in a water bath sonicator for 10 min at 4°C, followed by centrifugation 30min at 25,000 rpm at 4°C in a microcentrifuge. Supernatant was collected for western blot. Protein concentration was determined by using Micro BCA Protein Assay Kit. 5 μg of total protein was loaded and separated by 4–12% NuPAGE gels in MOPS buffer. Gel was transferred on a nitrocellulose membrane using the iBlot 2 system. The membrane was blocked with 5% milk in TBS with 0.05% Tween (TBST) for 45 min at room temperature, followed by incubation with PSD-95 antibody (Proteintech, rabbit polyclonal, 1:1000) and α-tubulin antibody (mouse monoclonal, 1:15,000) at 4℃ for overnight. The next day, membrane was incubated with corresponding secondary HRP-conjugated secondary antibodies for 1 h at room temperature. Images were captured using the ChemiDoc™ MP Imaging System (BIO-RAD). Only the top row bands were considered as PSD-95 specific and analyzed by ImageJ.
Fluidigm Biomark HD Real-Time PCR
Female mouse hippocampus tissues were used for the gene expression analysis. Samples were selected based on the mean values of hippocampal volumes. RNA was exacted from frozen tissues using RNeasy Mini Kit and converted to cDNA using the high capacity RNA-to-cDNA kit, following the manufacturer’s instructions. Gene expression was carried out using Fluidigm Biomark HD Real-Time PCR System in collaboration with Genome Technology Access Core at Washington University. Using Taqman primers, the relative gene expression was quantitatively measured after normalized to the housekeeping gene – GAPDH.
Nest-building behavior
Two days before the predetermined data of mouse perfusion, group-housed mice were switched to individual housing. Pre-weighted nestlet was provided in each cage. After an overnight incubation, the remaining nestlet was weighted. The 5-point scale system was induced and given based on percentage of remaining nesting material and shredded conditions. Briefly, score 1: nestlet > 90% untorn; score 2: 50–90% of nestlet is untorn; score 3: 10–50% of nestlet is untorn; score 4: nestlet <10% untorn, but the nest is flat and uncompact; score 5: perfect nest – nest is compact while nest wall is higher than the mouse for >50% of its circumference.
NFL concentration
Plasma NFL concentration was measured with NF-Light Simoa Assay Advantage kit using Quanterix. The measurement was performed following the manufacturer’s instructions.
Microglial isolation from mouse brains
2 FE4-female, 4 TAFE4-TAM-female, and 4 TFE4-TAM-female mice, around 285 days, were randomly selected and perfused with perfusion buffer (DPBS + 1 X Glutamax). Mouse brains were dissociated into single cell suspension using the Adult Brain Dissociation Kit (Miltenyi Biotec, Cat# 130-107-677) with cell debris removal following manufacturer’s instructions. Single cells were resuspended in cold MACS buffer supplemented with mouse Fcγ receptor block reagent (553141; BD Biosciences) and incubated on ice for 5 min, followed by staining with APC-Cy7 rat anti-CD11b (clone M1/70, Cat# 557657; BD Biosciences) on ice for 20min. The cells were washed twice with MACS buffer, and microglia were isolated by fluorescence-activated cell sorting.
RT-qPCR
RNA was exacted from isolated microglia using RNeasy Mini Kit and converted to cDNA using the high capacity RNA-to-cDNA kit, following the manufacturer’s instructions. Gene expression was carried out using StepOnePlus Real-Time PCR System. Using Taqman primers, the relative gene expression was quantitatively measured after normalized to the housekeeping gene – GAPDH.
Tamoxifen administration
Tamoxifen was dissolved in corn oil at 20 mg/ml concentration by shaking overnight at 37℃. After preparation, tamoxifen solution was stored at 4℃ for up to a month. Tamoxifen was given at 200 mg tamoxifen/kg body weight and administered via intraperitoneal injection once every 24 h for 5 consecutive days.
Isolation of nuclei from frozen hippocampal tissue
Frozen hippocampus from 5 mice of the same genotype were pooled as a single sample. Samples were selected based on those being closest to the mean values of hippocampal volumes. Tissue was homogenized using a Dounce homogenizer in 1 ml of lysis buffer (10 mM Tris-HCl, pH = 7.4; 10 mM NaCl, 3 mM MgCl2; 0.005% NP40; and 0.2 U/μl RNase Inhibitor in nuclease-free water at 4℃) and incubated on ice for 15 min. A 30 μm MACS SmartStrainer was used to remove cell debris and large clumps, followed by centrifugation at 500 × g for 5 min at 4℃. After carefully removing the supernatant, the nuclei pellet was resuspended with 5 ml Nuclei wash and resuspension buffer (1% BSA and 0.2 U/μl RNase Inhibitor in 1 X PBS). Then cell debris removal step, centrifugation, and resuspension were repeated 2 times. Only 500 μl of Nuclei wash and resuspension buffer was added into the last resuspension step. This solution was mixed with 900 μl of Sucrose Cushion Buffer I (2.7 ml Nuclei Pure 2M Sucrose Cushion Solution with 300 μl Nuclei Pure Sucrose Cushion Solution and then carefully layered to the top of 500 μl Sucrose Cushion Buffer I in a 2 ml Eppendorf tube. This sucrose gradient was centrifuged at 13,000 × g for 45 min at 4℃. After centrifugation, the nuclear pellet was resuspended by 500 μl Nuclei Wash and Resuspension Buffer. The nuclei concentration was determined using a Countess with pre-DAPI stain. Finally, nuclei concentration was adjusted to ~1200 nuclei/μl using Nuclei Wash and Resuspension Buffer followed by proceeding to the 10 × Genomics protocol.
Single-nucleus RNA sequencing
Isolated cells were subjected to droplet-based 3’ end massively parallel single-cell RNA sequencing using Chromium Single Cell 3’ Reagent Kits (10x Genomics) following the manufacturer’s instructions. The libraries were sequenced at the Genome Technology Access Center (GTAC) using an Illumina HiSeq3000 (Illumina). Sample demultiplexing, barcode processing, and single-cell 3’ counting was performed using the Cell Ranger Single-Cell Software Suite (10x Genomics). Cellranger count was used to align samples to a custom pre-mRNA reference package (mm10) containing the human APOE gene, quantify reads, and filter reads with a quality score below 30.
Processing data with Seurat Package
The Seurat v3 and SoupX R packages were used for subsequent analysis (Butler et al., 2018; Stuart et al., 2019; Young and Behjati, 2020). For quality control, contamination of cell-free RNA for each sample group was removed using SoupX. Nuclei with mitochondrial content >5% or total UMI < 200 or > 3000 were then removed in Seurat. For each group, the % of mitochondria was regressed out as a nuisance variable, gene counts were normalized and variable features identified using the SCTransform function in Seurat. The top 3000 variable genes were used to integrate experimental groups using the PrepSCTIntegration, FindIntegrationAnchors, and IntegrateData commands in Seurat. Principal component analysis (PCA) was performed on the integrated data set and the first 20 PCs were selected for downstream analysis using FindNeighbors. Clusters were identified using the FindClusters function with a granularity ranging from 0.1 to 1.2. Final clustering was performed using a resolution of 0.6. The first 20 PCs were passed into UMAP using the RunUMAP command with default parameters. Differential gene expression between each cell cluster and all other clusters was performed on SCT data to identify marker genes for each individual cell cluster. Clusters containing high mitochondrial-genome content or marker genes for more than one broad cell type (i.e. microglia and excitatory neurons) were removed and data reclustered using the first 15 PCs and a resolution of 0.6. In total, 71,129 nuclei with a median UMI of 1746 and median gene number of 1221 across all 6 experimental groups were used in the final analysis (Table S2). Differential gene expression to identify marker genes was again performed using a Wilcoxan Rank-Sum test and broad cell types identified based on known cell-type specific markers (Table S3). For subclustering analysis, nuclei from astrocyte, microglia, or oligodendrocyte clusters were extracted from the dataset, and RNA counts renormalized and % mitochondrial genes regressed out using the SCTransform command. PCA analysis was performed and the nuclei reclustered. For oligodendrocytes, the first 4 PCs were used and clustering performed at a resolution of 0.1 (Table S5). For microglia, the first 8 PCs were used and clustering performed at a resolution of 0.1 (Table S6). For astrocytes, the first 5 PCs were used and clustering performed at a resolution of 0.2 (Table S4). Marker genes for subclusters were identified using a Wilcoxan Rank-Sum test (Table S4–S6). SCTransform function from the Seurat package was used to generate graphs from the data containing log-normalized values (Hafemeister and Satija, 2019). Expression level represents the log-normalized values of gene counts. The gene counts for each cell were divided by the total counts for that cell and scaled before natural log transformation.
Gene Set Enrichment Analysis
For all datasets, Wilcoxon rank-sum test was performed using the Presto R package. The receiver-operator area under the curve (AUC) was used to rank genes for downstream GSEA using the msigdbr R package and Hallmark and KEGG gene sets. GSEA was performed in R using the fgsea package and 10,000 permutations.
QUANTIFICATION AND STATISTICAL ANALYSIS
Statistics
All results were reported as mean ± SEM and all statistical analysis was conducted in Prism 8 (GraphPad). Significant differences between two groups was performed with Student’s t-test, unless otherwise specified. For nest-building behavior, Chi-square test was utilized to compare difference. Two-way or Three-way AONVA multiple-comparisons was used for assessing significance between more than two groups. p-value less than 0.05 (p<0.05) was considered as statistic significant difference. *p<0.05, **p<0.01, ***p<0.001, ****p<0.0001. The value of n per group and what n represents in each specific experiment can be found in Table S1.
Supplementary Material
Table S3. Lists of significant DEGs (p<0.05) in each cluster (related to Figure 4).
Table S4. Differential gene expression in astrocyte cluster (related to Figure 6).
Table S5. Differential gene expression in oligodendrocyte cluster (related to STAR★Methods).
Table S6. Differential gene expression in microglia cluster (related to Figure 7).
KEY RESOURCES TABLE
| REAGENT or RESOURCE | SOURCE | IDENTIFIER |
|---|---|---|
| Antibodies | ||
| Mouse monoclonal anti-apoE HJ15.3 | (Huynh et al., 2019) | N/A |
| Mouse monoclonal anti-apoE HJ15.7, biotinylated | (Liao et al., 2015) | N/A |
| Rabbit polyclonal anti-apoE | Cell signaling | Cat# 13366; RRID: AB_2798191 |
| Mouse monoclonal anti-GFAP, biotinylated | Millipore Sigma | Cat# MAB3402B; RRID: AB_10917109 |
| Goat polyclonal anti-lba1 | Abcam | Cat# ab5076; RRID:AB_2224402 |
| Mouse monoclonal anti-Phospho-tau (Ser202, Thr205) (AT8), biotinylated | Thermo Fisher Scientific | Cat# MN1020B; RRID: AB_223648 |
| Mouse monoclonal anti-human tau (HT7), biotinylated | Thermo Fisher Scientific | Cat# MN1000B; RRID:AB_223453 |
| Mouse monoclonal anti-p-tau HJ14.5 (Thr181) | (Shi et al., 2019) | N/A |
| Mouse monoclonal anti-tau (TAU-5) | Gift from L. Binder, Northwestern University (LoPresti et al., 1995) | N/A |
| Rat monoclonal anti-CD68, clone FA-11 | AbD SeroTec | Cat# MCA1957; RRID:AB_322219 |
| Rabbit polyclonal anti-Rorb | Proteintech | Cat# 17635-1-AP; RRID:AB_2180290 |
| Mouse monoclonal anti-NeuN | Millipore Sigma | Cat# MAB377; RRID:AB_2298772 |
| Goat polyclonal anti-GFAP | Abcam | Cat# ab53554; RRID:AB_880202 |
| Rabbit polyclonal anti-Arpp21 | Thermo Fisher Scientific | Cat# PA5-101481; RRID:AB_2850916 |
| Rabbit polyclonal anti-PSD-95 | Thermo Fisher Scientific | Cat# 51-6900; RRID:AB_2533914 |
| Rabbit polyclonal anti-PSD-95 | Proteintech | Cat# 20665-1-AP; RRID:AB_2687961 |
| Rabbit polyclonal anti-Aqp4 | Millipore Sigma | Cat# AB3594; RRID:AB_91530 |
| Mouse monoclonal anti-C4b | Thermo Fisher Scientific | Cat# MA1-40047; RRID:AB_1073827 |
| Rabbit polyclonal anti-Olig2 | Millipore Sigma | Cat# AB9610; RRID:AB_570666 |
| Mouse monoclonal anti-α-tubulin | Proteintech | Cat# 66031-1-lg; RRID:AB_2883483 |
| Rabbit polyclonal anti-P2ry12 | Gift from Dr. Oleg Butovsky (Haynes et al., 2006) | N/A |
| Rat monoclonal anti-Clec7a | InvivoGen | Cat# mabg-mdect; RRID:AB_2753143 |
| APC-Cy7 rat anti-CD11b (clone M1/70) | BD Biosciences | Cat# 557657; RRID:AB_396772 |
| Donkey anti Rabbit IgG (H+L) Hig ahly Cross-Adsorbed Secondary antibody, Alexa Fluor 594 | Thermo Fisher Scientific | Cat# A-21206; RRID:AB_2535792 |
| Donky anti-Goat IgG (H+L) Cross-Adsorbed Secondary Antibody, Alexa Fluor 647 | Thermo Fisher Scientific | Cat# A-21447; RRID:AB_141844 |
| Donkey anti Mouse IgG (H+L) Highly Cross-Adsorbed Secondary antibody, Alexa Fluor 488 | Thermo Fisher Scientific | Cat# A-21202; RRID:AB_141607 |
| Donkey anti Rabbit IgG (H+L) Highly Cross-Adsorbed Secondary antibody, Alexa Fluor 488 | Thermo Fisher Scientific | Cat# A-21206; RRID:AB_2535792 |
| Donkey anti Rat IgG (H+L) Highly Cross-Adsorbed Secondary antibody, Alexa Fluor 488 | Thermo Fisher Scientific | Cat# A-21208; RRID:AB_141709 |
| Donkey anti Mouse IgG (H+L) Highly Cross-Adsorbed Secondary antibody, Alexa Fluor 568 | Thermo Fisher Scientific | Cat# A-10037; RRID:AB_2534013 |
| Goat anti Rabbit IgG (H+L) Highly Cross-Adsorbed Secondary antibody, Alexa Fluor 488 | Thermo Fisher Scientific | Cat# A-11034; RRID:AB_2576217 |
| Goat anti Rat IgG (H+L) Cross-Adsorbed Secondary antibody, Alexa Fluor 647 | Thermo Fisher Scientific | Cat# A-21247; RRID:AB_141778 |
| Goat anti-Rabbit IgG (H+L) Secondary Antibody, Biotin | Thermo Fisher Scientific | Cat# 31820; RRID:AB_228340 |
| Goat anti-Rat IgG (H+L) Secondary Antibody, Biotin | Thermo Fisher Scientific | Cat# 31830; RRID:AB_228355 |
| Chemicals | ||
| Sudan Black B | Millipore Sigma | Cat# 199664 |
| DAPI | Millipore Sigma | Cat# MBD0015 |
| Cresyl Violet | Millipore Sigma | Cat# C5042 |
| Tamoxifen | Millipore Sigma | Cat# T5648 |
| BSA | RPI research products | Cat# A30075 |
| Critical Commercial Assays | ||
| NF-Light Simova Assay Advantage Kit | Quanterix | Cat# 103186 |
| VECTASTAIN Elite ABC-HRP Kit, Peroxidase (Standard) | Vector laboratories | Cat# PK-6100 |
| DAB Eqv Peroxidase (HRP) Substrate | Vector laboratories | Cat# SK-4103 |
| Micro BCA Protein Assay Kit | Thermo Fisher Scientific | Cat# 23235 |
| RNeasy Mini Kit | QIAGEN | Cat# 74104 |
| Nuclei Isolation Kit: Nuclei PURE Prep | Sigma-Aldrich | Cat# NUC201 |
| RNA-to-cDNA kit | Applied Biosystems | Cat# 4387406 |
| Fluoromount-G slide mounting medium | SouthernBiot ech | Cat# 010001 |
| Cytoseal60 mounting medium | Thermo Fisher Scientific | Cat# 8310-16 |
| RNase Inhibitor | Thermo Fisher Scientific | Cat# AM2696 |
| NuPAGE MOPS SDS Running Buffer | Thermo Fisher Scientific | Cat# NP0001 |
| NuPAGE 4-12% | Thermo Fisher Scientific | Cat#NP0321BOX |
| iBlot 2 NC Regular Stacks | Thermo Fisher Scientific | Cat# IB23001 |
| Complete Protease Inhibitor | Roche | Cat# 11697498001 |
| PhosSTOP Phosphatase Inhibitor | Roche | Cat# 04906845001 |
| Corn oil | Millipore Sigma | Cat# C8267 |
| TaqMan Universal PCR Mastter Mix | Thermo Fisher Scientific | Cat# 4304437 |
| Strep-HRP40 | Fitzgerald | Cat# 65R-S104PHRP |
| 3,3’ ,5,5’ - Tetramethylbenzidine Liquid Substrate, super slow, for ELISA | Millipore Sigma | Cat# T5569 |
| Pierce ECL Plus | Thermo Fisher Scientific | Cat# 32132 |
| CitiFluor MWL4-88 | Electron Microscopy Sciences | Cat# 17977-150 |
| CitiFluor AF300 | Electron Microscopy Sciences | Cat# 17977-25 |
| Fluoromount-G | SouthernBio ntech | Cat# 0100-01 |
| CYTOSEAL 60 | Thermo Fisher Scientific | Cat# 8310-4 |
| Mouse BD Fc Block | BD Biosciences | Cat# 553141 |
| Adult Brain Dissociation Kit | Miltenyi Biotec | Cat# 130-107-677 |
| GentleMACS Dissociator | Miltenyi Biotec | Cat# 130-093-235 |
| MACS SmartStrainer | Miltenyi Biotec | Cat# 130-098-462 |
| Deposited Data | ||
| snRNAseq raw data | This paper | GSE164507 |
| Experimental Models: Organisms/Strains | ||
| B6N.FVBTg(Aldh1l1cre/ERT2)1Khakh/J | Jackson Laboratory | Cat# 031008; RRID:IMSR_JAX:031008 |
| apoE4flox/flox | (Huynh et al., 2019) | N/A |
| apoE3flox/flox | (Huynh et al., 2019) | N/A |
| P301S Tau | Jackson Laboratory | Cat# 008169; RRID:IMSR_JAX:008169 |
| Oligonucleotides | ||
| Taqman qPCR primers used for qPCR | See Table S8 for details | N/A |
| Software and Algorithms | ||
| Prism 8.4.3 | GraphPad | https://www.graphpad.com/ |
| Fiji, ImageJ v1.53c | ImageJ | https://imagej.net/Fiji |
| NDP.view 2.7.25 | Hamamatsu | https://www.hamamatsu.com/ |
| R 3.6.3 | RStudio | https://cran.r-project.org/bin/windows/base/old/3.6.3/ |
| Imaris 9 | Imaris | https://imaris.oxinst.com/ |
| SoupX R packages | (Young and Behjati, 2020) | https://github.com/constantAmateur/SoupX |
| Seurat v3 | (Stuart et al., 2019) | https://github.com/satijalab/seurat/releases/tag/v3.0.0 |
| Fgsea 3.12 | (Korotkevich et al., 2021) | https://bioconductor.org/packages/release/bioc/html/fgsea.html |
| Other | ||
| Nikon A1Rsi Confocal Microscope | Nikon | A1Rsi |
| Zeiss LSM 880 II Airyscan FAST Confocal Microscope | Zeiss | Zeiss LSM 880 II Airyscan FAST |
| Leica Stellaris 5 Confocal microscope | Leica | Stellaris 5 |
| Hamamatsu Nanozoomer HT | Hamamatsu | Nanozoomer HT |
Highlights.
Astrocytic APOE4 depletion reduces tauopathy and tau-mediated neurodegeneration
Removal of astrocytic APOE4 decreases disease-associated gene signatures
Synaptic loss is rescued after astrocytic APOE4 deletion
Lowering astrocytic APOE4 has therapeutic potential for tau-related neurodegeneration
Acknowledgements
This study was supported by the Cure Alzheimer’s Fund (D.M.H. and O.B.), the JPB Foundation, NIH grants NS090934 (D.M.H.), AG047644 (D.M.H.), NS088137 (O.B), AG054672 (O.B), AG051812 (O.B) and the Farrell Family gift to support Alzheimer’s disease research (D.M.H). Scanning of immunohistochemistry was performed on the NanoZoomer digital pathology system courtesy of the Hope Center Alafi Neuroimaging Laboratory. Confocal data were partially generated on a Zeiss LSM 880 Airyscan Confocal Microscope, which was purchased with support from the Office of Research Infrastructure Programs (ORIP), a part of the NIH Office of the Director under grant OD021629, and in part with support from the Washington University Center for Cellular Imaging (WUCCI) supported by Washington University School of Medicine, The Children’s Discovery Institute of Washington University and St. Louis Children’s Hospital (CDI-CORE-2015-505 and CDI-CORE-2019-813), and the Foundation for Barnes-Jewish Hospital (3770 and 4642). We thank the Genome Technology Access Center in the Department of Genetics at Washington University School of Medicine for help with genomic analysis. The Center is partially supported by NCI Cancer Center Support Grant #P30 CA91842 to the Siteman Cancer Center and by ICTS/CTSA Grant# UL1TR002345 from the National Center for Research Resources (NCRR), a component of the National Institutes of Health (NIH), and NIH Roadmap for Medical Research. This publication is solely the responsibility of the authors and does not necessarily represent the official view of NCRR or NIH. We thank Drs. Eric Reiman, Geidy Serrano, and Thomas Beach for human brain tissue.
Footnotes
Publisher's Disclaimer: This is a PDF file of an unedited manuscript that has been accepted for publication. As a service to our customers we are providing this early version of the manuscript. The manuscript will undergo copyediting, typesetting, and review of the resulting proof before it is published in its final form. Please note that during the production process errors may be discovered which could affect the content, and all legal disclaimers that apply to the journal pertain.
Declaration of interests
D.M.H. is as an inventor on a patent licensed by Washington University to C2N Diagnostics on the therapeutic use of anti-tau antibodies. D.M.H. co-founded and is on the scientific advisory board of C2N Diagnostics. C2N Diagnostics has licensed certain anti-tau antibodies to AbbVie for therapeutic development. D.M.H. is on the scientific advisory board of Denali and consults for Genentech, Merck, and Cajal Neuroscience. All other authors have no competing interests.
References
- Apicco DJ, Ash PEA, Maziuk B, LeBlang C, Medalla M, Al Abdullatif A, Ferragud A, Botelho E, Ballance HI, Dhawan U, et al. (2018). Reducing the RNA binding protein TIA1 protects against tau-mediated neurodegeneration in vivo. Nat. Neurosci 21, 72–80. [DOI] [PMC free article] [PubMed] [Google Scholar]
- Arendt T, Schindler C, Bruckner MK, Eschrich K, Bigl V, Zedlick D, and Marcova L (1997). Plastic neuronal remodeling is impaired in patients with Alzheimer’s disease carrying apolipoprotein epsilon 4 allele. J. Neurosci 17, 516–529. [DOI] [PMC free article] [PubMed] [Google Scholar]
- Atagi Y, Liu C-C, Painter MM, Chen X-F, Verbeeck C, Zheng H, Li X, Rademakers R, Kang SS, Xu H, et al. (2015). Apolipoprotein E Is a Ligand for Triggering Receptor Expressed on Myeloid Cells 2 (TREM2). J.Bio.Chem 290, 26043–26050. [DOI] [PMC free article] [PubMed] [Google Scholar]
- Bai B, Hales CM, Chen P-C, Gozal Y, Dammer EB, Fritz JJ, Wang X, Xia Q, Duong DM, Street C, et al. (2013). U1 small nuclear ribonucleoprotein complex and RNA splicing alterations in Alzheimer’s disease. Proc. Natl. Acad. Sci. USA 110, 16562–16567. [DOI] [PMC free article] [PubMed] [Google Scholar]
- Bejanin A, Schonhaut DR, La Joie R, Kramer JH, Baker SL, Sosa N, Ayakta N, Cantwell A, Janabi M, Lauriola M, et al. (2017). Tau pathology and neurodegeneration contribute to cognitive impairment in Alzheimer’s disease. Brain 140, 3286–3300. [DOI] [PMC free article] [PubMed] [Google Scholar]
- Bell RD, Winkler EA, Singh I, Sagare AP, Deane R, Wu Z, Holtzman DM, Betsholtz C, Armulik A, Sallstrom J, et al. (2012). Apolipoprotein E controls cerebrovascular integrity via cyclophilin A. Nature 485, 512–516. [DOI] [PMC free article] [PubMed] [Google Scholar]
- Brecht WJ, Harris FM, Chang S, Tesseur I, Yu G-Q, Xu Q, Dee Fish J, Wyss-Coray T, Buttini M, Mucke L, et al. (2004). Neuron-Specific Apolipoprotein E4 Proteolysis Is Associated with Increased Tau Phosphorylation in Brains of Transgenic Mice. J. Neurosci 24, 2527–2534. [DOI] [PMC free article] [PubMed] [Google Scholar]
- Bussian TJ, Aziz A, Meyer CF, Swenson BL, van Deursen JM, and Baker DJ (2018). Clearance of senescent glial cells prevents tau-dependent pathology and cognitive decline. Nature 562, 578–582. [DOI] [PMC free article] [PubMed] [Google Scholar]
- Butler A, Hoffman P, Smibert P, Papalexi E, and Satija R (2018). Integrating single-cell transcriptomic data across different conditions, technologies, and species. Nat. Biotechnol 36, 411–420. [DOI] [PMC free article] [PubMed] [Google Scholar]
- Butovsky O, Jedrychowski MP, Cialic R, Krasemann S, Murugaiyan G, Fanek Z, Greco DJ, Wu PM, Doykan CE, Kiner O, et al. (2015). Targeting miR-155 restores abnormal microglia and attenuates disease in SOD1 mice. Ann. Neurol 77, 75–99. [DOI] [PMC free article] [PubMed] [Google Scholar]
- Butovsky O, Jedrychowski MP, Moore CS, Cialic R, Lanser AJ, Gabriely G, Koeglsperger T, Dake B, Wu PM, Doykan CE, et al. (2014). Identification of a unique TGF-beta-dependent molecular and functional signature in microglia. Nat. Neurosci 17, 131–143. [DOI] [PMC free article] [PubMed] [Google Scholar]
- Castellano JM, Kim J, Stewart FR, Jiang H, DeMattos RB, Patterson BW, Fagan AM, Morris JC, Mawuenyega KG, Cruchaga C, et al. (2011). Human apoE isoforms differentially regulate brain amyloid-beta peptide clearance. Sci. Transl. Med 3, 89ra57. [DOI] [PMC free article] [PubMed] [Google Scholar]
- Chen Y, Durakoglugil MS, Xian X, and Herz J (2010). ApoE4 reduces glutamate receptor function and synaptic plasticity by selectively impairing ApoE receptor recycling. Proc. Natl. Acad. Sci. USA 107, 12011–12016. [DOI] [PMC free article] [PubMed] [Google Scholar]
- Dejanovic B, Huntley MA, De Mazière A, Meilandt WJ, Wu T, Srinivasan K, Jiang Z, Gandham V, Friedman BA, Ngu H, et al. (2018). Changes in the Synaptic Proteome in Tauopathy and Rescue of Tau-Induced Synapse Loss by C1q Antibodies. Neuron 100, 1322–1336.e1327. [DOI] [PubMed] [Google Scholar]
- DeVos SL, Miller RL, Schoch KM, Holmes BB, Kebodeaux CS, Wegener AJ, Chen G, Shen T, Tran H, Nichols B, et al. (2017). Tau reduction prevents neuronal loss and reverses pathological tau deposition and seeding in mice with tauopathy. Sci. Transl. Med 9, eaag0481. [DOI] [PMC free article] [PubMed] [Google Scholar]
- Drummond E, Pires G, MacMurray C, Askenazi M, Nayak S, Bourdon M, Safar J, Ueberheide B, and Wisniewski T (2020). Phosphorylated tau interactome in the human Alzheimer’s disease brain. Brain 143, 2803–2817. [DOI] [PMC free article] [PubMed] [Google Scholar]
- Drzezga A, Riemenschneider M, Strassner B, Grimmer T, Peller M, Knoll A, Wagenpfeil S, Minoshima S, Schwaiger M, and Kurz A (2005). Cerebral glucose metabolism in patients with AD and different APOE genotypes. Neurology 64, 102–107. [DOI] [PubMed] [Google Scholar]
- Geijselaers SLC, Aalten P, Ramakers I, De Deyn PP, Heijboer AC, Koek HL, OldeRikkert MGM, Papma JM, Reesink FE, Smits LL, et al. (2018). Association of Cerebrospinal Fluid (CSF) Insulin with Cognitive Performance and CSF Biomarkers of Alzheimer’s Disease. J. Alzheimers Dis 61, 309–320. [DOI] [PMC free article] [PubMed] [Google Scholar]
- Gratuze M, Leyns CE, Sauerbeck AD, St-Pierre MK, Xiong M, Kim N, Serrano JR, Tremblay ME, Kummer TT, Colonna M, et al. (2020). Impact of TREM2R47H variant on tau pathology-induced gliosis and neurodegeneration. J. Clin. Invest 130, 4954–4968. [DOI] [PMC free article] [PubMed] [Google Scholar]
- Habib N, McCabe C, Medina S, Varshavsky M, Kitsberg D, Dvir-Szternfeld R, Green G, Dionne D, Nguyen L, Marshall JL, et al. (2020). Disease-associated astrocytes in Alzheimer’s disease and aging. Nat. Neurosci 23, 701–706. [DOI] [PMC free article] [PubMed] [Google Scholar]
- Hafemeister C, and Satija R (2019). Normalization and variance stabilization of single-cell RNA-seq data using regularized negative binomial regression. Genome Biol. 20, 296. [DOI] [PMC free article] [PubMed] [Google Scholar]
- Harrison IF, Ismail O, Machhada A, Colgan N, Ohene Y, Nahavandi P, Ahmed Z, Fisher A, Meftah S, Murray TK, et al. (2020). Impaired glymphatic function and clearance of tau in an Alzheimer’s disease model. Brain 143, 2576–2593. [DOI] [PMC free article] [PubMed] [Google Scholar]
- Haynes SE, Hollopeter G, Yang G, Kurpius D, Dailey ME, Gan WB, and Julius D (2006). The P2Y12 receptor regulates microglial activation by extracellular nucleotides. Nat. Neurosci 9, 1512–1519. [DOI] [PubMed] [Google Scholar]
- Hirsch-Reinshagen V, Zhou S, Burgess BL, Bernier L, McIsaac SA, Chan JY, Tansley GH, Cohn JS, Hayden MR, and Wellington CL (2004). Deficiency of ABCA1 Impairs Apolipoprotein E Metabolism in Brain. J. Biol. Chem 279, 41197–41207. [DOI] [PubMed] [Google Scholar]
- Holtzman DM, Herz J, and Bu G (2012). Apolipoprotein E and apolipoprotein E receptors: normal biology and roles in Alzheimer disease. Cold Spring Harb. Perspect. Med 2, a006312. [DOI] [PMC free article] [PubMed] [Google Scholar]
- Hong S, Beja-Glasser VF, Nfonoyim BM, Frouin A, Li S, Ramakrishnan S, Merry KM, Shi Q, Rosenthal A, Barres BA, et al. (2016). Complement and microglia mediate early synapse loss in Alzheimer mouse models. Science 352, 712–716. [DOI] [PMC free article] [PubMed] [Google Scholar]
- Hsieh Y-C, Guo C, Yalamanchili HK, Abreha M, Al-Ouran R, Li Y, Dammer EB, Lah JJ, Levey AI, Bennett DA, et al. (2019). Tau-Mediated Disruption of the Spliceosome Triggers Cryptic RNA Splicing and Neurodegeneration in Alzheimer’s Disease. Cell Rep. 29, 301–316.e310. [DOI] [PMC free article] [PubMed] [Google Scholar]
- Huynh TV, Liao F, Francis CM, Robinson GO, Serrano JR, Jiang H, Roh J, Finn MB, Sullivan PM, Esparza TJ, et al. (2017). Age-Dependent Effects of apoE Reduction Using Antisense Oligonucleotides in a Model of beta-amyloidosis. Neuron 96, 1013–1023 e1014. [DOI] [PMC free article] [PubMed] [Google Scholar]
- Huynh TV, Wang C, Tran AC, Tabor GT, Mahan TE, Francis CM, Finn MB, Spellman R, Manis M, Tanzi RE, et al. (2019). Lack of hepatic apoE does not influence early Abeta deposition: observations from a new APOE knock-in model. Mol. Neurodegener 14, 37. [DOI] [PMC free article] [PubMed] [Google Scholar]
- Johnson ECB, Dammer EB, Duong DM, Ping L, Zhou M, Yin L, Higginbotham LA, Guajardo A, White B, Troncoso JC, et al. (2020). Large-scale proteomic analysis of Alzheimer’s disease brain and cerebrospinal fluid reveals early changes in energy metabolism associated with microglia and astrocyte activation. Nat. Med 26, 769–780. [DOI] [PMC free article] [PubMed] [Google Scholar]
- Keren-Shaul H, Spinrad A, Weiner A, Matcovitch-Natan O, Dvir-Szternfeld R, Ulland TK, David E, Baruch K, Lara-Astaiso D, Toth B, et al. (2017). A Unique Microglia Type Associated with Restricting Development of Alzheimer’s Disease. Cell 169, 1276–1290.e1217. [DOI] [PubMed] [Google Scholar]
- Khalil M, Teunissen CE, Otto M, Piehl F, Sormani MP, Gattringer T, Barro C, Kappos L, Comabella M, Fazekas F, et al. (2018). Neurofilaments as biomarkers in neurological disorders. Nat. Rev. Neurol 14, 577–589. [DOI] [PubMed] [Google Scholar]
- Korotkevich G, Sukhov V, Budin N, Shpak B, Artyomov MN, and Sergushichev A (2021). Fast gene set enrichment analysis. bioRxiv, 060012; doi: 10.1101/060012. [DOI] [Google Scholar]
- Krasemann S, Madore C, Cialic R, Baufeld C, Calcagno N, El Fatimy R, Beckers L, O’Loughlin E, Xu Y, Fanek Z, et al. (2017). The TREM2-APOE Pathway Drives the Transcriptional Phenotype of Dysfunctional Microglia in Neurodegenerative Diseases. Immunity 47, 566–581.e569. [DOI] [PMC free article] [PubMed] [Google Scholar]
- La Joie R, Visani AV, Baker SL, Brown JA, Bourakova V, Cha J, Chaudhary K, Edwards L, Iaccarino L, Janabi M, et al. (2020). Prospective longitudinal atrophy in Alzheimer’s disease correlates with the intensity and topography of baseline tau-PET. Sci. Transl. Med 12, eaau5732. [DOI] [PMC free article] [PubMed] [Google Scholar]
- Leng K, Li E, Eser R, Piergies A, Sit R, Tan M, Neff N, Li SH, Rodriguez RD, Suemoto CK, et al. (2021). Molecular characterization of selectively vulnerable neurons in Alzheimer’s disease. Nat. Neurosci 24, 276–287. [DOI] [PMC free article] [PubMed] [Google Scholar]
- Liao F, Zhang TJ, Jiang H, Lefton KB, Robinson GO, Vassar R, Sullivan PM, and Holtzman DM (2015). Murine versus human apolipoprotein E4: differential facilitation of and co-localization in cerebral amyloid angiopathy and amyloid plaques in APP transgenic mouse models. Acta Neuropathol. Commun 3, 70. [DOI] [PMC free article] [PubMed] [Google Scholar]
- Litvinchuk A, Wan Y-W, Swartzlander DB, Chen F, Cole A, Propson NE, Wang Q, Zhang B, Liu Z, and Zheng H (2018). Complement C3aR Inactivation Attenuates Tau Pathology and Reverses an Immune Network Deregulated in Tauopathy Models and Alzheimer’s Disease. Neuron 100, 1337–1353.e1335. [DOI] [PMC free article] [PubMed] [Google Scholar]
- Liu CC, Zhao N, Fu Y, Wang N, Linares C, Tsai CW, and Bu G (2017). ApoE4 Accelerates Early Seeding of Amyloid Pathology. Neuron 96, 1024–1032 e1023. [DOI] [PMC free article] [PubMed] [Google Scholar]
- LoPresti P, Szuchet S, Papasozomenos SC, Zinkowski RP, and Binder LI (1995). Functional implications for the microtubule-associated protein tau: localization in oligodendrocytes. Proc. Natl. Acad. Sci. USA 92, 10369–10373. [DOI] [PMC free article] [PubMed] [Google Scholar]
- Mancuso R, Fryatt G, Cleal M, Obst J, Pipi E, Monzon-Sandoval J, Ribe E, Winchester L, Webber C, Nevado A, et al. (2019). CSF1R inhibitor JNJ-40346527 attenuates microglial proliferation and neurodegeneration in P301S mice. Brain 142, 3243–3264. [DOI] [PMC free article] [PubMed] [Google Scholar]
- McQuade A, Kang YJ, Hasselmann J, Jairaman A, Sotelo A, Coburn M, Shabestari SK, Chadarevian JP, Fote G, Tu CH, et al. (2020). Gene expression and functional deficits underlie TREM2-knockout microglia responses in human models of Alzheimer’s disease. Nat. Commun 11, 5370. [DOI] [PMC free article] [PubMed] [Google Scholar]
- Montagne A, Nation DA, Sagare AP, Barisano G, Sweeney MD, Chakhoyan A, Pachicano M, Joe E, Nelson AR, D’Orazio LM, et al. (2020). APOE4 leads to blood-brain barrier dysfunction predicting cognitive decline. Nature 581, 71–76. [DOI] [PMC free article] [PubMed] [Google Scholar]
- Nielsen JV, Thomassen M, Møllgård K, Noraberg J, and Jensen NA (2014). Zbtb20 Defines a Hippocampal Neuronal Identity Through Direct Repression of Genes That Control Projection Neuron Development in the Isocortex. Cereb. Cortex 24, 1216–1229. [DOI] [PubMed] [Google Scholar]
- Nugent AA, Lin K, van Lengerich B, Lianoglou S, Przybyla L, Davis SS, Llapashtica C, Wang J, Kim DJ, Xia D, et al. (2020). TREM2 Regulates Microglial Cholesterol Metabolism upon Chronic Phagocytic Challenge. Neuron 105, 837–854.e839. [DOI] [PubMed] [Google Scholar]
- Parhizkar S, Arzberger T, Brendel M, Kleinberger G, Deussing M, Focke C, Nuscher B, Xiong M, Ghasemigharagoz A, Katzmarski N, et al. (2019). Loss of TREM2 function increases amyloid seeding but reduces plaque-associated ApoE. Nat. Neurosci 22, 191–204. [DOI] [PMC free article] [PubMed] [Google Scholar]
- Petersen C, Nolan AL, de Paula França Resende E, Miller Z, Ehrenberg AJ, Gorno-Tempini ML, Rosen HJ, Kramer JH, Spina S, Rabinovici GD, et al. (2019). Alzheimer’s disease clinical variants show distinct regional patterns of neurofibrillary tangle accumulation. Acta Neuropathol. 138, 597–612. [DOI] [PMC free article] [PubMed] [Google Scholar]
- Pitas RE, Boyles JK, Lee SH, Foss D, and Mahley RW (1987). Astrocytes synthesize apolipoprotein E and metabolize apolipoprotein E-containing lipoproteins. Biochim. Biophys. Acta 917, 148–161. [DOI] [PubMed] [Google Scholar]
- Rehfeld F, Maticzka D, Grosser S, Knauff P, Eravci M, Vida I, Backofen R, and Wulczyn FG (2018). The RNA-binding protein ARPP21 controls dendritic branching by functionally opposing the miRNA it hosts. Nat. Commun 9, 1235. [DOI] [PMC free article] [PubMed] [Google Scholar]
- Sala Frigerio C, Wolfs L, Fattorelli N, Thrupp N, Voytyuk I, Schmidt I, Mancuso R, Chen W-T, Woodbury ME, Srivastava G, et al. (2019). The Major Risk Factors for Alzheimer’s Disease: Age, Sex, and Genes Modulate the Microglia Response to Aβ Plaques. Cell Rep. 27, 1293–1306.e1296. [DOI] [PMC free article] [PubMed] [Google Scholar]
- Shi Y, and Holtzman DM (2018). Interplay between innate immunity and Alzheimer disease: APOE and TREM2 in the spotlight. Nat. Rev. Immunol 18, 759–772. [DOI] [PMC free article] [PubMed] [Google Scholar]
- Shi Y, Manis M, Long J, Wang K, Sullivan PM, Remolina Serrano J, Hoyle R, and Holtzman DM (2019). Microglia drive APOE-dependent neurodegeneration in a tauopathy mouse model. J. Exp. Med 216, 2546–2561. [DOI] [PMC free article] [PubMed] [Google Scholar]
- Shi Y, Yamada K, Liddelow SA, Smith ST, Zhao L, Luo W, Tsai RM, Spina S, Grinberg LT, Rojas JC, et al. (2017). ApoE4 markedly exacerbates tau-mediated neurodegeneration in a mouse model of tauopathy. Nature 549, 523–527. [DOI] [PMC free article] [PubMed] [Google Scholar]
- Srinivasan R, Lu TY, Chai H, Xu J, Huang BS, Golshani P, Coppola G, and Khakh BS (2016). New Transgenic Mouse Lines for Selectively Targeting Astrocytes and Studying Calcium Signals in Astrocyte Processes In Situ and In Vivo. Neuron 92, 1181–1195. [DOI] [PMC free article] [PubMed] [Google Scholar]
- Stevens B, Allen NJ, Vazquez LE, Howell GR, Christopherson KS, Nouri N, Micheva KD, Mehalow AK, Huberman AD, Stafford B, et al. (2007). The Classical Complement Cascade Mediates CNS Synapse Elimination. Cell 131, 1164–1178. [DOI] [PubMed] [Google Scholar]
- Strittmatter WJ, Saunders AM, Schmechel D, Pericak-Vance M, Enghild J, Salvesen GS, and Roses AD (1993). Apolipoprotein E: high-avidity binding to beta-amyloid and increased frequency of type 4 allele in late-onset familial Alzheimer disease. Proc. Natl. Acad. Sci. USA 90, 1977–1981. [DOI] [PMC free article] [PubMed] [Google Scholar]
- Stuart T, Butler A, Hoffman P, Hafemeister C, Papalexi E, Mauck WM 3rd, Hao Y, Stoeckius M, Smibert P, and Satija R (2019). Comprehensive Integration of Single-Cell Data. Cell 177, 1888–1902 e1821. [DOI] [PMC free article] [PubMed] [Google Scholar]
- Therriault J, Benedet AL, Pascoal TA, Mathotaarachchi S, Chamoun M, Savard M, Thomas E, Kang MS, Lussier F, Tissot C, et al. (2020). Association of Apolipoprotein E epsilon4 With Medial Temporal Tau Independent of Amyloid-beta. JAMA Neurol. 77, 470–479. [DOI] [PMC free article] [PubMed] [Google Scholar]
- Ulrich JD, Ulland TK, Mahan TE, Nystrom S, Nilsson KP, Song WM, Zhou Y, Reinartz M, Choi S, Jiang H, et al. (2018). ApoE facilitates the microglial response to amyloid plaque pathology. J. Exp. Med 215, 1047–1058. [DOI] [PMC free article] [PubMed] [Google Scholar]
- Wahrle SE, Jiang H, Parsadanian M, Legleiter J, Han X, Fryer JD, Kowalewski T, and Holtzman DM (2004). ABCA1 Is Required for Normal Central Nervous System ApoE Levels and for Lipidation of Astrocyte-secreted apoE. J. Biol. Chem 279, 40987–40993. [DOI] [PubMed] [Google Scholar]
- Weigand AJ, Thomas KR, Bangen KJ, Eglit GML, Delano-Wood L, Gilbert PE, Brickman AM, Bondi MW, and Alzheimer’s Disease Neuroimaging I (2020). APOE interacts with tau PET to influence memory independently of amyloid PET in older adults without dementia. Alzheimers. Dement 17, 61–69. [DOI] [PubMed] [Google Scholar]
- Wolozin B, and Ivanov P (2019). Stress granules and neurodegeneration. Nat. Rev. Neurosci 20, 649–666. [DOI] [PMC free article] [PubMed] [Google Scholar]
- Wu L, Zhang X, and Zhao L (2018). Human ApoE Isoforms Differentially Modulate Brain Glucose and Ketone Body Metabolism: Implications for Alzheimer’s Disease Risk Reduction and Early Intervention. J. Neurosci 38, 6665–6681. [DOI] [PMC free article] [PubMed] [Google Scholar]
- Wu T, Dejanovic B, Gandham VD, Gogineni A, Edmonds R, Schauer S, Srinivasan K, Huntley MA, Wang Y, Wang T-M, et al. (2019). Complement C3 Is Activated in Human AD Brain and Is Required for Neurodegeneration in Mouse Models of Amyloidosis and Tauopathy. Cell Rep. 28, 2111–2123.e2116. [DOI] [PubMed] [Google Scholar]
- Yoshiyama Y, Higuchi M, Zhang B, Huang SM, Iwata N, Saido TC, Maeda J, Suhara T, Trojanowski JQ, and Lee VM (2007). Synapse loss and microglial activation precede tangles in a P301S tauopathy mouse model. Neuron 53, 337–351. [DOI] [PubMed] [Google Scholar]
- Young MD, and Behjati S (2020). SoupX removes ambient RNA contamination from droplet based single-cell RNA sequencing data. Gigascience 9, giaa151. [DOI] [PMC free article] [PubMed] [Google Scholar]
- Zhao J, Davis MD, Martens YA, Shinohara M, Graff-Radford NR, Younkin SG, Wszolek ZK, Kanekiyo T, and Bu G (2017a). APOE epsilon4/epsilon4 diminishes neurotrophic function of human iPSC-derived astrocytes. Hum. Mol. Genet 26, 2690–2700. [DOI] [PMC free article] [PubMed] [Google Scholar]
- Zhao J, Fu Y, Yamazaki Y, Ren Y, Davis MD, Liu C-C, Lu W, Wang X, Chen K, Cherukuri Y, et al. (2020). APOE4 exacerbates synapse loss and neurodegeneration in Alzheimer’s disease patient iPSC-derived cerebral organoids. Nat. Commun 11, 5540. [DOI] [PMC free article] [PubMed] [Google Scholar]
- Zhao N, Liu C-C, Van Ingelgom AJ, Linares C, Kurti A, Knight JA, Heckman MG, Diehl NN, Shinohara M, Martens YA, et al. (2018). APOE ε2 is associated with increased tau pathology in primary tauopathy. Nat. Commun 9, 4388. [DOI] [PMC free article] [PubMed] [Google Scholar]
- Zhao N, Liu CC, Van Ingelgom AJ, Martens YA, Linares C, Knight JA, Painter MM, Sullivan PM, and Bu G (2017b). Apolipoprotein E4 Impairs Neuronal Insulin Signaling by Trapping Insulin Receptor in the Endosomes. Neuron 96, 115–129 e115. [DOI] [PMC free article] [PubMed] [Google Scholar]
- Zhou Y, Song WM, Andhey PS, Swain A, Levy T, Miller KR, Poliani PL, Cominelli M, Grover S, Gilfillan S, et al. (2020). Human and mouse single-nucleus transcriptomics reveal TREM2-dependent and TREM2-independent cellular responses in Alzheimer’s disease. Nat. Med 26, 131–142. [DOI] [PMC free article] [PubMed] [Google Scholar]
- Zlokovic BV (2013). Cerebrovascular effects of apolipoprotein E: implications for Alzheimer disease. JAMA Neurol. 70, 440–444. [DOI] [PMC free article] [PubMed] [Google Scholar]
Associated Data
This section collects any data citations, data availability statements, or supplementary materials included in this article.
Supplementary Materials
Table S3. Lists of significant DEGs (p<0.05) in each cluster (related to Figure 4).
Table S4. Differential gene expression in astrocyte cluster (related to Figure 6).
Table S5. Differential gene expression in oligodendrocyte cluster (related to STAR★Methods).
Table S6. Differential gene expression in microglia cluster (related to Figure 7).
Data Availability Statement
Mouse snRNA-seq data that support the findings of this study have been deposited in the Gene Expression Omnibus (GEO) database with accession number GSE164507. Further data and code supporting the findings of this study are available from the corresponding authors on request.