

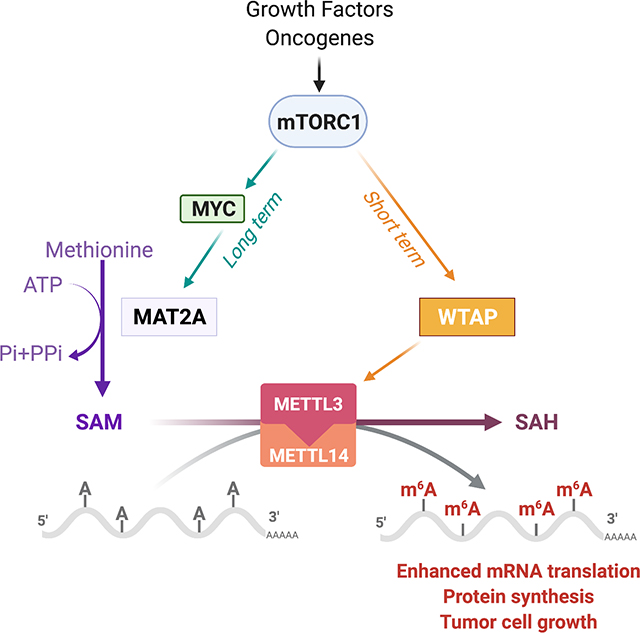
Summary
The mechanistic target of rapamycin complex 1 (mTORC1) regulates metabolism and cell growth in response to nutrient, growth, and oncogenic signals. We found that mTORC1 stimulates the synthesis of the major methyl donor, S-adenosylmethionine (SAM), through the control of methionine adenosyltransferase 2 alpha (MAT2A) expression. The transcription factor c-MYC, downstream of mTORC1, directly binds to intron 1 of MAT2A and promotes its expression. Furthermore, mTORC1 increases the protein abundance of Wilms’ tumor 1-associating protein (WTAP), the positive regulatory subunit of the human N6-methyladenosine (m6A) RNA methyltransferase complex. Through the control of MAT2A and WTAP levels, mTORC1 signaling stimulates m6A RNA modification to promote protein synthesis and cell growth. A decline in intracellular SAM levels upon MAT2A inhibition decreases m6A RNA modification, protein synthesis rate, and tumor growth. Thus, mTORC1 adjusts m6A RNA modification through the control of SAM and WTAP levels to prime the translation machinery for anabolic cell growth.
eTOC blurb:
Villa et al. showed that mTORC1 activation stimulates N6-adenosine methylation of mRNA (m6A) through the control of S-adenosylmethionine (SAM) synthesis and WTAP protein abundance. mTORC1 promotes an increase in WTAP levels and concordantly increases MAT2A expression for SAM production and m6A RNA methylation to support protein synthesis and tumor growth.
Graphical Abstract
Introduction
The mechanistic target of rapamycin complex 1 (mTORC1) senses and integrates diverse environmental signals to control energy and nutrient-consuming biosynthetic processes, such as protein, lipid, and nucleotide synthesis (Condon and Sabatini, 2019). mTORC1 stimulates anabolic cell growth through posttranslational and transcriptional mechanisms, leading to increased macromolecule synthesis, a prerequisite to augment cellular biomass, allowing cells to grow and divide (Ben-Sahra and Manning, 2017; Wullschleger et al., 2006). Growth factors such as insulin stimulate the PI3K-AKT pathway and activate mTORC1 signaling primarily by controlling the localization of the tumor suppressor tuberous sclerosis complex (TSC)1/2 at the lysosome surface (Menon et al., 2014). Loss-of-function mutations in TSC1/2 lead to growth factor-independent activation of mTORC1 signaling, which gives rise to the genetic tumor syndromes TSC, and lymphangioleiomyomatosis (LAM) (Huang and Manning, 2008; McEneaney and Tee, 2019). Unrestrained activation of mTORC1 through the oncogenic PI3K-AKT and RAS-ERK pathways is also observed in many cancers (De Luca et al., 2012; Mendoza et al., 2011).
To achieve the biosynthetic demands that accompany proliferation, a cancer cell must increase the transport of nutrients from the environment (Pavlova and Thompson, 2016). Cells maintain pools of various carbon intermediates through the catabolism of glucose and glutamine, which are used as building blocks for the assembly of various macromolecules (Pavlova and Thompson, 2016; Weyandt et al., 2017). An emerging aspect of nutrient utilization in cancer includes the role of methionine, which was recently explored in the context of dietary methionine restriction in cancer (Gao et al., 2019; Sanderson et al., 2019). Methionine is an essential amino acid that is catabolized and recycled in a sequence of metabolic reactions called the methionine cycle. Briefly, methionine and ATP are converted into the universal methyl donor S-adenosylmethionine (SAM) via the methionine adenosyltransferase 2 alpha (MAT2A) enzyme. MAT2A enzymatic activity is regulated by its binding partner, MAT2B which alters MAT2A’s substrate affinity for methionine and its sensitivity to product inhibition (Shafqat et al., 2013). Upon donation of its methyl group, SAM is converted to S-adenosylhomocysteine (SAH) which is then hydrolyzed to generate homocysteine to either sustain cysteine synthesis via the transsulfuration pathway or to be converted back into methionine via the folate cycle (Ducker and Rabinowitz, 2017; Klein Geltink and Pearce, 2019). The methionine and the folate cycles form the two primary components of what is designated as one-carbon metabolism (Locasale, 2013); this metabolic network enables the assimilation of carbon units in a diverse set of fundamental cellular processes (Sanderson et al., 2019). Additionally, methionine can also be recycled from the SAM-dependent polyamine biosynthesis by-product 5-methylthioadenosine (5-MTA) through the methionine salvage pathway (Albers, 2009).
SAM is the methyl donor for most of the methylation reactions that occur in eukaryotic cells (Mahmoud and Ali, 2019). DNA methyltransferases (DNMTs) catalyze the transfer of a methyl group from SAM to cytosine residues in cytosine–phosphate–guanine (CpG) islands (Jin et al., 2011). DNA methylation has been broadly observed across various phases of development and has generally been associated with the repression of gene expression (Razin and Cedar, 1991), although recent genome-wide methylation studies suggest that DNA hypermethylation does not necessarily correspond to gene repression (Long et al., 2017; Mehrmohamadi et al., 2016; Zhang et al., 2015). Histone methylation, like DNA methylation, is one of the most studied epigenetic modifications (Kondo, 2009; Smith and Shilatifard, 2010) and can be linked to active transcription or to gene silencing. Histone and protein methyltransferases, like DNMTs, utilize the SAM cofactor to methylate lysine (histone lysine methyltransferases, HKMTs) and arginine residues (protein arginine N-methyltransferases, PRMTs), respectively (Castillo-Aguilera et al., 2017).
SAM is also used to sustain RNA methylation via RNA methyltransferases, which regulate RNA splicing, processing, translation, and decay (Chen et al., 2019; Wu et al., 2018). N6-methyladenosine (m6A) is considered the most common, abundant, and conserved internal nucleic acid modification, especially for eukaryotic RNAs (Niu et al., 2013). Methyltransferase-like 3 (METTL3), METTL14, and Wilms tumor 1-associated protein (WTAP), catalyze the formation of m6A in messenger RNA (mRNA) (Yang et al., 2018). Emerging evidence suggests that m6A mRNA modification is associated with proliferation, tumorigenesis (Lin et al., 2016; Liu et al., 2018), and metastasis (Ma et al., 2017) and functions as an oncogenic signal in malignant tumors. These methylation events are mainly dependent on methionine metabolism, as alterations in dietary methionine were found to have both temporal and tissue-specific effects on nucleic acid methylation (Maddocks et al., 2016; Miousse et al., 2017). An important area of investigation in the cancer metabolism field is how methionine metabolism and environmental nutrient availability impact cancer cell growth. Given the prominent role of mTORC1 in integrating oncogenic and nutrient signals with the control of cell growth, we postulated that mTORC1 can directly regulate methionine metabolism, and more specifically, intracellular levels of SAM. SAM was previously reported to be a key metabolite that enables sensing of methionine levels by the mTORC1 pathway through the direct binding of SAM to the S-adenosylmethionine sensor upstream of mTORC1 (SAMTOR) (Gu et al., 2017). SAM prevents SAMTOR from stimulating GTPase-activating protein (GAP) activity towards Rags-1 (GATOR1) that inhibits the RAG-GTPase-dependent activation of mTORC1 (Gu et al., 2017). The influence of SAM in the regulation of cancer-associated phenotypes has been related to its role in controlling the epigenetic landscape (Miranda-Goncalves et al., 2018; Wong et al., 2017). However, the mechanisms contributing to the regulation of SAM levels and its role in anabolic metabolism upon the activation of growth signaling pathways remain largely unknown.
Here, we reveal that mTORC1 stimulates the methionine cycle to increase SAM synthesis required for RNA methylation. Mechanistically, the transcription factor c-MYC binds to MAT2A intron 1 and increases MAT2A expression and SAM levels in an mTORC1-dependent manner. The mTORC1-dependent regulation of SAM synthesis does not correlate with epigenetic changes in DNA and histone methylation. Conversely, mTORC1 stimulates m6A mRNA through an increase in SAM synthesis and WTAP protein levels priming mRNA for protein synthesis. Our findings reveal a framework in which growth factors and oncogenes fine-tune m6A RNA for anabolic processes through mTORC1-dependent control of SAM synthesis and WTAP protein abundance. Furthermore, our study highlights MAT2A as a potential therapeutic target for mTORC1-driven diseases such as cancer, tumor syndrome, and metabolic disorders.
Results
mTORC1 signaling stimulates the SAM pathway
To reveal novel metabolic pathways under the control of mTORC1 signaling, we performed liquid-chromatography (LC) tandem mass spectrometry (MS/MS)-based metabolite profiling in HeLa cells stimulated with a physiological activator of mTORC1 signaling, insulin, and treated with vehicle or the mTORC1-specific inhibitor rapamycin (Figure 1A). Among the 200 small molecules identified, the steady-state levels of 37 metabolites were significantly increased in insulin-stimulated HeLa cells compared to serum-starved cells, and 31 metabolites were significantly decreased upon rapamycin treatment (Figures 1B–C, Table S1). Pathway impact analysis of this dataset revealed that five main metabolic pathways are positively regulated by mTORC1: pyrimidine synthesis; purine synthesis; glucose metabolism; arginine metabolism; and cysteine and methionine metabolism (Figure 1D). While glucose metabolism and nucleotide synthesis were previously identified as being downstream of mTORC1 (Ben-Sahra et al., 2013; Ben-Sahra et al., 2016; Düvel et al., 2010; Robitaille et al., 2013; Salmond, 2018), the regulation of cysteine/methionine metabolism and arginine metabolism by mTORC1 signaling has not been previously reported.
Figure 1. mTORC1 stimulates SAM synthesis.

(A) Immunoblots of HeLa cells grown in the absence of serum and treated for 24 hours with insulin (500 nM) in the presence of vehicle (DMSO) or rapamycin (20 nM).
(B, C) Steady-state metabolite profiles of wild-type HeLa cells grown in the absence of serum and treated with vehicle, insulin (500 nM, 24 hours) or rapamycin (20 nM, 24 hours). Intracellular metabolites from three independent samples per condition were profiled by LC-MS/MS, and those significantly increased in insulin-treated cells compared to vehicle cells (B) or decreased with rapamycin-treated cells (C) are shown as row-normalized heat maps ranked according to p-value.
(D) Pathway Impact analysis of steady-state metabolite profiling presented in (B, C).
(E) Corresponding immunoblots and normalized peak area of methionine cycle intermediates measured by LC-MS/MS in serum-starved wild-type or ΔTSC2 HeLa cells treated with vehicle (DMSO) or rapamycin (20 nM, 15 hours).
(F) Indicated metabolites measured as in (E), but ΔTSC2 HeLa cells were transfected with siRNAs targeting RAPTOR or nontargeting controls (siCtl) for 48 hours prior to metabolite extraction.
(G) Schematic of carbon flow from the methionine backbone into the methionine cycle.
(H-J) Normalized peak areas of 13C-labeled metabolites measured by targeted LC-MS/MS from wild-type or ΔTSC2 HeLa cells (H) or cancer cell lines (I, J) grown in the absence of serum and treated with vehicle (DMSO) or rapamycin (20 nM) for 24 hours and labeled with 13C5-methionine (200 μM) for 90 min in methionine-free media. M+n: Mass of the metabolite+n, where n represents the number of heavy carbons (13C)). Each isotopologue (M+n) reflects the newly synthesized metabolite generated from the metabolization of the tracer or metabolite derived from the tracer.
(E, F, H-J) The data are presented as the mean ± SD of biological triplicates and are representative of two independent experiments. *P < 0.05 for multiple comparisons calculated using one-way ANOVA with Tukey’s HSD test (E, H) and two-tailed Student’s t-test for pairwise comparisons (F, I, J).
We confirmed this finding with a genetic approach, by deletion of the tumor suppressor and negative regulator of mTORC1 signaling, TSC2, in HEK293E cells with CRISPR/Cas9 (Figure S1A). TSC2-deficient (ΔTSC2) HEK293E cells exhibited growth factor-independent activation of mTORC1 signaling (Figure S1B). The steady-state levels of 51 metabolites were significantly upregulated in ΔTSC2 HEK293E cells relative to their wild-type counterparts (Figure S1C and Table S2). ΔTSC2 HEK293E cells treated with rapamycin exhibited decreased levels of metabolites involved in glycolysis, the pentose phosphate pathway, nucleotide synthesis, and methionine metabolism (Figure S1C). Specifically, the abundance of SAM was increased in the ΔTSC2 HEK293E and HeLa cells compared to their wild-type counterparts and was reduced upon rapamycin treatment (Figures 1E and S1D). Moreover, siRNA-mediated knockdown of the mTORC1-essential component, regulatory-associated protein of mTOR (RAPTOR), decreased steady-state levels of SAM, suggesting that SAM levels are specifically controlled by mTOR complex 1 (Figure 1F). These findings indicate that mTORC1 signaling positively influences the abundance of this metabolite. To determine whether mTORC1 signaling regulates SAM synthesis, we employed an isotope tracing method with 13C5-methionine to directly measure the relative flux through the SAM pathway (Figure 1G). After timing optimization of methionine labeling (Figure S1E), we chose to measure relative flux through the SAM cycle with a 90-min pulse labeling of stable isotope-labeled 13C5-methionine. While methionine uptake was not affected by genetic or physiological activation of mTORC1 (Figures 1H and S1F), the mTORC1-dependent enhanced incorporation of labeled methionine into SAM and its downstream product 5-MTA was detected in ΔTSC2 HeLa cells (Figure 1H) and in cells stimulated with insulin (Figure S1F). Furthermore, using 13C5-methionine-based isotope tracing, we confirmed mTORC1-dependent regulation of SAM synthesis in melanoma, prostate, lung, and breast cancer cell lines (Figures 1I and 1J). Taken together, these results demonstrate that mTORC1 signaling stimulates SAM synthesis from methionine consumption.
MAT2A is induced downstream of mTORC1 to sustain SAM synthesis
We next sought to elucidate the mechanisms underlying mTORC1-dependent production of SAM. The deferred timing of the inhibitory effects of rapamycin on SAM synthesis suggested that mTORC1 regulates this pathway through long-term mechanisms (Figure 2A). Transcripts of specific enzymes within the SAM cycle and the essential supporting pathways; serine/glycine synthesis, and one-carbon metabolism (Figure 2B), were mostly increased in TSC2-deficient cells compared to their wild-type counterparts and were sensitive to rapamycin treatment (Figures 2C, S2A, Tables S3 and S4). Of the genes altered by mTORC1 signaling, MAT2A and cystathionine betasynthase (CBS) were the only enzymes that also showed corresponding changes in protein abundance; their levels were increased in ΔTSC2 cells, and temporally sensitive to rapamycin (Figures 2D and S2B). Since CBS is downstream of SAM synthesis, we focused on the effects of mTORC1 on the SAM-producing enzyme MAT2A. MAT2A has two protein isoforms (α2 and α2’) (Figure 2E) which exhibit dissimilar N-terminus region, but 75.7% identity (Kotb and Kredich, 1985). MAT2A α2’ is generated from α2 through splicing mechanisms (Pendleton et al., 2017). Indeed, inhibition of pre-mRNA splicing mechanisms led to the accumulation of MAT2A α2 and the concomitant decrease of α2’ protein levels (Figure S2C). Interestingly, MAT2A splicing has been shown to be dependent on METTL16 and SAM levels. Indeed, METTL16 was shown to methylate the MAT2A hairpins and control MAT2A intron retention (Pendleton et al., 2017). We showed that mTORC1 inhibition does not significantly alter METTL16 levels in AML TSC2−/− cells, suggesting that mTORC1 does not regulate the METTL16-dependent splicing of MAT2A (Figure S2D). MAT2A total levels were broadly regulated by mTORC1 signaling in Tsc2-null mouse embryonic fibroblasts (MEFs) (Figure 2F), human kidney-derived angiomyolipoma (AML) TSC2-null cells (Figures 2G and S2D), and ΔTSC2 HEK293E cells (Figure S2E). Insulin stimulation increases MAT2A-α2 in a rapamycin-sensitive manner in HeLa cells (Figure S2F) while inhibition of mTOR complex 2 through knockdown of RICTOR in ΔTSC2 HeLa cells did not alter MAT2A protein levels (Figure S2G). Although, MAT2A α2 isoform appears more sensitive to rapamycin treatment than the spliced variant α2’, quantification of MAT2A protein levels showed significant regulation of MAT2A protein abundance by mTORC1 signaling in all the settings tested (Figures 2 and S2). Concordant with the regulation of MAT2A expression by mTORC1, ΔTSC2 HeLa cells showed increased MAT2A activity compared to their wild-type counterparts, which was reduced upon rapamycin treatment (Figures 2H and S2H). Several cancer cell lines with different driver mutations exhibited mTORC1-dependent control of MAT2A protein levels (Figures 2I and S2I). Our data suggest that mTORC1 contributes to increased MAT2A expression and activity to stimulate SAM synthesis. Collectively, these results indicate that MAT2A transcript and protein levels are directly regulated downstream of mTORC1 signaling.
Figure 2. mTORC1 signaling increases MAT2A expression.

(A) Immunoblots of ΔTSC2 HeLa cells treated with vehicle (DMSO) or with a time course of rapamycin (20 nM) and metabolite extraction was performed in parallel to measure by LC-MS/MS, S-adenosylmethionine (SAM) levels.
(B) Schematic of the methionine-SAM cycle and list of genes directly involved and associated with this pathway.
(C) Heat map of relative gene expression in serum-deprived wild-type or ΔTSC2 HeLa cells treated with vehicle (DMSO) or rapamycin (20 nM) over a time course.
(D) Immunoblots of HeLa cells treated as in (C).
(E) Immunoblots of HeLa cells transfected with siRNA targeting human MAT2A or nontargeting controls (siCtl) for 48 hours.
(F) Immunoblots of Tsc2+/+ and Tsc2−/− MEFs treated with vehicle (DMSO) or rapamycin (20 nM, 15 hours). Biological duplicates are shown.
(G) Immunoblots from human angiomyolipoma (AML) TSC2-null cell line treated with either vehicle (DMSO) or a rapamycin time course (20 nM). Biological duplicates are shown.
(H) Intracellular activity of MAT2A in wild-type or ΔTSC2 HeLa cells treated with vehicle (DMSO) or rapamycin (20 nM, 15 hours).
(I) Immunoblots of the indicated cancer cell lines treated with vehicle (DMSO) or a rapamycin time course. *P < 0.05 for multiple comparisons calculated using one-way ANOVA with Tukey’s HSD test (H).
(A, H) The data are plotted as the mean ± SDs of biological triplicates. Immunoblots (A, D-G, I) and QPCR data (C) are presented as representative of at least two independent experiments. (D-G, I) Quantification of total MAT2A protein levels (α1 and α2) over β-actin is shown.
MAT2A is transcriptionally regulated by the mTORC1-MYC axis
To identify the transcriptional mechanisms by which mTORC1 controls MAT2A expression, we measured the effects of candidate transcription factors downstream of mTORC1 on MAT2A protein and transcript levels. Of the six transcription factors tested, c-MYC depletion specifically reduced MAT2A protein (Figure 3A) and mRNA levels (Figure 3B) in ΔTSC2 HeLa cells. Chemical inhibition of c-MYC activity also reduced MAT2A protein and mRNA levels (Figure 3C). A gene expression correlation analysis deconvoluting complex expression datasets from the Cancer Cell Line Encyclopedia (CCLE) revealed a robust correlation between MAT2A and MYC expression (Figure S3A). Alignment of human, mouse, and rat MAT2A intron 1 revealed two highly conserved, consensus DNA-binding motifs for c-MYC (Figure 3D). Chromatin immunoprecipitation (ChIP) assays demonstrated that c-MYC bound to MAT2A intron 1 in ΔTSC2 cells, and this interaction was prevented by rapamycin treatment (Figure 3E). Additionally, genetic or chemical inhibition of c-MYC blocked the mTORC1-induced increase in SAM synthesis from methionine in ΔTSC2 cells (Figures 3F, S3B and S3C). Because the de novo serine/glycine pathway converges with the methionine cycle through one-carbon metabolism, which can influence upstream steps in SAM synthesis (Reina-Campos et al., 2019), we assessed the contribution of the major regulator of the serine/glycine pathway, activating transcription factor 4 (ATF4), to the regulation of SAM synthesis downstream of mTORC1. Knockdown of ATF4 did not affect incorporation of 13C from methionine into SAM and 5-MTA (Figures 3F and S3B), suggesting that the mTORC1-dependent regulation of SAM synthesis directly from methionine is independent of the mTORC1-ATF4 axis. Furthermore, c-MYC partially controlled MAT2A protein levels in cancer cell lines from different origins (Figure 3G), supporting that c-MYC mediates SAM synthesis in cancer cells (Figures 3H and S3D). Together, these data suggest that mTORC1 controls MAT2A expression and SAM synthesis, at least in part, through transcriptional mechanisms mediated by c-MYC (Figure 3I).
Figure 3. The mTORC1-cMYC axis controls MAT2A expression and SAM synthesis.

(A) HeLa ΔTSC2 cells were transfected with siRNA targeting different transcription factors, and MAT2A protein levels were assessed by immunoblots.
(B) Transcript levels of MYC and MAT2A in ΔTSC2 HeLa cells transfected with the indicated siRNAs for 48 hours.
(C) Immunoblots and MAT2A transcript levels in HeLa cells treated with either vehicle (DMSO) or MYC inhibitor (10058-F4, 50 μM, 24 hours).
(D) c-MYC binding motif and alignment of the human, mouse, and rat MAT2A intron 1.
(E) c-MYC ChIP-qPCR in serum-starved wild-type or ΔTSC2 HeLa cells treated with vehicle (DMSO) or rapamycin (20 nM) for 15 hours.
(F) Normalized peak areas of 13C-methionine-derived SAM as measured by targeted LC-MS/MS from HeLa ΔTSC2 cells transfected with the indicated siRNAs.
(G) Immunoblots of the indicated cancer cells transfected with the indicated siRNAs for 48 hours.
(H) Normalized peak areas of 13C-methionine-derived SAM measured as in (F) from the indicated cancer cell lines transfected with the indicated siRNAs for 48 hours.
(I) Mode of activation of MAT2A transcription downstream of the mTORC1-MYC axis.
(B, C, E, F, and H) The data are plotted as the mean ± SD of biological triplicates and are representative of two independent experiments (B, C, F, H). The data are plotted as the means±SEMs relative to IgG control (E). *P < 0.05 for multiple comparisons calculated using one-way ANOVA with Tukey’s HSD test (B, C, E, and F) and two-tailed Student’s t-test for pairwise comparisons (H).
(A-H) The data presented are representative of at least two independent experiments.
(A, C, G) Quantification of total MAT2A protein levels (α1 and α2) over β-actin is shown.
mTORC1 stimulates RNA methylation via regulation of m6A
Next, we evaluated the influence of mTORC1-dependent SAM synthesis on the mechanisms underlying epigenetic modifications such as DNA and histone methylation. Global DNA methylation analysis of CpG islands using bisulfite sequencing (Singer, 2019) revealed that ΔTSC2 HeLa cells exhibit a significant increase in overall DNA methylation versus wild-type counterparts (Figure S4A). However, interestingly, this increase was not blocked by rapamycin or direct inhibition of MAT2A (MAT2Ai, PF-9366) (Figures S4A and S4B) (Quinlan et al., 2017). These data suggest that the increase in DNA methylation status was independent of mTORC1 and MAT2A (Figure S4A). We also measured global histone methylation via LC-MS (Zheng et al., 2016) to assess the effects of the mTORC1-MAT2A axis on the epiproteome. mTORC1 controls H3K27 di- and trimethylation, but surprisingly, MAT2A inhibition did not exhibit changes in histone methylation similar to those observed with rapamycin treatment, suggesting that this regulation was independent of the mTORC1-MAT2A axis (Figure S4C and Table S5). Nominal changes in histone methylation were observed upon a rapamycin time course treatment (Figures S4D and S4E). To address the lack of changes in histone methylation in response to MAT2A inhibition, we treated cells with increasing doses of MAT2Ai for a prolonged time (48 hours) and evaluated lysine methylation on histones. MAT2A inhibition decreased H3K36 methylation but did not significantly alter other histone marks (Figure S4F) (Sankaran and Gozani, 2017). These data suggest that fluctuations in SAM levels in response to rapamycin or MAT2Ai treatments are not sufficient to generally alter DNA or histone methylation during the 24-hour time frame of treatment. Furthermore, we measured the effects of SAM depletion on polyamine levels (Soda, 2018), and did not observe any significant alteration of the steady-state levels of putrescine and spermidine (Figure S4G).
Given that SAM is also used to methylate RNA, we assessed whether mTORC1 and MAT2A can control RNA methylation by tracking the methyl group from radiolabeled methionine (3H-CH3) into RNA (Figure 4A). Genetic (loss of TSC2) or physiological (insulin) activation of mTORC1 induced a significant increase in global RNA labeling with radiolabeled methionine, and this effect was reduced by rapamycin or MAT2Ai treatments, suggesting that RNA is methylated downstream of mTORC1 (Figures 4B and 4C). Furthermore, RAPTOR knockdown also reduced incorporation of labeled methionine into RNA (Figure 4D). Specifically, m6A RNA abundance was increased in HeLa cells stimulated with insulin and reduced in response to mTORC1 and MAT2A inhibition (Figure 4E). Despite the low uptake of SAM (Figure S5A), supraphysiological amount of SAM (1 mM) partially restored m6A abundance in cells treated with rapamycin or MAT2A inhibitor (Figures 4F and S5B). These data suggest that the mTORC1 and MAT2A-dependent regulation of m6A RNA is partially dependent on SAM availability. Next, we measured newly synthesized adenosine methylation on RNA via LC-MS by tracking the methyl group from 13C5-methionine into RNA. We confirmed an increase in 13C-labeled 1/6N-methyladenosine on RNA in ΔTSC2 cells compared to their wild-type counterparts, and a decrease upon rapamycin and MAT2Ai treatments (Figure 4G).
Figure 4. The dynamic increase in SAM availability downstream of mTORC1 leads to RNA N6-methylation.

(A) Schematic illustration of the strategy employed to globally measure newly methylated RNA downstream of mTORC1 signaling.
(B) Relative incorporation of the radiolabel from (C3H3)-methionine into total RNA from wild-type HeLa cells grown in the absence of serum and treated with vehicle, insulin (500 nM), rapamycin (20 nM) or MAT2A inhibitor (PF-9366, 10 μM) for 24 hours.
(C) Same as in (B), but ΔTSC2 HeLa cells were grown in the absence of serum and treated with vehicle, rapamycin (20 nM) or MAT2A inhibitor (PF-9366, 10 μM) for 15 hours.
(D) Same as in (B), but HeLa cells were transfected with indicated siRNAs for 48 hours, and grown in the absence of serum and treated with vehicle (water), or insulin (500 nM) for 15 hours were performed. Immunoblotting is presented.
(E) m6A dot blot of HeLa cells grown in the absence of serum or stimulated with insulin (500 nM) and treated with vehicle, rapamycin or PF-9366 (MAT2Ai, 10 μM) for 15 hours. Methylene blue (MB) is used as a loading control.
(F) m6A dot blot of ΔTSC2 HEK293E cells grown in the absence of serum and treated with vehicle (DMSO) or rapamycin (20 nM) for 15 hours in the presence or absence of SAM (1mM).
(G) Normalized peak areas of 13C-labeled m6A derived from 13C5-methionine, measured by targeted LC-MS/MS, extracted from wild-type or ΔTSC2 HeLa cells treated with vehicle (DMSO), rapamycin (20 nM) or MAT2A inhibitor (PF-9366, 10 μM) for 15 hours.
(H) Hierarchical clustering analysis of the differentially expressed genes from ΔTSC2 HeLa cells treated with vehicle or rapamycin (20 nM) for 24 hours.
(I) GO terms enriched from differential m6A RNA transcripts in response to rapamycin (20 nM, 24 hours) in ΔTSC2 HeLa cells.
(B-D, G) The data are plotted as the mean ± SDs of biological triplicates and are representative of two independent experiments. *P < 0.05 for multiple comparisons calculated using one-way ANOVA with Tukey’s HSD test (B-D, G).
To explore the consequences of the regulation of m6A by mTORC1 signaling, we mapped the m6A methylome using methylated RNA immunoprecipitation combined with high-throughput sequencing (m6A-seq) in ΔTSC2 HeLa cells (Figures S5C–E). Hierarchical cluster analysis was performed to identify differentially expressed genes between ΔTSC2 cells treated with rapamycin or vehicle (Figure 4H). We sorted the m6A peaks that were significantly regulated in response to mTORC1 inhibition. We found that rapamycin reduced m6A modifications in the mRNA of genes involved in several anabolic processes, including phosphatidylinositol metabolism, vascular endothelial growth factor (VEGF) signaling, cell cycle phase transition, and carbohydrate metabolism (Figure 4I and Table S6). Conversely, despite a decrease in newly synthesized m6A in response to mTORC1 inhibition, some m6A modifications were enriched in the transcripts involved in cell death mechanisms (Figure 4I, Table S6 and Limitation of Study section). m6A-seq does not account for the production rate of m6A mRNA, but instead provides a snapshot of the existing m6A methylome in the cells. These findings are consistent with the pro-growth and anti-apoptotic roles of mTORC1 signaling, and the steady-state m6A methylome distribution reflects the mTORC1-dependent control of cell survival mechanisms, further validating that m6A is downstream of mTORC1 signaling.
mTORC1 signaling increases WTAP protein abundance to mediate m6A RNA-dependent protein synthesis and cell proliferation.
Next, we hypothesized that mTORC1 signaling directly affects the molecular machinery by which m6A RNA modification is catalyzed. We systematically measured the protein levels of m6A methyltransferase heterotrimeric complex WTAP-METTL3-METTL14, the regulators RBM15 and RBM15B, as well as the demethylases FTO and ALKBH5 (Figure 5A) (Zaccara et al., 2019). Among these proteins, only WTAP protein levels showed an increase in response to mTORC1 activation and a decrease following acute rapamycin treatment in ΔTSC2 HeLa (Figure 5B), AML TSC2-null cells (Figure 5C), and cancer cells (Figure S5F), suggesting that mTORC1 positively controls WTAP protein abundance. Subsequently, we asked whether WTAP protein and transcript levels respond to physiological activation of mTORC1 signaling in HeLa cells. Insulin stimulation rapidly increased WTAP protein abundance over a time course (Figure 5D), which was sensitive to rapamycin treatment (Figure S5G), while WTAP transcript levels was not significantly altered upon mTORC1 regulation (Figure 5E). We confirmed that WTAP knockdown reduced RNA methylation in ΔTSC2 HeLa cells (Figure S5H). Previous studies reported that m6A RNA modification promotes cap-dependent mRNA translation presumably via 3′ UTR methylation (Shi et al., 2017; Wang et al., 2015). Therefore, we sought to determine the relationship between m6A RNA modification and mTORC1 activity in the control of protein synthesis. Knockdown of METTL3, the catalytic subunit of the m6A RNA methyltransferase complex, led to a significant reduction in protein synthesis rate without altering mTORC1 signaling in ΔTSC2 HeLa cells (Figures 5F and S5I), suggesting that m6A RNA is required downstream of mTORC1 signaling to support protein synthesis. Since WTAP protein abundance is positively regulated by mTORC1 signaling, we tested whether WTAP knockdown could impair growth factor-induced protein synthesis. While insulin stimulation increased the protein synthesis rate by ~ 20% in cells transfected with control conditions (Straus, 1984; Timmerman et al., 2010), knockdown of WTAP diminished the basal protein synthesis rate (Figures 5G and S5J). Furthermore, WTAP knockdown in ΔTSC2 HeLa cells decreased the protein synthesis rate without altering mTORC1 signaling (Figures 5H and S5K). Consistent with the control of anabolic metabolism, WTAP knockdown decreased proliferation of cancer cell lines (Figure 5I). Collectively, these data are consistent with the concepts that the protein abundance of WTAP is positively regulated by mTORC1 signaling and that m6A is required for mTORC1-dependent control of protein synthesis and cell proliferation.
Figure 5. Activation of mTORC1 stimulates WTAP protein abundance to control m6A RNA, protein synthesis and cell proliferation.

(A) Schematic illustrating m6A RNA modification machinery. The m6A RNA methyltransferase complex comprised of METTL3, METTL14 (methyltransferase-like 3 and 14), WTAP (Wilms tumor 1-associated protein), and RBM15/B, serve as m6A “writer”, demethylases (e.g., FTO and ALKBH5) serve as m6A “erasers”.
(B) Immunoblots of wild-type and ΔTSC2 HeLa cells treated with vehicle (DMSO) or with a time-course of rapamycin (20 nM).
(C) Immunoblots of human angiomyolipoma (AML) TSC2-null cell line treated as in B.
(D) Immunoblots of HeLa cells grown in the absence of serum and treated over a time course with insulin (500 nM).
(E) WTAP transcript levels from wild-type and ΔTSC2 HeLa cells grown in the absence of serum and treated with vehicle or rapamycin at the indicated times.
(F) ΔTSC2 HeLa cells were transfected with siRNA targeting METTL3 or nontargeting controls (siCtl) for 48 hours and pulse-labeled with [35S]-methionine for the final 5 minutes. The protein synthesis rate was measured by autoradiogram, while total protein was assessed by Ponceau S staining. Quantification of the 35S signal is presented.
(G) HeLa were transfected with indicated siRNAs for 48 hours and serum-starved or stimulated with insulin for 15 hours. Cells were labeled with puromycin (10 μg/mL) for the final 10 minutes, and the protein synthesis rate was measured by chemiluminescence. Quantification of the puromycin incorporated into nascent protein is presented.
(H) ΔTSC2 HeLa cells were transfected with indicated siRNAs for 48 hours and labeled with puromycin (10 μg/ml) as in (G). Quantification of the puromycin incorporated into nascent protein is presented.
(I) Indicated cancer cells were transfected with specified siRNAs for 48 hours and were grown in media containing 10% dialyzed serum, and Cell Titer-Glo measurements were performed every 24 hours. Immunoblot for each cell line is presented.
(E-H) The data are plotted as the mean ± SDs of biological triplicates. *P < 0.05 for pairwise comparisons calculated using a two-tailed Student t-test (F, H, I) or one-way ANOVA with Tukey’s HSD test for multiple comparisons (G). Experiments are representative of at least two independent experiments. (B-D) Quantification of WTAP protein levels over β-actin is shown.
MAT2A activity is required for mTORC1-dependent protein synthesis.
Next, we conjectured that the mTORC1-dependent stimulation of MAT2A also participates in the mechanisms by which mTORC1 primes mRNA for protein synthesis. Similar to the effects of rapamycin on protein synthesis, inhibition of MAT2A activity led to a significant reduction in the protein synthesis rate (40–60%) in HeLa cells (Figure 6A) and AML TSC2-null cells (Figure S6A), without notably altering mTORC1 signaling at this time point (Figures S6A and S6B). Consistent with Gu and colleagues (Gu et al., 2017), a substantial depletion in SAM levels led to decreased mTORC1 signaling in wild-type HeLa cells (Figure S6C), however, cells lacking TSC2 remained largely insensitive to SAM depletion (Figure S6C). MAT2A knockdown also prevented insulin’s ability to stimulate protein synthesis confirming the outcome observed with the MAT2A inhibitor (Figures 6B and S6D). The anti-proteinogenic effects of MAT2Ai were also observed in a panel of cancer cell lines exhibiting high mTORC1 (Figure S6E). Knockdown of the SAM-sensor SAMTOR (Figure S6F) in ΔTSC2 HeLa cells did not affect mTORC1 signaling (Figure S6G) and did not prevent MAT2Ai to significantly decrease the protein synthesis rate in ΔTSC2 cells (Figure 6C). Interestingly, overexpression of METTL3 and METTL14 led to a significant increase in the protein synthesis rate in ΔTSC2 HEK293E cells, which was reduced when SAM was depleted (Figure 6D). These data suggest that MAT2A activity is required for the m6A RNA methyltransferase-dependent control of protein synthesis. Moreover, supplementation of SAM led to the partial, but significant, rescue in the protein synthesis rate in response to MAT2A inhibition (Figures 6E and S6H). These data suggest that SAM availability is required for protein synthesis independent of the SAM-dependent regulation of mTORC1 activity. This finding demonstrates that in addition to sensing SAM abundance (Gu et al., 2017), mTORC1 directly stimulates SAM synthesis to mediate m6A RNA for protein synthesis.
Figure 6. The mTORC1-MAT2A axis supports protein synthesis upstream of m6A.

(A) HeLa cells were grown in the absence of serum and stimulated for 15 hours with insulin (500 nM) in the presence or absence of rapamycin (20 nM) or PF-9366 (MAT2Ai, 10 μM). Cells were treated with a pulse label of [35S]-methionine for the final 5 minutes, and the protein synthesis rate was measured by autoradiogram, while total protein was assessed by Ponceau S staining. Quantification of the 35S signal is presented.
(B) HeLa cells were transfected with indicated siRNAs for 48 hours, and grown in the absence of serum for 15 hours and stimulated with insulin (500 nM) for 1 hour. Cell were labeled with puromycin (10 μg/mL) for the final 10 minutes, and the protein synthesis rate was measured by chemiluminescence while total protein was assessed by Ponceau S staining. Quantification of the puromycin incorporated into nascent protein is presented.
(C) ΔTSC2 HeLa cells were transfected with indicated siRNAs for 48 hours and treated and quantified as in (A).
(D) ΔTSC2 HEK293E cells were transfected with indicated cDNA constructs for 48 hours and treated with vehicle (DMSO) or PF-9366 (MAT2Ai, 10 μM) for 15 hours. Cells were treated and processed as in (B). Immunoblots of HeLa cells were analyzed in parallel to the experiment.
(E) ΔTSC2 HeLa cells were treated with vehicle (DMSO) or PF-9366 (MAT2Ai, 10 μM) for 6 hours in the presence or absence of SAM (2 mM) and treated and quantified as in (B).
(A-E) The data are plotted as the mean ± SDs of biological triplicates. *P < 0.05 for multiple comparisons calculated using one-way ANOVA with Tukey’s HSD test. Experiments are representative of at least two independent experiments.
MAT2A is a metabolic target in cancer and tumors with hyperactivated mTORC1 signaling
Metabolic reprogramming in cancer has commonly been considered to involve a rewiring towards anabolic processes to sustain biomass production (Hirschey et al., 2015; Vander Heiden and DeBerardinis, 2017). To define whether MAT2A could represent a metabolic dependency in mTORC1-driven tumor cells, we inhibited MAT2A in several cancer cell lines driven by different oncogenes that all activate mTORC1 signaling. We showed that MAT2A inhibition reduced cancer cell proliferation (Figure 7A) in a SAM-dependent manner (Figure 7B). Additionally, AML TSC2-null cells grown in three-dimensional (3D) cultures and treated with a MAT2A inhibitor exhibited a significant decrease in colony formation (Figure 7C). Anchorage-independent growth of cancer cells was also strikingly reduced by MAT2A inhibition (Figure 7D). Databases in The Cancer Genome Atlas (TCGA) program c-bioportal revealed that MAT2A is commonly amplified in several cancer types (Figure S7A). Moreover, MAT2A protein levels were increased in several human tumors that display high levels of mTORC1 activity relative to tumor-adjacent normal tissues (Figure 7E). High expression of MAT2A was associated with low overall survival in cancer patients (Figure S7B). Given the potent antiproliferative effects of MAT2A inhibition on several cancer cell lines, we sought to evaluate the anticancer effect of MAT2A in preclinical settings. We established a xenograft model with the breast cancer cell line CAL-51, which exhibits high sensitivity to MAT2A inhibition in vitro. Strikingly, the pharmacological inhibition of MAT2A inhibited tumor growth in the CAL-51 cancer cell line-derived xenograft model (Figures 7F and S7C). Because mutations of the pro-oncogene phosphatidylinositol-4,5-bisphosphate 3-kinase catalytic subunit alpha (PIK3CA) and the tumor suppressor p53 (TP53) lead to potent hyperactivation of mTORC1 signaling in cancer (Adams et al., 2011; Fricke et al., 2019), we then established a PIK3CA-driven breast cancer patient-derived xenograft (PDX) model bearing PIK3CAH1047R and TP53 mutations (Figure 7G). MAT2A inhibition significantly reduced breast cancer tumor growth (Figure 7H) without any significant effects on mTORC1 activity (Figure S7D). These in vivo data recapitulate the antiproliferative effects induced by SAM depletion observed in a variety of mTORC1-driven cancer cell lines. Thus, these results further demonstrate that MAT2A, through SAM production, is a crucial downstream mediator of mTORC1-dependent cell and tumor growth.
Figure 7. SAM depletion inhibits tumor growth in a breast cancer PDX model.

(A) Cancer cell lines treated with vehicle or MAT2Ai (PF-9366, 10 μM) were grown in 1% serum for 72 hours, and Cell Titer-Glo measurements were performed every 24 hours.
(B) Cancer cell lines grown in 1% serum treated with vehicle, PF-9366 (MAT2Ai, 10 μM), or PF-9366 (10 μM) in the presence of SAM (1 mM). Relative growth was measured as in (A).
(C) Soft agar colony formation assay with indicated AML cells treated with vehicle (DMSO) or MAT2Ai (PF-9366, 10 μM). Cell images were acquired at 3× magnification.
(D) Same as in (C), but colonies were from the indicated cancer cell lines.
(E) Immunoblots of human patient protein lysates from the indicated cancers. Quantification of total MAT2A protein levels (α1 and α2) over β-actin is shown.
(F) CAL-51 cells were subcutaneously injected into athymic nude mice (n=5 per group). Mice were treated with vehicle (corn oil) or FIDAS-5 (MAT2Ai, 50 mg/kg) and tumor volume was monitored over time.
(G) Experimental design for the PDX experiment.
(H) PDX of breast cancer bearing TP53 and PIK3CAH1047 mutations was subcutaneously injected into the flanks of NOD.Cg-Prkdcscid Il2rgtm1Wj1/SzJ mice. Mice were randomized 1:1 to receive vehicle (PEG/Tween 5%) or MAT2Ai (PF-9366, 50 mg/kg), and tumor volume was monitored over time.
(A-D, F, H) The data are plotted as the mean ± SDs of biological triplicates and are representative of at least two independent experiments. *P < 0.05 by one-way ANOVA with Tukey’s post hoc test for multiple comparisons and a two-tailed Student’s t-test for pairwise comparisons.
Discussion
The anabolic mechanisms controlled by mTORC1 in cells are ATP-consuming processes that enhance and adjust the activity of proteins involved in the complex control of metabolic processes, including protein, lipid, and nucleotide synthesis (Ben-Sahra and Manning, 2017; Dibble and Manning, 2013; Saxton and Sabatini, 2017). Whether mTORC1 can utilize key metabolites to influence biomolecule synthesis remains largely unknown. This study shows that the mTORC1-MYC-MAT2A axis, via the regulation of SAM levels, promotes anabolic mechanisms to preserve cell growth. The transcription factor c-MYC participates to the control of MAT2A expression, which was previously shown to be regulated by SIRT1 in a MYC-dependent manner in mouse embryonic stem cells (Tang et al., 2017). The stimulation of SAM synthesis by the mTORC1-MAT2A axis mediates RNA methylation to increase protein synthesis and cell proliferation. Previous work has shown that a major function of mTORC1 is to control general protein synthesis, but also the selective translation of a family of mRNAs that are defined by a 5′ terminal oligopyrimidine (TOP) motif (Hsieh et al., 2012; Jefferies et al., 1994; Thoreen et al., 2012). Together with the known regulatory effects of mTORC1 on 4E-BP1/eiF4E cap-dependent mRNA translation (Choo et al., 2008; Thoreen et al., 2012), our study extends our understanding of the molecular effects of mTORC1 on global protein synthesis through the control of SAM and m6A RNA modification, therefore underpinning the canonical function of mTORC1 in the control of this anabolic process.
The regulation of WTAP by mTORC1 represents one mechanism by which m6A mRNA modification is regulated in proliferating cells in response to oncogenic and physiological signals. Similar to our results, mTORC1 was shown to directly stimulate global m6A mRNA levels through the control of WTAP mRNA translation mediated by S6K and eIF4A/4B (cite Sungyun Cho and Blenis). While the temporal mechanisms by which the mTORC1 network controls MAT2A and WTAP levels are distinct, the output from these regulatory nodes must be synergistic to maintain effective m6A and mRNA translation.
The m6A-seq dataset reflects a combination of m6A mRNA levels and mRNA expression, therefore preventing the discernment of the direct m6A modifications mediated by the mTORC1-WTAP axis from the indirect mTORC1-dependent transcriptional regulation. Nevertheless, our m6A-seq analysis identified the m6A mRNA and transcripts that were the most decreased upon mTORC1 inhibition were involved in the VEGF pathway, a canonical target of HIF1-α, a well-established transcription factor positively controlled by mTORC1 signaling (Düvel et al., 2010). This finding is consistent with m6A being required to stabilize HIF1-α-dependent transcripts downstream of the hypoxic signal (Fry et al., 2017). m6A transcripts that were the most increased upon mTORC1 inhibition include apoptosis-related processes supporting the notion that mTORC1 inhibition prime cells for apoptosis (Preuss et al., 2013). Recurrent methylation and demethylation of RNA could occur downstream of mTORC1. Regardless of the dynamic changes in m6A RNA, it is conceivable that RNA methylation patterns could be preserved throughout cancer cell generations, but such mechanisms would require coordinated regulation of gene expression, DNA methylation, and chromatin states.
RNA methyltransferases have been reported to promote carcinogenesis in different types of cancer. Indeed, METTL3 is highly expressed in human lung and colon adenocarcinoma tissues compared to normal tissues (Lin et al., 2016). Therefore, targeting m6A RNA modification in cancer is an emerging strategy to effectively diminish tumor growth and progression. Targeting the methionine cycle has also appeared as an innovative therapeutic strategy for cancer treatment (Luengo et al., 2017; Sanderson et al., 2019). Our study explored the ramifications of MAT2A in mTORC1-driven tumor cells, which link the methionine cycle to methylation processes. Our results showed that MAT2A inhibition leads to a decrease in SAM levels and RNA methylation, inhibiting mTORC1-dependent protein synthesis, and cancer cell proliferation. Therefore, combination therapies using MAT2A or RNA methyltransferase inhibitors and potentially low doses of mTOR inhibitors (rapalogs) (Hua et al., 2019; Magaway et al., 2019; Mossmann et al., 2018) might also be a promising strategy for targeting cancers with increased mTORC1 signaling.
Three implications can be deduced from the fact that the mTORC1 pathway coordinates the methionine cycle activity with RNA methylation processes: 1) mTORC1 senses cellular SAM availability through SAMTOR to facilitate, when needed, the synthesis of SAM required for m6A RNA and protein synthesis; 2) SAM can become limiting under certain dietary conditions, especially nutrient scarcity, leading to a decrease in m6A RNA and protein synthesis; and 3) the adaptation of mTORC1-regulated metabolic pathways under these conditions is necessary for maintaining organismal homeostasis. Indeed, diets restricted in methionine diminish SAM levels in tissue, improve insulin sensitivity, reduce cancer risk, and prolong lifespan in rodents (Ables and Johnson, 2017; Gao et al., 2019; Lopez-Otin et al., 2016; Miller et al., 2005). It is exciting to speculate that these benefits could be recapitulated by directly targeting MAT2A and m6A downstream of mTORC1 signaling. Future studies should explore the physiological relevance of mTORC1-induced m6A, therapeutic targeting of MAT2A, and m6A RNA effects on aging and age-associated diseases.
Limitation of Study
The m6A RNA methyltransferase complex has been implicated in the control of various RNA processing (Alarcón et al., 2015) such as RNA splicing (Bartosovic et al., 2017; Horiuchi et al., 2013), localization, and degradation (Geula et al., 2015; Ke et al., 2017). Therefore, it is possible that mTORC1 regulates other RNA processing mechanisms through the control of m6A abundance in cancer cells and in cell settings that do not rely on a high protein synthesis rate for cell proliferation. Moreover, we cannot exclude other potential mTORC1-dependent regulation of specific mRNA and rRNA methylation patterns through mechanisms involving direct posttranslational, translational or transcriptional control of proteins associated with the m6A RNA methyltransferase complex.
While our study sheds light on the control of m6A mRNA by mTORC1 signaling, some questions remain to be answered. Indeed, the m6A-seq analysis revealed that many hypermethylated transcripts were increased in response to mTORC1 inhibition. Some of these transcripts belong to the mRNA translation machinery. It is tempting to query about the compensatory mechanisms that explain the increase of m6A transcripts in response to mTORC1 inhibition. Possibly, these m6A transcripts were methylated prior to rapamycin treatment, then translational and transcriptional effects downstream of mTORC1 led to compensatory mechanisms to mediate an increase of these transcripts. It is also interesting to point out that among the m6A transcripts hypermethylated upon rapamycin treatment, we detected 4E-BP1 (Table S6), an inhibitor of mRNA translation downstream of mTORC1. These results correlate with inhibitory effects on mRNA translation in response to mTORC1 inhibition. How m6A is installed on specific mRNA downstream of mTORC1 remains to be elucidated. Future work is required to dissect the breadth of molecular mechanisms downstream of mTORC1 signaling in the specific regulation of m6A mRNA transcripts, and the effects of mTORC1 on m6A rRNA and its effect on mRNA translation.
STAR Methods
RESOURCE AVAILABILITY
Lead Contact
Further information and requests for resources and reagents should be directed to and will be fulfilled by the Lead Contact, Issam Ben-Sahra (issam.ben-sahra@northwestern.edu).
Materials Availability
All reagents generated in this study are available from the Lead Contact without restriction.
Data and Code Availability
The image dataset supporting the current study have been deposited in a public repository; Mendeley Data: http://dx.doi.org/10.17632/wnh653n3xb.1. The m6A RNA-seq dataset generated in this study is available at GEO: GSE165690.
EXPERIMENTAL MODEL AND SUBJECT DETAILS
Details of cell lines used have been provided under section “Cell Lines and Tissue Culture” and details of mice used have been provided under “Xenograft Experiments and Breast cancer PDX model”.
Cell Lines and Tissue Culture
HeLa, SK-MEL-28, and PC3 cell lines were obtained from American Type Culture Collection (ATCC) and CAL-51 cells were obtained from DSMZ. The Human TSC2-null 621-101 angiomyolipoma cell line was derived from a kidney of a LAM patient (Siroky et al., 2012). The AML 621-102 and 621-103 cell lines stably transfected with an empty vector and TSC2 vector, respectively, and the wild-type and knockout Tsc2 MEFs were generously provided by Dr. David Kwiatkowski (Brigham and Women’s Hospital). AML 621-102 and 621-103 cells were cultured with penicillin-streptomycin (100 U/mL) and Fungizone (2.5 g/mL). The 105K cells, derived from a Tsc2+/− C57BL/6 mouse renal tumor, originally derived from a renal tubular cystadenoma of a C57BL/6 Tsc2+/− mouse, then passaged through immunodeficient mice as described previously (Atochina-Vasserman et al., 2015) were kindly provided by Dr. Brendan Manning (Harvard T.H. Chan School of Public Health). HEK293E cells were kindly provided by Dr. John Blenis (Weill Cornell Medicine). HeLa, HEK293E, MEFs, SK-MEL-28, PC3, AML 621-102, and 621-103 cell lines were cultured in DMEM with 25 mM glucose (CellGro), 10% Fetal bovine serum (FBS), 37°C, and 5% CO2. CAL-51 were cultured in comparable medium but with 20% FBS. Media were changed to serum free, 15 hours prior to metabolite extraction, RNA methylation assay. Viable cells were counted using a TC-20 Automated Cell Counter (Bio-Rad).
Xenograft Experiments
Groups of 5-week-old athymic nude mice (Female) were injected subcutaneously in the flank with 5 × 10⁶ breast cancer cells, CAL-51 in a 1:1 mixture of Matrigel and PBS. When tumors reached a size of approximately 80 mm3, the mice were treated with either vehicle (corn oil) or MAT2A inhibitor (FIDAS-5, 50 mg/kg). Either FIDAS-5 or the vehicle were given through the intraperitoneal route three times per week for 26 days.
Tumor size was monitored twice per week and were assessed in three dimensions using a caliper. All experiments were completed in accordance with appropriate guidelines and regulations. All animal procedures and studies were approved by the Institutional Animal Care and Use Committee (IACUC) at Northwestern University.
Breast cancer PDX model
Patient-derived xenograft (PDX) of triple negative breast cancer (TNBC) (ID: NUBC07) bearing TP53 and PIK3CA mutations obtained from the PDX repository of the Northwestern Developmental Therapeutics center. All animal handling and experimental protocols were approved by the Institutional Animal Care and Use Committee (IACUC) at Northwestern University. Briefly, TNBC PDX tumors were resected, and then transplanted into the flank of two donor NOD.Cg-Prkdcscid Il2rgtm1Wjl/SzJ mice (Female). After adequate growth, tumors were resected, washed, trypsinized and minced in PBS at 150 mg/ml and 200 μl of tumor suspension were subcutaneously injected into the flank of ten athymic nude mice (Female). When the tumors were palpable (day 14 after injection), five mice per group were randomized to the control (Tween 0.5%, PEG) or MAT2A inhibitor treatment (PF-9633, 50 mg/kg) for six weeks. Tumor size was monitored two times per week until the end point.
METHOD DETAILS
CRISPR/Cas9, siRNA and plasmids
To generate TSC2 knockout in HeLa and HEK293E, small guide RNA (sgRNA) sequence targeting the -second exon of TSC2 was cloned into the PX458 CRISPR (Addgene, Plasmid # 48138) vector using the following oligonucleotide:
Forward: CACCGAACAATCGCATCCGGATGAT
Reverse: AAACATCATCCGGATGCGATTGTTC
48 hours after transfection, GFP positive cells were sorted into 96-well plates as single cell per well. Clonal cells were screened by immunoblotting with anti-TSC2 antibody. For siRNA experiments, nontargeting control pool (D-001810-10-20), RAPTOR (L-004107-00-0005), c-MYC (L-003282-02-0005), MAT2A (L-008818-00-0005), ATF4 (L-005125-00-0005), PPARγ (L-003436-00-0005), SREBF1 (L-006891-00-0005), SREBF2 (L-009549-00-0005), HSF1 (L-012109-02-0005), HSF2 (L-011874-00-0005), SAMTOR (L-016990-02-005), METTL3 (L-005170-02-0005), WTAP (L-017323-00-0005), and RICTOR (L-016984-00-0005) siRNAs (On TARGETplus SMARTpool) were acquired from Dharmacon and used at 35 nM (final concentration) with 6 μL of Lipofectamine RNAimax (Thermo fisher scientific # 13778150) (6-well plate) for each condition. The following plasmid constructs were used in this study; 1436 pcDNA3 Flag HA (Addgene #10792), pcDNA3/Flag-METTL3 (Addgene #53739), and pcDNA3/Flag-METTL14 (Addgene $53740). Cells were transfected with siRNA or plasmids for 48 hours before proceeding to specific treatments.
Metabolite profiling for targeted steady state and flux analyses
To determine the relative abundances of intracellular metabolites, extracts were prepared and analyzed by LC-MS/MS. Briefly, for targeted steady-state samples, metabolites were extracted on dry ice with 4-mL 80% methanol (−80°C), as described previously (Weinberg et al., 2019; Yuan et al., 2019). Insoluble material was pelleted by centrifugation at 3000 g for 5 min, followed by two consecutive extractions of the insoluble pellet with 0.5-ml 80% methanol, with centrifugation at 20,000 g for 5 min. The 5-ml metabolite extract from the pooled supernatants was dried down under nitrogen gas using the N-EVAP (Organomation, Inc, Associates). 50% acetonitrile was added to the samples for reconstitution following by vortexing for 30 sec. Samples solution was centrifuged 20,000 g for 30 min at 4 °C. Supernatant was collected for LC-MS analysis. For isotope tracing experiments, cells were seeded in biological triplicate (~80% confluent), washed once with serum-free DMEM and then incubated in methionine-free medium (US Biological, D9812-06) containing 200 μM 13C5-methionine for 90 min and metabolites were extracted as described in the steady-state studies (Yuan et al., 2019). For both, steady-state and tracing experiments, samples were analyzed by High-Performance Liquid Chromatography and High-Resolution Mass Spectrometry and Tandem Mass Spectrometry (HPLC-MS/MS). In detail, the LC-MS/MS system is comprised of a Thermo Q-Exactive in line with an electrospray ionization (ESI) source and an Ultimate3000 (Thermo) series HPLC consisting of a binary pump, degasser, and auto-sampler outfitted with a Xbridge Amide column (Waters; dimensions of 2.3 mm × 100 mm and a 3.5 μm particle size). The mobile phase A contained 95% (vol/vol) water, 5% (vol/vol) acetonitrile, 10 mM ammonium hydroxide, 10 mM ammonium acetate, pH = 9.0; B was 100% Acetonitrile. The gradient was as following: 0 min, 15% A; 2.5 min, 30% A; 7 min, 43% A; 16 min, 62% A; 16.1–18 min, 75% A; 18–25 min, 15% A with a flow rate of 150 μL/min. The capillary of the ESI source was arranged for 275 °C, with sheath gas at 35 arbitrary units, auxiliary gas at 5 arbitrary units and the spray voltage at 4.0 kV. In positive/negative polarity switching mode, an m/z scan range from 60 to 900 was chosen and MS1 data was collected at a resolution of 70,000. The automatic gain control (AGC) target was set at 1 × 10⁶ and the maximum injection time was 200 ms. The top 5 precursor ions were then fragmented, in a data-dependent manner, using the higher energy collisional dissociation (HCD) cell set to 30% normalized collision energy in MS2 at a resolution power of 17,500. Besides matching m/z, metabolites are identified by matching either retention time with analytical standards and/or MS2 fragmentation pattern. Data acquisition and analysis were carried out by Xcalibur 4.1 software and Tracefinder 4.1 software, respectively (both from Thermo Fisher Scientific). Metabolomic Pathway Analysis was calculated using MetaboAnalyst software (https://www.metaboanalyst.ca/) (Chong et al., 2019).
Immunoblotting
To extract proteins, cells were lysed in ice-cold Triton lysis buffer (40 mM HEPES, pH 7.4, 120 mM NaCl, 1 mM EDTA, 1% Triton X-100, 10 mM glycerol 2-phosphate, 10 mM sodium pyrophosphate, 0.5 mM sodium orthovanadate and 50 mM NaF; 1 μM Microcystin-LR and protease inhibitor cocktail were added prior to the lysis of cells) and incubated on ice for 30 min. Lysates were centrifuged at 20,000 × g for 15 min at 4°C. Protein concentrations were quantified by Bradford assay and protein lysates were normalized for each experiment. Identical amounts of protein lysates (~10 to 15 μg) were prepared with the loading buffer (Laemmli buffer), incubated at 95°C on heat block for 5 min and separated on SDS-PAGE and transferred onto nitrocellulose blotting membranes. Membranes were blocked in 5% milk in TBST (50 mM Tris pH 7.4, 150 mM NaCl, 0.1% Tween 20) and incubated overnight at 4°C with the indicated primary antibodies followed by incubation with horseradish peroxidase (HRP)-tagged anti-rabbit or anti-mouse secondary antibodies for one hour. Protein bands were developed with chemiluminescent substrates (Thermo fisher scientific # 34577, #34095). In all immunoblotting experiments, β-actin was used as a loading control. Human Normal Skin (NLH-18), Skin Tumor (TLH-18), Normal Breast (NHL-13), Breast Tumor (TLH-13), Normal Uterus (NLH-11) and Uterus Tumor (TLH-11) protein lysates were obtained from G-biosciences.
Chromatin Immunoprecipitation (ChIP)
Chromatin immunoprecipitation assays were performed using a ChIP kit (Cell Signaling Technology, #9004S) according to the manufacturer’s instructions. Briefly, ~ 4 × 10⁶ wild-type and HeLa ΔTSC2 cells treated as indicated, were fixed with formaldehyde for 10 min at room temperature, harvested and lysed in the provided buffer. Chromatin was chemically fragmented using Micrococcal Nuclease (37°C, 15 min). 10% of the fragmented chromatin was kept as input and the remaining was subjected to immunoprecipitation with control IgG, and MYC CST antibodies overnight at 4°C. Protein A/G agarose was added for 2 hours and the beads were washed with provided buffers. Bound DNA was eluted, subjected to reverse crosslinking and recovered using the DNA Clean-Up Column and then subjected to Quantitative Real-Time PCR with MAT2A intron1 primers. The relative occupancy of MYC at the given locus was calculated by normalization to the DNA present in ChIP with control IgG. Primer sequences used for q-PCR of intron regions of human MAT2A genes are as follows:
MAT2A intron 1:
Forward 5’- ------3’: CGTCTGACAAACCTGGAGTG
Reverse 5’------3’: GATACCACATGCGGCAAAC
Modified reduced representation bisulfite sequencing (mRRBS)
Genomic DNA was extracted from wild-type and ΔTSC2 HeLa cells treated as indicated in the text. mRRBS (Singer, 2019; Walter et al., 2018) was performed as previously described on 50–200 ng of genomic DNA beginning with restriction endonuclease digestion with MspI (New England Biolabs). The digested DNA fragments were then size selected for fragments ~100–250 bp in length with solid phase reversible immobilization (SPRI) beads (MagBio Genomics). Bisulfite conversion was performed using the EZ DNA Methylation-Lightning Kit (Zymo Research) per the manufacturer’s protocol. Bisulfite conversion efficiency was observed at 99.1% ± 0.1% (SD), which we estimated by the measured frequency of unmethylated CpGs in λ-bacteriophage DNA (New England BioLabs, #N3013S) added at a 1:200 mass ratio to each sample. We then prepared libraries using the Pico Methyl-Seq Library Prep Kit (Zymo Research), and six pooled libraries per run were sequenced on an Illumina NextSeq 500 instrument using the NextSeq 500/550 V2 High Output reagent kit (1 × 75 cycles). Raw data processing and analysis were conducted using bcl2fastq v2.17.1.14 for demultiplexing, Trim Galore! v0.4.3 for standard quality filtering and trimming (10 bp from the 5’ end), Bismark v0.16.3 for sequence alignment to the hg38 (GRCh38) reference genome and subsequent methylation extraction (ignoring one base at the 3’ end), the DSS v2.30.1 R/Bioconductor package for statistical hypothesis testing at the level of single CpGs with quantification from the SeqMonk platform with the bisulfite feature methylation pipeline (Douillet et al., 2020; Helmin et al., 2020; McGrath-Morrow et al., 2018; Morales-Nebreda et al., 2021). Code sets used for processing are provided in (Singer, 2019).
Analysis of Histone methylation by LC-MS
Nuclei were purified from frozen cell pellets with Nuclear Isolation Buffer (NIB) [15 mM Tris-HCl (pH 7.5), 60 mM KCl, 15 mM NaCl, 5 mM MgCl2, 1 mM CaCl2, 250 mM Sucrose, 0.3% NP-40; 1 mM DTT, 1:100, and 10 mM sodium butyrate added instantaneously prior to use] for 30 min on ice. Nuclei were pellet at 600 × g for 5 min at 4 °C, and washed twice with NIB without NP-40. Histones were extracted with 5 volumes of 0.2 M H2SO4 for 1 hour at room temperature (RT) and insoluble cellular debris were removed by centrifugation at 4,000 × g for 5 min. Trichloroacetic acid (TCA), at a final concentration of 20% (v/v), was added to the supernatant to precipitate soluble histones for 1 hour at RT. Histones were pelleted at 10,000 × g for 5 min, washed once with 0.1% HCl in acetone then twice with 100% acetone with centrifugation at 15,000 × g for 5 min. Histones were dried briefly in a fume hood and stored at −20 °C until derivatization. Propionylation and digestion were performed according to Garcia et al (Garcia et al., 2007) with the modification of employing just one round of propionylation for 1 hour prior to and following digestion. Targeted LC-MS/MS was performed on a Thermo TSQ Quantiva (Thermo Scientific) and raw data were analyzed in Skyline (MacLean et al., 2010) according to published methods (Camarillo et al., 2019).
RNA methylation analysis
Cells (~80% confluent) were serum starved for 15 hours, then treated and labeled as indicated in the figure legends. Cells were labeled with 5 μCi of L-[Methyl-3H]-Methionine (NET061X250UC, Perkin Elmer) for 15 hours in the presence of cycloheximide (20 μM) to circumvent a biased consumption of methionine for mRNA translation, a process canonically stimulated by mTORC1 signaling. Cells were harvested and RNA was isolated using RNeasy kit (Qiagen, 74104) with DNase treatment according to the manufacturer’s instructions. RNA was quantified using a spectrophotometer. 60 μl of eluted RNA or rRNA were added to scintillation vials and radioactivity was measured by liquid scintillation counting and normalized to the RNA concentrations, respectively. All conditions were analyzed with biological triplicates and representative of at least two independent experiments.
The protocol for RNA acid hydrolysis was developed from methods presented by (Liberman et al., 2020). Cells (80% confluence) were labeled with U-13C5-methionine for 15 hours in the in DMEM methionine-free and RNA was extracted. Briefly, 5 μg of RNA was digested by nuclease S1 and treated with the alkaline phosphatase and filtered to eliminate the macromolecules. 100 μl of digested nucleic acid were obtained and were transferred to LC-MS vials for LC-MS analysis.
Analysis of m6A level using dot-blot assay
Isolated RNA was first denatured by heating at 95 °C for 5 min, followed by chilling on ice directly. Two-fold serial dilutions were spotted on an Amersham Hybond-N+ membrane optimized for nucleic acid transfer (GE Healthcare, RPN203B). After UV crosslinking in a Stratagene Stratalinker 2400 UV Crosslinker, the membrane was washed by 1×TBST buffer, blocked with 5% of non-fat milk in TBS tween 0.1%, and incubated with anti-m6A antibody (1:500; CST #56593) overnight at 4 °C. After incubating with horseradish peroxidase (HRP)-conjugated anti-rabbit IgG secondary antibody, the membrane was visualized by ECL Western Blotting Detection Kit (Thermo). To ensure an equal amount of RNA was spotted on the membrane, the same blot was stained with 0.02% methylene blue in 0.3 M sodium acetate (pH 5.2).
m6A immunoprecipitation and m6A-seq analysis
m6A RNA immunoprecipitation was performed according to published procedure (Dominissini et al., 2012). Human m6A-seq data from ΔTSC2 HeLa cells were aligned to the hg19 transcriptome. To locate m6A peaks, the hg19 transcriptome was divided into 25 nucleotide-wide tiles. The number of reads in the m6A immunoprecipitation (IP) and non-IP (control) sample was counted in each tile, and a p-value was calculated using Fisher’s exact test and adjusted for multiple testing. Tiles with significant enrichment of the m6A signal (adjust-P value < = 0.05) were merged into larger regions. Regions lesser than 100 bp were discarded, and regions over 200 bp were separated into 100 to 200 bp sub-regions; the m6A signal from rapamycin-treated cells compared to control (DMSO) was calculated for each region; and regions with at least a two-fold enrichment in all replicates were identified as m6A peaks. The distributions of m6A peaks and m6A marked genes were identified by overlapping all m6A peaks with the hg19 RefGene annotation (Meng et al., 2014). GO term analysis was then performed using R package enrich GO. m6A-seq analysis was performed in collaboration with LC Sciences, LLC. Reactome pathway analysis (https://reactome.org/) was performed to identify the mTORC1-m6A-regulated biological processes with significant enrichment as shown in Figures 4H and 4I.
Protein synthesis assay
For measurements of relative rates of protein synthesis, cells seeded in 6-well plates were treated as indicated, then washed twice and changed to methionine-free DMEM (methionine/glutamine-free DMEM [US Biological, D9812-06] with L-glutamine added back) for 30 min, then changed to the same medium containing 50 μCi/mL [35S]-methionine (PerkinElmer, NEG009L005MC) for 5 min or with puromycin (10 μg/ml) for the final 10 min. Cells were washed twice in ice cold PBS and lysed in Triton 1% buffer (40 mM HEPES, pH 7.4, 120 mM NaCl, 1 mM EDTA, 1% Triton X-100, 10 mM glycerol 2-phosphate, 10 mM sodium pyrophosphate, 0.5 mM sodium orthovanadate and 50 mM NaF; 1 μM Microcystin-LR and protease inhibitor cocktail were added prior to the lysis of cells). Samples were normalized by protein concentration, separated by SDS-PAGE, transferred to nitrocellulose membrane and analyzed by autoradiogram and subsequent immunoblot. MAT2A protein, S6K and S6 phosphorylation bands were quantified using image J. Relative rates of protein synthesis were quantified using ImageJ analysis of the entire lane for each sample on scanned autoradiograms and plotted as percent of untreated cells, averaged from 3 independent samples.
mRNA expression analysis
For gene expression analysis, total cellular RNA was isolated (RNeasy kit, Qiagen, 74104) from the indicated cells grown in the specified conditions and reverse-transcription (SuperScript II kit) was performed. The resulting cDNA was diluted in DNase free water (1:20) before quantification by real-time PCR. Data are expressed as the ratio between gene of interest expression and RPLP0 for human or 36B4 for mouse. The primers used for quantitative real-time PCR are indicated in Table S4.
Methionine and S-adenosylmethionine uptake
Methionine and S-adenosylmethionine uptake were measured using a modification of the amino acid uptake protocol of Edinger and Thompson (Edinger and Thompson, 2002). Briefly, HeLa, A549, CAL-51 and PC3 cells were cultured in serum-free DMEM for 15 hours and 50 μL of uptake medium containing 4 μCi of L-[methyl-3H]-methionine or S-[methyl-3H]-adenosylmethionine was added. Cells were allowed to take up radiolabeled molecule for 5 min at 37°C. The uptake was stopped by washing the cells twice in ice cold PBS and lysing them in Triton 1% buffer (40 mM HEPES, pH 7.4, 120 mM NaCl, 1 mM EDTA, 1% Triton X-100, 10 mM glycerol 2-phosphate, 10 mM sodium pyrophosphate, 0.5 mM sodium orthovanadate and 50 mM NaF; protease inhibitor cocktail were added prior to the lysis of cells). Samples were centrifuged at 20,000 g and 4°C for 15 min. 75% of the supernatant was added to scintillation vials and radioactivity was measured by liquid scintillation counting (c.p.m) and normalized to the protein concentrations. Data points for are presented as the mean of triplicate samples ± S.D.
Methionine adenosyltransferase Activity assay
Methionine adenosyltransferase Activity was measured according to the instructions provided by the manufacturer (Biovision, K2033). Briefly, ~ 5 × 10⁶ cells were homogenized on ice in 500 μl ice-cold MAT Assay Buffer and centrifuged 10,000 g at 4°C for 15 min. The supernatant is collected and kept on ice. 20 uL of samples is added to in a clear, flat-bottom 96-well plate and the volume is adjusted to 50 uL with MAT Assay buffer. The 96-well plate is preincubated at 37°C for 10 min to allow for temperature equilibration. The Reaction Mix (Detection Enzyme Mix, Detection Cofactor Mix, MAT substrate Mix, Developer Mix, MAT probe, MAT Assay Buffer) and Sample Background Mix is prepared and 50 μl of Reaction Mix is added to the sample. Absorbance at 570 nm in kinetic mode for 60 min at 37°C was measured. Methionine Adenosyltransferase (MAT) Specific Activity = = nmol/min/mg ≡ mU/mg, where: B is the quantity of metabolite produced, calculated from the Standard Curve (in nmole) DT is the linear phase reaction time T2 – T1 (in min), and P is the amount of protein added to the sample well (in mg).
Cell proliferation
Cancer cell lines (SK-MEL-28, PC3, A549, and CAL-51) were seeded in 96-well plates at density of 3000 cells per well in media containing 5% FBS (fetal bovine serum) treated with vehicle (DMSO) or MAT2A inhibitor (PF-9366, 10 μM) in the presence or absence of exogenous S-adenosylmethionine (1mM). The same cancer cell lines were transfected with siRNA targeting WTAP or nontargeting controls for 48 hours and seeded in 96-well plates at density of 3000 cells per well in media containing 10% dialyzed FBS. Cell proliferation was measured using CellTiter-Glo® every 24 hours. The data were normalized to day 0. All cell proliferation assays were performed in biological triplicates seeded in technical quadruplicates for each condition.
Soft agar colony formation assay
The cancer cell lines (SK-MEL-28, PC3, A549 and CAL-51) and the human angiomyolipoma TSC2 null (621-102) or TSC2-addback (621-103) cells were employed for soft agar assays. 5000 cells in 1.5 ml of growth media (DMEM with 5% dFBS) containing 0.3% agarose were seeded in 12-well plates with a bottom layer of 0.6% agarose (1ml, prepared in same media as top layer). An additional 0.5 ml growth media was poured over top layer, once a week. After 7 weeks, colonies were stained with 0.2 ml of 1 mg/ml of thiazolyl Blue Tetrazolium Bromide solution for 5 hours. Number of Colonies was quantified using ImageJ software (Schneider et al., 2012) and represented as average of technical triplicates. Images shown in the manuscript (Figure 7D) are representative of biological triplicates from three independent experiments.
MAT2A Intron1 sequence alignment
Intron 1 sequences from Homo sapiens, Mus musculus and Rattus norvegicus were found in ENSEMBL Genome Browser (https://useast.ensembl.org/index.html) and aligned with Clustal Omega (Sievers and Higgins, 2014).
Overall survival analysis of cancer patients with differentially expressed MAT2A
Kaplan-Meier Plotter (KM plotter, http://kmplot.com/analysis/) gathers publicly available data from depositories such as Gene Expression Omnibus (GEO), European Genome-Phenome Archive (EGA), and The Cancer Genome Atlas’ (TCGA). With a total of 64 datasets from 21 cancer types. PostgreSQL server handles the gene expression and clinical data concomitantly. To inspect the prognostic value of MAT2A mRNA expression, Pan-cancer RNA-seq database was used to evaluate the overall survival of cancer patients (n=7462). To analyze the prognostic value of the MAT2A gene, the patient samples are split into two groups according to various quantile expressions of the proposed biomarker. The two patient cohorts showing differential gene expression were compared by a Kaplan-Meier survival plot, and the hazard ratio with 95% confidence intervals and logrank P values were calculated.
Publicly available MAT2A data
Genomic alteration frequency of MAT2A in human cancer was obtained from cBioPortal (https://www.cbioportal.org) (Cerami et al., 2012; Gao et al., 2013) using the TCGA PanCancer Atlas studies (32 studies, 10967 samples).
QUANTIFICATION AND STATISTICAL ANALYSIS
One-way ANOVA followed by Tukey’s post hoc tests were performed in GraphPad Prism 7.0 to determine differences between each group when more than two conditions were present. A two-tailed Student’s t tests were performed in Microsoft Excel 2016 for two pairwise comparisons. A nonparametric Kolmogorov-Smirnov test was performed to quantify the distance between the cumulative distribution function of the methylated DNA between each condition. All error bars represent standard deviation (SD). A value of P < 0.05 was considered significant. The number of independent experiments done is described in each figure legend.
Supplementary Material
Excel spreadsheet: Table S1. LC-MS/MS Peak areas (Ranked by P-values pairwise comparisons). Related to Figure 1.
Excel spreadsheet: Table S2. LC-MS/MS Peak areas (Ranked by P-values pairwise comparisons). Related to Figure S1.
Excel spreadsheet: Table S5. Histone methylation abundance downstream of mTORC1 and MAT2A activity. Related to Figures 4 and S4.
Excel spreadsheet: Table S6. List of m6A modification patterns along with 6524 transcripts and their enriched Gene Ontology (GO) terms of biological process. Related to Figure 4.
| REAGENT or RESOURCE | SOURCE | IDENTIFIER |
|---|---|---|
| Antibodies | ||
| MAT2A Antibody | Proteintech Group | Cat# 55309-1-AP |
| MAT2B Antibody | Proteintech Group | Cat# 15952-1-AP; RRID: AB_10637268 |
| Phospho-p70 S6 Kinase (Thr389) (108D2) Rabbit mAb | Cell Signaling Technology | Cat# 9234S; RRID:AB_2269803 |
| Rabbit Anti-p70 S6 Kinase Monoclonal Antibody | Cell Signaling Technology | Cat# 2708S; RRID:AB_390722 |
| Phospho-S6 Ribosomal Protein (Ser240/244) Antibody | Cell Signaling Technology | Cat# 2215S; RRID:AB_331682 |
| S6 Ribosomal Protein (5G10) Rabbit mAb | Cell Signaling Technology | Cat# 2217S; RRID:AB_331355 |
| Phospho-Akt (Ser473) (D9E) Rabbit mAb | Cell Signaling Technology | Cat# 11962; RRID:AB_2797780 |
| Akt (pan) (C67E7) Rabbit mAb | Cell Signaling Technology | Cat# 4691, RRID:AB_915783 |
| Phospho-NDRG1 (Thr346) (D98G11) Rabbit mAb | Cell Signaling Technology | Cat# 8947; RRID:AB_2797683 |
| NDRG1 Antibody | Proteintech Group | Cat# 26902-1-AP |
| 4E-BP1 Antibody | Cell Signaling Technology | Cat# 9452S RRID:AB_331692 |
| Raptor (24C12) Rabbit mAb | Cell Signaling Technology | Cat# 2280S RRID:AB_561245 |
| Tuberin/TSC2 (D93F12) XP® Rabbit mAb | Cell Signaling Technology | Cat# 4308S; RRID:AB_10547134 |
| Rictor (D16H9) Rabbit mAb | Cell Signaling Technology | Cat# 9476; RRID:AB_10612959 |
| SAHH Antibody (A-11) | Santa Cruz Biotechnology | Cat# sc-271389; RRID:AB_10612213 |
| CBS Antibody | Proteintech Group | Cat# 14787-1-AP; RRID:AB_2070970 |
| Gamma Cystathionase (CTH) Antibody | Proteintech Group | Cat# 12217-1-AP; RRID:AB_2087497 |
| DHFR Antibody | Proteintech Group | Cat# 15194-1-AP; RRID:AB_2091587 |
| SHMT1 (D3B3J) Rabbit mAb | Cell Signaling Technology | Cat# 80715S; RRID:AB_2799957 |
| SHMT2 Antibody | Cell Signaling Technology | Cat# 12762S; RRID:AB_2798018 |
| MTHFR Antibody | Proteintech Group | Cat# 66612-1-Ig; |
| MTR Antibody | Proteintech Group | Cat# 25896-1-AP |
| BHMT Antibody | Proteintech Group | Cat# 15965-1-AP; RRID:AB_2290472 |
| c-MYC antibody | Cell Signaling Technology | Cat# 9402S; RRID:AB_2151827 |
| ATF-4 (D4B8) Rabbit mAb | Cell Signaling Technology | Cat# 11815; RRID:AB_2616025 |
| PPARγ (D69) Antibody | Cell Signaling Technology | Cat# 2430 |
| SREBP-1 Antibody (2A4) | Santa Cruz Biotechnology | Cat# sc-13551; RRID:AB_628282 |
| HSF1 (D3L8I) Rabbit mAb | Cell Signaling Technology | Cat#12972; RRID:AB_2798072 |
| HSF2 (3E2) Antibody | Santa Cruz Biotechnology | Cat# sc-13517; RRID:AB_627754 |
| Mono-Methyl-Histone H3 (Lys4) (D1A9) XP® Rabbit mAb | Cell Signaling Technology | Cat# 5326S; RRID:AB_10695148 |
| Di-Methyl-Histone H3 (Lys4) (C64G9) Rabbit mAb | Cell Signaling Technology | Cat# 9725S; RRID:AB_10205451 |
| Tri-Methyl-Histone H3 (Lys4) (C42D8) Rabbit mAb | Cell Signaling Technology | Cat# 9751S; RRID:AB_2616028 |
| Tri-Methyl-Histone H3 (Lys27) (C36B11) | Cell Signaling Technology | Cat# 9733S; RRID:AB_2616029 |
| Tri-Methyl-Histone H3 (Lys36) (D5A7) XP® Rabbit mAb #4909 | Cell Signaling Technology | Cat# 4909S; RRID:AB_1950412 |
| Histone H3 (D1H2) XP® Rabbit mAb | Cell Signaling Technology | Cat# 4499S; RRID:AB_10544537 |
| SCD1 Antibody | Cell Signaling Technology | Cat# 2438; RRID: AB_823634 |
| METTL3 (E3F2A) Rabbit mAb | Cell Signaling Technology | Cat# 86132S; RRID:AB_2800072 |
| METTL14 Antibody | Proteintech Group | Cat# 26158-1-AP; RRID:AB_2800447 |
| ALKBH5 Antibody | Proteintech Group | Cat# 16837-1-AP; RRID:AB_2242665 |
| WTAP Antibody | Bethyl Laboratories | Cat # A301-436A; RRID:AB_961140 |
| RBM15 Antibody | Proteintech Group | Cat# 10587-1-AP; RRID:AB_2175757 |
| RBM15B Antibody | Proteintech Group | Cat# 22249-1-AP |
| FTO Antibody | Proteintech Group | Cat# 27226-1-AP; |
| Puromycin Antibody, clone 12D10 | Millipore | Cat# MABE343 RRID:AB_2566826 |
| N6-Methyladenosine (m6A) (D9D9W) Rabbit mAb | Cell Signaling Technology | Cat# 56593; RRID:AB_2799515 |
| Normal Rabbit IgG | Cell Signaling Technology | Cat# 2729; RRID:AB_1031062 |
| Anti-mouse IgG, HRP-linked Antibody | Cell Signaling Technology | Cat#7076; RRID:AB_330924 |
| Anti-rabbit IgG, HRP-linked Antibody | Cell Signaling Technology | Cat#7074; RRID:AB_2099233 |
| β-actin Antibody | Sigma-Aldrich | A5316; RRID: AB_476743 |
| Bacterial and Virus Strains | ||
| NEB Stable Competent E. coli | NEB | C3040 |
| DH5 alpha | Fisher Scientific | 18258012 |
| Biological Samples | ||
| Human Normal Breast Genlysate | G-Biosciences | NLH-13 |
| Human Breast Tumor Genlysate | G-Biosciences | TLH-13 |
| Human Normal Uterus Genlysate | G-Biosciences | NLH-11 |
| Human Tumor Uterus Genlysate | G-Biosciences | TLH-11 |
| Human Normal Skin Genlysate | G-biosciences | NLH-18 |
| Human Skin Tumor Genlysate | G-biosciences | TLH-18 |
| Chemicals, Peptides, and Recombinant Proteins | ||
| DMSO | Sigma-Aldrich | D2650-100ML |
| Rapamycin | Calbiochem/Sigma-Aldrich | 553210 |
| Torin 1 | Tocris Bioscience | 4247 |
| PF-9366 | MedChemExpress | HY-107778 |
| MAT2A Inhibitor II, FIDAS-5 | Millipore/Sigma-Aldrich | 50-417-30001 |
| Insulin human | Alpha diagnostic | INSL16-N-5 |
| L-glutamine | Corning | MT25005Cl |
| 2-mercaptoethanol | Sigma-Aldrich | M6250-100ML |
| L-Methionine-13C5 | Cambridge Isotope Laboratories | CLM-893-H-0.05 |
| L-[Methyl-3H]-Methionine,>97%, 1 mCi (37 MBq) | Perkin Elmer | NET061X001MC |
| Methionine [35S] | PerkinElmer | NEG009L005MC |
| Puromycin dichloride | Santa Cruz | sc-108071A |
| S-(5’-Adenosyl)-L-methionine chloride dihydrochloride | Sigma-Aldrich | A7007-100MG |
| thiazolyl Blue Tetrazolium Bromide | Sigma-Aldrich | M5655 |
| Polyethylenimine (PEI) | Polysciences | 23966-2 |
| Opti-MEM media | Thermo Fisher | 31985062 |
| Glutamine-free DMEM | Gibco | 11960-044 |
| Zeocin | InvivoGen | ant-zn-05 |
| Amphotericin B solubilized | Sigma-Aldrich | A9528 |
| Lipofectamine 3000 Transfection reagent | Invitrogen | L3000008 |
| Lipofectamine RNAi max | Invitrogen | 13778150 |
| SuperSignal™ West Femto Chemiluminescent | Thermo Fisher scientific | PI34096 |
| SuperSignal™ West Pico PLUS | Thermo Fisher scientific | PI34580 |
| DMEM | Corning CellGro | 10-017-CV |
| DMEM without methionine and L-glutamine | US Biological | D9812-06 |
| Fetal bovine serum (FBS) | Sigma-Aldrich | F2442 |
| Fetal Bovine Serum dialyzed | Sigma-Aldrich | F0392 |
| Microcystin-LR | Fisher Scientific | ALX350012C500 |
| Protease inhibitor cocktail | Sigma-Aldrich | P8340 |
| Acrylamide Protogel 30% | Fisher Scientific | EC-890 |
| Bio-Rad Braford | Bio-Rad | 5000006 |
| PCR plates | Bio-Rad | HSP9601 |
| UltraPure LMP Agarose | Invitrogen | 16520-050 |
| Methylene Blue | Sigma-Aldrich | M9140-25G |
| MspI | New England Biolabs | R0106S |
| Critical Commercial Assays | ||
| RNeasy Mini Kit | Qiagen | 74104 |
| HiSpeed Plasmid Maxi Kit (25) | Qiagen | 12663 |
| CellTiter-Glo Luminescent Cell Viability Assay | Promega | G7573 |
| SimpleChIP® Plus Enzymatic Chromatin IP Kit (Agarose Beads) | Cell Signaling Technology | 9004S |
| Methionine Adenosyltransferase Activity Assay Kit (Colorimetric) | Biovision | K2033 |
| MagQuant™ Plus DNA Kit | MagBio Genomics | MQP-50096 |
| EZ DNA Methylation-Lightning Kit | Zymo Research | D5030 |
| Pico Methyl-Seq Library Prep Kit | Zymo Research | D5455 |
| Deposited Data | ||
| A study of Villa et al. Unprocessed file | Mendeley Data | http://dx.doi.org/10.17632/wnh653n3xb.1 |
| m6A-seq | GEO Profiles, NCBI | GSE165690 |
| Experimental Models: Cell Lines | ||
| HEK293E | John Blenis lab (Weill Cornell Medicine) | N/A |
| ΔTSC2 HEK293E | This study | N/A |
| HeLa | ATCC | CCL-2 |
| ΔTSC2 HeLa | This study | N/A |
| A549 | ATCC | CCL-185 |
| SK-MEL-28 | ATCC | HTB-72 |
| CAL51 | DSMZ | ACC 302 |
| PC3 | ATCC | CRL-1435 |
| 105K | Brendan Manning (Harvard University) | N/A |
| AML 621-102 (TSC2-null-Empty Vector) | Dr. David Kwiatkowski (Brigham and Women's Hospital) | N/A |
| AML 621-103 (TSC2-null-TSC2 Addback) | Dr. David Kwiatkowski (Brigham and Women's Hospital) | N/A |
| Mouse Embryonic Fibroblasts (MEFs) | David Kwiatkowski (Brigham and Women's Hospital) | N/A |
| Experimental Models: Organisms/Strains | ||
| Breast cancer PDX model | PDX repository Northwestern University | NUBC07 |
| Athymic nude Foxn1nu | The Jackson laboratory | 002019 |
| Oligonucleotides | ||
| See Table S4 for list of primers used in this study | Integrated DNA Technologies | |
| siRNA targeting human MYC | Dharmacon | L-003282-02-0005 |
| siRNA targeting human RPTOR | Dharmacon | L-004107-00-0005 |
| siRNA targeting human RICTOR | Dharmacon | L-016984-00-0005 |
| siRNA targeting human MAT2A | Dharmacon | L-008818-00-0005 |
| siRNA targeting human ATF4 | Dharmacon | L-005125-00-0005 |
| siRNA targeting human PPARG | Dharmacon | L-003436-00-0005 |
| siRNA targeting human SREBF1 | Dharmacon | L-006891-00-0005 |
| siRNA targeting human SREBF2 | Dharmacon | L-009549-00-0005 |
| siRNA targeting human HSF1 | Dharmacon | L-012109-02-0005 |
| siRNA targeting human HSF2 | Dharmacon | L-011874-00-0005 |
| siRNA targeting human SAMTOR | Dharmacon | L-016990-02-0005 |
| siRNA targeting human METTL3 | Dharmacon | L-005170-02-0005 |
| siRNA targeting human WTAP | Dharmacon | L-017323-00-0005 |
| Non-targeting siRNA pool | Dharmacon | D-001810-10-20 |
| Recombinant DNA | ||
| pcDNA3 Flag HA | Addgene | #10792 |
| pcDNA3/Flag-METTL3 | Addgene | #53739 |
| pcDNA3/Flag-METTL14 | Addgene | #53740 |
| λ-bacteriophage DNA | New England Biolabs | N3013S |
| Software and Algorithms | ||
| ImageJ | Schneider et al., 2012 | RRID: SCR_003070 |
| Prism 7 | Prism | https://www.graphpad.com/scientific-software/prism/ |
| MetaboAnalyst | Chong et al., 2019 | RRID:SCR_015539 |
| TraceFinder 4.1 SP2 Software | Thermo Fisher | https://www.thermofisher.com/us/en/home/industrial/mass-spectrometry/liquid-chromatography-mass-spectrometry-lc-ms/lc-ms-software/lc-ms-data-acquisition-software/tracefinder-software.html |
| Other | ||
| Multipurpose Scintillation Counter | Beckman | Model: LS 6500 |
| Microplate Reader | Tecan | Infinite M1000 Pro |
| Nitrocellulose membrane 0.2 μm | GE Healthcare | 10600001 |
| Hybond-N+ membrane | GE Healthcare | RPN203B |
| Centrifuge Bottles Polycarbonate | Beckman Coulter | 355603 |
Highlights:
mTORC1 signaling stimulates S-adenosylmethionine synthesis.
The mTORC1-MYC axis controls MAT2A expression.
mTORC1 increases SAM levels and WTAP abundance to promote N6-methylation of mRNA.
MAT2A activity is required to support protein synthesis and tumor growth.
Acknowledgments
We would like to thank Dr. Yongchao Ma (Northwestern University) for discussions, Zhiyi Liu (LC Sciences, LLC, TX) for the m6A-seq analysis, and the Mendillo lab for the HSF1/2 antibodies. This work was supported by the Developmental Therapeutics Core at Northwestern University and the Robert H. Lurie Comprehensive Cancer Center support grant (NCI CA060553), the Northwestern proteomics core, and by grants from the National Institutes of Health R00CA194192-04, R01GM135587 (I.B.-S.), K08HL128867 and R01HL149883 (B.D.S.) and the LAM Foundation Career Development Award LAM0127C01-18 (I.B.-S.). E.V. is supported by the Tuberous Sclerosis Alliance postdoctoral fellowship (SP0057487), and was awarded the Philippe Foundation, and Servier Institute prizes.
Footnotes
Declaration of Interests
The authors declare no conflict of interest.
Publisher's Disclaimer: This is a PDF file of an unedited manuscript that has been accepted for publication. As a service to our customers we are providing this early version of the manuscript. The manuscript will undergo copyediting, typesetting, and review of the resulting proof before it is published in its final form. Please note that during the production process errors may be discovered which could affect the content, and all legal disclaimers that apply to the journal pertain.
References
- Ables GP, and Johnson JE (2017). Pleiotropic responses to methionine restriction. Exp Gerontol 94, 83–88. [DOI] [PubMed] [Google Scholar]
- Adams JR, Xu K, Liu JC, Agamez NM, Loch AJ, Wong RG, Wang W, Wright KL, Lane TF, Zacksenhaus E, et al. (2011). Cooperation between Pik3ca and p53 mutations in mouse mammary tumor formation. Cancer research 71, 2706–2717. [DOI] [PubMed] [Google Scholar]
- Alarcón CR, Lee H, Goodarzi H, Halberg N, and Tavazoie SF (2015). N6-methyladenosine marks primary microRNAs for processing. Nature 519, 482–485. [DOI] [PMC free article] [PubMed] [Google Scholar]
- Albers E (2009). Metabolic characteristics and importance of the universal methionine salvage pathway recycling methionine from 5’-methylthioadenosine. IUBMB Life 61, 1132–1142. [DOI] [PubMed] [Google Scholar]
- Atochina-Vasserman EN, Abramova E, James ML, Rue R, Liu AY, Ersumo NT, Guo CJ, Gow AJ, and Krymskaya VP (2015). Pharmacological targeting of VEGFR signaling with axitinib inhibits Tsc2-null lesion growth in the mouse model of lymphangioleiomyomatosis. Am J Physiol Lung Cell Mol Physiol 309, L1447–1454. [DOI] [PMC free article] [PubMed] [Google Scholar]
- Bartosovic M, Molares HC, Gregorova P, Hrossova D, Kudla G, and Vanacova S (2017). N6-methyladenosine demethylase FTO targets pre-mRNAs and regulates alternative splicing and 3’-end processing. Nucleic acids research 45, 11356–11370. [DOI] [PMC free article] [PubMed] [Google Scholar]
- Ben-Sahra I, Howell JJ, Asara JM, and Manning BD (2013). Stimulation of de novo pyrimidine synthesis by growth signaling through mTOR and S6K1. Science 339, 1323–1328. [DOI] [PMC free article] [PubMed] [Google Scholar]
- Ben-Sahra I, Hoxhaj G, Ricoult SJH, Asara JM, and Manning BD (2016). mTORC1 induces purine synthesis through control of the mitochondrial tetrahydrofolate cycle. Science 351, 728–733. [DOI] [PMC free article] [PubMed] [Google Scholar]
- Ben-Sahra I, and Manning BD (2017). mTORC1 signaling and the metabolic control of cell growth. Curr Opin Cell Biol 45, 72–82. [DOI] [PMC free article] [PubMed] [Google Scholar]
- Camarillo JM, Swaminathan S, Abshiru NA, Sikora JW, Thomas PM, and Kelleher NL (2019). Coupling Fluorescence-Activated Cell Sorting and Targeted Analysis of Histone Modification Profiles in Primary Human Leukocytes. J Am Soc Mass Spectrom 30, 2526–2534. [DOI] [PMC free article] [PubMed] [Google Scholar]
- Castillo-Aguilera O, Depreux P, Halby L, Arimondo PB, and Goossens L (2017). DNA Methylation Targeting: The DNMT/HMT Crosstalk Challenge. Biomolecules 7. [DOI] [PMC free article] [PubMed] [Google Scholar]
- Cerami E, Gao J, Dogrusoz U, Gross BE, Sumer SO, Aksoy BA, Jacobsen A, Byrne CJ, Heuer ML, Larsson E, et al. (2012). The cBio cancer genomics portal: an open platform for exploring multidimensional cancer genomics data. Cancer discovery 2, 401–404. [DOI] [PMC free article] [PubMed] [Google Scholar]
- Chen XY, Zhang J, and Zhu JS (2019). The role of m(6)A RNA methylation in human cancer. Mol Cancer 18, 103. [DOI] [PMC free article] [PubMed] [Google Scholar]
- Chong J, Wishart DS, and Xia J (2019). Using MetaboAnalyst 4.0 for Comprehensive and Integrative Metabolomics Data Analysis. Curr Protoc Bioinformatics 68, e86. [DOI] [PubMed] [Google Scholar]
- Choo AY, Yoon SO, Kim SG, Roux PP, and Blenis J (2008). Rapamycin differentially inhibits S6Ks and 4E-BP1 to mediate cell-type-specific repression of mRNA translation. Proceedings of the National Academy of Sciences of the United States of America 105, 17414–17419. [DOI] [PMC free article] [PubMed] [Google Scholar]
- Condon KJ, and Sabatini DM (2019). Nutrient regulation of mTORC1 at a glance. J Cell Sci 132. [DOI] [PMC free article] [PubMed] [Google Scholar]
- De Luca A, Maiello MR, D’Alessio A, Pergameno M, and Normanno N (2012). The RAS/RAF/MEK/ERK and the PI3K/AKT signalling pathways: role in cancer pathogenesis and implications for therapeutic approaches. Expert Opin Ther Targets 16 Suppl 2, S17–27. [DOI] [PubMed] [Google Scholar]
- Dibble CC, and Manning BD (2013). Signal integration by mTORC1 coordinates nutrient input with biosynthetic output. Nature cell biology 15, 555–564. [DOI] [PMC free article] [PubMed] [Google Scholar]
- Dominissini D, Moshitch-Moshkovitz S, Schwartz S, Salmon-Divon M, Ungar L, Osenberg S, Cesarkas K, Jacob-Hirsch J, Amariglio N, Kupiec M, et al. (2012). Topology of the human and mouse m6A RNA methylomes revealed by m6A-seq. Nature 485, 201–206. [DOI] [PubMed] [Google Scholar]
- Douillet D, Sze CC, Ryan C, Piunti A, Shah AP, Ugarenko M, Marshall SA, Rendleman EJ, Zha D, Helmin KA, et al. (2020). Uncoupling histone H3K4 trimethylation from developmental gene expression via an equilibrium of COMPASS, Polycomb and DNA methylation. Nat Genet 52, 615–625. [DOI] [PMC free article] [PubMed] [Google Scholar]
- Ducker GS, and Rabinowitz JD (2017). One-Carbon Metabolism in Health and Disease. Cell Metab 25, 27–42. [DOI] [PMC free article] [PubMed] [Google Scholar]
- Düvel K, Yecies JL, Menon S, Raman P, Lipovsky AI, Souza AL, Triantafellow E, Ma Q, Gorski R, Cleaver S, et al. (2010). Activation of a metabolic gene regulatory network downstream of mTOR complex 1. Molecular cell 39, 171–183. [DOI] [PMC free article] [PubMed] [Google Scholar]
- Edinger AL, and Thompson CB (2002). Akt maintains cell size and survival by increasing mTOR-dependent nutrient uptake. Mol Biol Cell 13, 2276–2288. [DOI] [PMC free article] [PubMed] [Google Scholar]
- Fricke SL, Payne SN, Favreau PF, Kratz JD, Pasch CA, Foley TM, Yueh AE, Van De Hey DR, Depke MG, Korkos DP, et al. (2019). MTORC1/2 Inhibition as a Therapeutic Strategy for PIK3CA Mutant Cancers. Mol Cancer Ther 18, 346–355. [DOI] [PMC free article] [PubMed] [Google Scholar]
- Fry NJ, Law BA, Ilkayeva OR, Holley CL, and Mansfield KD (2017). N(6)-methyladenosine is required for the hypoxic stabilization of specific mRNAs. Rna 23, 1444–1455. [DOI] [PMC free article] [PubMed] [Google Scholar]
- Gao J, Aksoy BA, Dogrusoz U, Dresdner G, Gross B, Sumer SO, Sun Y, Jacobsen A, Sinha R, Larsson E, et al. (2013). Integrative analysis of complex cancer genomics and clinical profiles using the cBioPortal. Sci Signal 6, pl1. [DOI] [PMC free article] [PubMed] [Google Scholar]
- Gao X, Sanderson SM, Dai Z, Reid MA, Cooper DE, Lu M, Richie JP Jr., Ciccarella A, Calcagnotto A, Mikhael PG, et al. (2019). Dietary methionine influences therapy in mouse cancer models and alters human metabolism. Nature 572, 397–401. [DOI] [PMC free article] [PubMed] [Google Scholar]
- Garcia BA, Mollah S, Ueberheide BM, Busby SA, Muratore TL, Shabanowitz J, and Hunt DF (2007). Chemical derivatization of histones for facilitated analysis by mass spectrometry. Nat Protoc 2, 933–938. [DOI] [PMC free article] [PubMed] [Google Scholar]
- Geula S, Moshitch-Moshkovitz S, Dominissini D, Mansour AA, Kol N, Salmon-Divon M, Hershkovitz V, Peer E, Mor N, Manor YS, et al. (2015). Stem cells. m6A mRNA methylation facilitates resolution of naïve pluripotency toward differentiation. Science (New York, NY) 347, 1002–1006. [DOI] [PubMed] [Google Scholar]
- Gu X, Orozco JM, Saxton RA, Condon KJ, Liu GY, Krawczyk PA, Scaria SM, Harper JW, Gygi SP, and Sabatini DM (2017). SAMTOR is an S-adenosylmethionine sensor for the mTORC1 pathway. Science 358, 813–818. [DOI] [PMC free article] [PubMed] [Google Scholar]
- Helmin KA, Morales-Nebreda L, Acosta MAT, Anekalla KR, Chen SY, Abdala-Valencia H, Politanska Y, Cheresh P, Akbarpour M, Steinert EM, et al. (2020). Maintenance DNA methylation is essential for regulatory T cell development and stability of suppressive function. J Clin Invest 130, 6571–6587. [DOI] [PMC free article] [PubMed] [Google Scholar]
- Hirschey MD, DeBerardinis RJ, Diehl AME, Drew JE, Frezza C, Green MF, Jones LW, Ko YH, Le A, Lea MA, et al. (2015). Dysregulated metabolism contributes to oncogenesis. Seminars in cancer biology 35 Suppl, S129–s150. [DOI] [PMC free article] [PubMed] [Google Scholar]
- Horiuchi K, Kawamura T, Iwanari H, Ohashi R, Naito M, Kodama T, and Hamakubo T (2013). Identification of Wilms’ tumor 1-associating protein complex and its role in alternative splicing and the cell cycle. The Journal of biological chemistry 288, 33292–33302. [DOI] [PMC free article] [PubMed] [Google Scholar]
- Hsieh AC, Liu Y, Edlind MP, Ingolia NT, Janes MR, Sher A, Shi EY, Stumpf CR, Christensen C, Bonham MJ, et al. (2012). The translational landscape of mTOR signalling steers cancer initiation and metastasis. Nature 485, 55–61. [DOI] [PMC free article] [PubMed] [Google Scholar]
- Hua H, Kong Q, Zhang H, Wang J, Luo T, and Jiang Y (2019). Targeting mTOR for cancer therapy. J Hematol Oncol 12, 71. [DOI] [PMC free article] [PubMed] [Google Scholar]
- Huang J, and Manning BD (2008). The TSC1-TSC2 complex: a molecular switchboard controlling cell growth. Biochem J 412, 179–190. [DOI] [PMC free article] [PubMed] [Google Scholar]
- Jefferies HB, Reinhard C, Kozma SC, and Thomas G (1994). Rapamycin selectively represses translation of the “polypyrimidine tract” mRNA family. Proceedings of the National Academy of Sciences of the United States of America 91, 4441–4445. [DOI] [PMC free article] [PubMed] [Google Scholar]
- Jin B, Li Y, and Robertson KD (2011). DNA methylation: superior or subordinate in the epigenetic hierarchy? Genes Cancer 2, 607–617. [DOI] [PMC free article] [PubMed] [Google Scholar]
- Ke S, Pandya-Jones A, Saito Y, Fak JJ, Vågbø CB, Geula S, Hanna JH, Black DL, Darnell JE Jr., and Darnell RB (2017). m(6)A mRNA modifications are deposited in nascent pre-mRNA and are not required for splicing but do specify cytoplasmic turnover. Genes & development 31, 990–1006. [DOI] [PMC free article] [PubMed] [Google Scholar]
- Klein Geltink RI, and Pearce EL (2019). The importance of methionine metabolism. Elife 8. [DOI] [PMC free article] [PubMed] [Google Scholar]
- Kondo Y (2009). Epigenetic cross-talk between DNA methylation and histone modifications in human cancers. Yonsei Med J 50, 455–463. [DOI] [PMC free article] [PubMed] [Google Scholar]
- Kotb M, and Kredich NM (1985). S-Adenosylmethionine synthetase from human lymphocytes. Purification and characterization. The Journal of biological chemistry 260, 3923–3930. [PubMed] [Google Scholar]
- Liberman N, O’Brown ZK, Earl AS, Boulias K, Gerashchenko MV, Wang SY, Fritsche C, Fady PE, Dong A, Gladyshev VN, et al. (2020). N6-adenosine methylation of ribosomal RNA affects lipid oxidation and stress resistance. Science advances 6, eaaz4370. [DOI] [PMC free article] [PubMed] [Google Scholar]
- Lin S, Choe J, Du P, Triboulet R, and Gregory RI (2016). The m(6)A Methyltransferase METTL3 Promotes Translation in Human Cancer Cells. Molecular cell 62, 335–345. [DOI] [PMC free article] [PubMed] [Google Scholar]
- Liu J, Eckert MA, Harada BT, Liu SM, Lu Z, Yu K, Tienda SM, Chryplewicz A, Zhu AC, Yang Y, et al. (2018). m(6)A mRNA methylation regulates AKT activity to promote the proliferation and tumorigenicity of endometrial cancer. Nat Cell Biol 20, 1074–1083. [DOI] [PMC free article] [PubMed] [Google Scholar]
- Locasale JW (2013). Serine, glycine and one-carbon units: cancer metabolism in full circle. Nature reviews Cancer 13, 572–583. [DOI] [PMC free article] [PubMed] [Google Scholar]
- Long MD, Smiraglia DJ, and Campbell MJ (2017). The Genomic Impact of DNA CpG Methylation on Gene Expression; Relationships in Prostate Cancer. Biomolecules 7. [DOI] [PMC free article] [PubMed] [Google Scholar]
- Lopez-Otin C, Galluzzi L, Freije JMP, Madeo F, and Kroemer G (2016). Metabolic Control of Longevity. Cell 166, 802–821. [DOI] [PubMed] [Google Scholar]
- Luengo A, Gui DY, and Vander Heiden MG (2017). Targeting Metabolism for Cancer Therapy. Cell chemical biology 24, 1161–1180. [DOI] [PMC free article] [PubMed] [Google Scholar]
- Ma JZ, Yang F, Zhou CC, Liu F, Yuan JH, Wang F, Wang TT, Xu QG, Zhou WP, and Sun SH (2017). METTL14 suppresses the metastatic potential of hepatocellular carcinoma by modulating N(6) -methyladenosine-dependent primary MicroRNA processing. Hepatology 65, 529–543. [DOI] [PubMed] [Google Scholar]
- MacLean B, Tomazela DM, Shulman N, Chambers M, Finney GL, Frewen B, Kern R, Tabb DL, Liebler DC, and MacCoss MJ (2010). Skyline: an open source document editor for creating and analyzing targeted proteomics experiments. Bioinformatics 26, 966–968. [DOI] [PMC free article] [PubMed] [Google Scholar]
- Maddocks OD, Labuschagne CF, Adams PD, and Vousden KH (2016). Serine Metabolism Supports the Methionine Cycle and DNA/RNA Methylation through De Novo ATP Synthesis in Cancer Cells. Mol Cell 61, 210–221. [DOI] [PMC free article] [PubMed] [Google Scholar]
- Magaway C, Kim E, and Jacinto E (2019). Targeting mTOR and Metabolism in Cancer: Lessons and Innovations. Cells 8. [DOI] [PMC free article] [PubMed] [Google Scholar]
- Mahmoud AM, and Ali MM (2019). Methyl Donor Micronutrients that Modify DNA Methylation and Cancer Outcome. Nutrients 11. [DOI] [PMC free article] [PubMed] [Google Scholar]
- McEneaney LJ, and Tee AR (2019). Finding a cure for tuberous sclerosis complex: From genetics through to targeted drug therapies. Adv Genet 103, 91–118. [DOI] [PubMed] [Google Scholar]
- McGrath-Morrow SA, Ndeh R, Helmin KA, Chen SY, Anekalla KR, Abdala-Valencia H, D’Alessio FR, Collaco JM, and Singer BD (2018). DNA methylation regulates the neonatal CD4(+) T-cell response to pneumonia in mice. J Biol Chem 293, 11772–11783. [DOI] [PMC free article] [PubMed] [Google Scholar]
- Mehrmohamadi M, Mentch LK, Clark AG, and Locasale JW (2016). Integrative modelling of tumour DNA methylation quantifies the contribution of metabolism. Nat Commun 7, 13666. [DOI] [PMC free article] [PubMed] [Google Scholar]
- Mendoza MC, Er EE, and Blenis J (2011). The Ras-ERK and PI3K-mTOR pathways: cross-talk and compensation. Trends Biochem Sci 36, 320–328. [DOI] [PMC free article] [PubMed] [Google Scholar]
- Meng J, Lu Z, Liu H, Zhang L, Zhang S, Chen Y, Rao MK, and Huang Y (2014). A protocol for RNA methylation differential analysis with MeRIP-Seq data and exomePeak R/Bioconductor package. Methods 69, 274–281. [DOI] [PMC free article] [PubMed] [Google Scholar]
- Menon S, Dibble CC, Talbott G, Hoxhaj G, Valvezan AJ, Takahashi H, Cantley LC, and Manning BD (2014). Spatial control of the TSC complex integrates insulin and nutrient regulation of mTORC1 at the lysosome. Cell 156, 771–785. [DOI] [PMC free article] [PubMed] [Google Scholar]
- Miller RA, Buehner G, Chang Y, Harper JM, Sigler R, and Smith-Wheelock M (2005). Methionine-deficient diet extends mouse lifespan, slows immune and lens aging, alters glucose, T4, IGF-I and insulin levels, and increases hepatocyte MIF levels and stress resistance. Aging Cell 4, 119–125. [DOI] [PMC free article] [PubMed] [Google Scholar]
- Miousse IR, Pathak R, Garg S, Skinner CM, Melnyk S, Pavliv O, Hendrickson H, Landes RD, Lumen A, Tackett AJ, et al. (2017). Short-term dietary methionine supplementation affects one-carbon metabolism and DNA methylation in the mouse gut and leads to altered microbiome profiles, barrier function, gene expression and histomorphology. Genes Nutr 12, 22. [DOI] [PMC free article] [PubMed] [Google Scholar]
- Miranda-Goncalves V, Lameirinhas A, Henrique R, and Jeronimo C (2018). Metabolism and Epigenetic Interplay in Cancer: Regulation and Putative Therapeutic Targets. Front Genet 9, 427. [DOI] [PMC free article] [PubMed] [Google Scholar]
- Morales-Nebreda L, Helmin KA, Torres Acosta MA, Markov NS, Hu JY, Joudi AM, Piseaux-Aillon R, Abdala-Valencia H, Politanska Y, and Singer BD (2021). Aging imparts cell-autonomous dysfunction to regulatory T cells during recovery from influenza pneumonia. JCI Insight. [DOI] [PMC free article] [PubMed] [Google Scholar]
- Mossmann D, Park S, and Hall MN (2018). mTOR signalling and cellular metabolism are mutual determinants in cancer. Nature reviews Cancer 18, 744–757. [DOI] [PubMed] [Google Scholar]
- Niu Y, Zhao X, Wu YS, Li MM, Wang XJ, and Yang YG (2013). N6-methyl-adenosine (m6A) in RNA: an old modification with a novel epigenetic function. Genomics Proteomics Bioinformatics 11, 8–17. [DOI] [PMC free article] [PubMed] [Google Scholar]
- Pavlova NN, and Thompson CB (2016). The Emerging Hallmarks of Cancer Metabolism. Cell metabolism 23, 27–47. [DOI] [PMC free article] [PubMed] [Google Scholar]
- Pendleton KE, Chen B, Liu K, Hunter OV, Xie Y, Tu BP, and Conrad NK (2017). The U6 snRNA m(6)A Methyltransferase METTL16 Regulates SAM Synthetase Intron Retention. Cell 169, 824–835 e814. [DOI] [PMC free article] [PubMed] [Google Scholar]
- Preuss E, Hugle M, Reimann R, Schlecht M, and Fulda S (2013). Pan-mammalian target of rapamycin (mTOR) inhibitor AZD8055 primes rhabdomyosarcoma cells for ABT-737-induced apoptosis by down-regulating Mcl-1 protein. The Journal of biological chemistry 288, 35287–35296. [DOI] [PMC free article] [PubMed] [Google Scholar]
- Quinlan CL, Kaiser SE, Bolanos B, Nowlin D, Grantner R, Karlicek-Bryant S, Feng JL, Jenkinson S, Freeman-Cook K, Dann SG, et al. (2017). Targeting S-adenosylmethionine biosynthesis with a novel allosteric inhibitor of Mat2A. Nat Chem Biol 13, 785–792. [DOI] [PubMed] [Google Scholar]
- Razin A, and Cedar H (1991). DNA methylation and gene expression. Microbiol Rev 55, 451–458. [DOI] [PMC free article] [PubMed] [Google Scholar]
- Reina-Campos M, Linares JF, Duran A, Cordes T, L’Hermitte A, Badur MG, Bhangoo MS, Thorson PK, Richards A, Rooslid T, et al. (2019). Increased Serine and One-Carbon Pathway Metabolism by PKClambda/iota Deficiency Promotes Neuroendocrine Prostate Cancer. Cancer cell. [DOI] [PMC free article] [PubMed] [Google Scholar]
- Robitaille AM, Christen S, Shimobayashi M, Cornu M, Fava LL, Moes S, Prescianotto-Baschong C, Sauer U, Jenoe P, and Hall MN (2013). Quantitative phosphoproteomics reveal mTORC1 activates de novo pyrimidine synthesis. Science (New York, NY) 339, 1320–1323. [DOI] [PubMed] [Google Scholar]
- Salmond RJ (2018). mTOR Regulation of Glycolytic Metabolism in T Cells. Front Cell Dev Biol 6, 122. [DOI] [PMC free article] [PubMed] [Google Scholar]
- Sanderson SM, Gao X, Dai Z, and Locasale JW (2019). Methionine metabolism in health and cancer: a nexus of diet and precision medicine. Nature reviews Cancer 19, 625–637. [DOI] [PubMed] [Google Scholar]
- Sankaran SM, and Gozani O (2017). Characterization of H3.3K36M as a tool to study H3K36 methylation in cancer cells. Epigenetics 12, 917–922. [DOI] [PMC free article] [PubMed] [Google Scholar]
- Saxton RA, and Sabatini DM (2017). mTOR Signaling in Growth, Metabolism, and Disease. Cell 168, 960–976. [DOI] [PMC free article] [PubMed] [Google Scholar]
- Schneider CA, Rasband WS, and Eliceiri KW (2012). NIH Image to ImageJ: 25 years of image analysis. Nat Methods 9, 671–675. [DOI] [PMC free article] [PubMed] [Google Scholar]
- Shafqat N, Muniz JR, Pilka ES, Papagrigoriou E, von Delft F, Oppermann U, and Yue WW (2013). Insight into S-adenosylmethionine biosynthesis from the crystal structures of the human methionine adenosyltransferase catalytic and regulatory subunits. The Biochemical journal 452, 27–36. [DOI] [PMC free article] [PubMed] [Google Scholar]
- Shi H, Wang X, Lu Z, Zhao BS, Ma H, Hsu PJ, Liu C, and He C (2017). YTHDF3 facilitates translation and decay of N(6)-methyladenosine-modified RNA. Cell Res 27, 315–328. [DOI] [PMC free article] [PubMed] [Google Scholar]
- Sievers F, and Higgins DG (2014). Clustal Omega, accurate alignment of very large numbers of sequences. Methods Mol Biol 1079, 105–116. [DOI] [PubMed] [Google Scholar]
- Singer BD (2019). A Practical Guide to the Measurement and Analysis of DNA Methylation. Am J Respir Cell Mol Biol 61, 417–428. [DOI] [PMC free article] [PubMed] [Google Scholar]
- Siroky BJ, Yin H, Babcock JT, Lu L, Hellmann AR, Dixon BP, Quilliam LA, and Bissler JJ (2012). Human TSC-associated renal angiomyolipoma cells are hypersensitive to ER stress. Am J Physiol Renal Physiol 303, F831–844. [DOI] [PMC free article] [PubMed] [Google Scholar]
- Smith E, and Shilatifard A (2010). The chromatin signaling pathway: diverse mechanisms of recruitment of histone-modifying enzymes and varied biological outcomes. Mol Cell 40, 689–701. [DOI] [PMC free article] [PubMed] [Google Scholar]
- Soda K (2018). Polyamine Metabolism and Gene Methylation in Conjunction with One-Carbon Metabolism. Int J Mol Sci 19. [DOI] [PMC free article] [PubMed] [Google Scholar]
- Straus DS (1984). Growth-stimulatory actions of insulin in vitro and in vivo. Endocr Rev 5, 356–369. [DOI] [PubMed] [Google Scholar]
- Tang S, Fang Y, Huang G, Xu X, Padilla-Banks E, Fan W, Xu Q, Sanderson SM, Foley JF, Dowdy S, et al. (2017). Methionine metabolism is essential for SIRT1-regulated mouse embryonic stem cell maintenance and embryonic development. The EMBO journal 36, 3175–3193. [DOI] [PMC free article] [PubMed] [Google Scholar]
- Thoreen CC, Chantranupong L, Keys HR, Wang T, Gray NS, and Sabatini DM (2012). A unifying model for mTORC1-mediated regulation of mRNA translation. Nature 485, 109–113. [DOI] [PMC free article] [PubMed] [Google Scholar]
- Timmerman KL, Lee JL, Dreyer HC, Dhanani S, Glynn EL, Fry CS, Drummond MJ, Sheffield-Moore M, Rasmussen BB, and Volpi E (2010). Insulin stimulates human skeletal muscle protein synthesis via an indirect mechanism involving endothelial-dependent vasodilation and mammalian target of rapamycin complex 1 signaling. J Clin Endocrinol Metab 95, 3848–3857. [DOI] [PMC free article] [PubMed] [Google Scholar]
- Vander Heiden MG, and DeBerardinis RJ (2017). Understanding the Intersections between Metabolism and Cancer Biology. Cell 168, 657–669. [DOI] [PMC free article] [PubMed] [Google Scholar]
- Walter JM, Helmin KA, Abdala-Valencia H, Wunderink RG, and Singer BD (2018). Multidimensional assessment of alveolar T cells in critically ill patients. JCI Insight 3. [DOI] [PMC free article] [PubMed] [Google Scholar]
- Wang X, Zhao BS, Roundtree IA, Lu Z, Han D, Ma H, Weng X, Chen K, Shi H, and He C (2015). N(6)-methyladenosine Modulates Messenger RNA Translation Efficiency. Cell 161, 1388–1399. [DOI] [PMC free article] [PubMed] [Google Scholar]
- Weinberg SE, Singer BD, Steinert EM, Martinez CA, Mehta MM, Martínez-Reyes I, Gao P, Helmin KA, Abdala-Valencia H, Sena LA, et al. (2019). Mitochondrial complex III is essential for suppressive function of regulatory T cells. Nature 565, 495–499. [DOI] [PMC free article] [PubMed] [Google Scholar]
- Weyandt JD, Thompson CB, Giaccia AJ, and Rathmell WK (2017). Metabolic Alterations in Cancer and Their Potential as Therapeutic Targets. Am Soc Clin Oncol Educ Book 37, 825–832. [DOI] [PMC free article] [PubMed] [Google Scholar]
- Wong CC, Qian Y, and Yu J (2017). Interplay between epigenetics and metabolism in oncogenesis: mechanisms and therapeutic approaches. Oncogene 36, 3359–3374. [DOI] [PMC free article] [PubMed] [Google Scholar]
- Wu X, Sang L, and Gong Y (2018). N6-methyladenine RNA modification and cancers. Am J Cancer Res 8, 1957–1966. [PMC free article] [PubMed] [Google Scholar]
- Wullschleger S, Loewith R, and Hall MN (2006). TOR signaling in growth and metabolism. Cell 124, 471–484. [DOI] [PubMed] [Google Scholar]
- Yang Y, Hsu PJ, Chen YS, and Yang YG (2018). Dynamic transcriptomic m(6)A decoration: writers, erasers, readers and functions in RNA metabolism. Cell Res 28, 616–624. [DOI] [PMC free article] [PubMed] [Google Scholar]
- Yuan M, Kremer DM, Huang H, Breitkopf SB, Ben-Sahra I, Manning BD, Lyssiotis CA, and Asara JM (2019). Ex vivo and in vivo stable isotope labelling of central carbon metabolism and related pathways with analysis by LC-MS/MS. Nat Protoc 14, 313–330. [DOI] [PMC free article] [PubMed] [Google Scholar]
- Zaccara S, Ries RJ, and Jaffrey SR (2019). Reading, writing and erasing mRNA methylation. Nature reviews Molecular cell biology 20, 608–624. [DOI] [PubMed] [Google Scholar]
- Zhang W, Spector TD, Deloukas P, Bell JT, and Engelhardt BE (2015). Predicting genome-wide DNA methylation using methylation marks, genomic position, and DNA regulatory elements. Genome Biol 16, 14. [DOI] [PMC free article] [PubMed] [Google Scholar]
- Zheng Y, Huang X, and Kelleher NL (2016). Epiproteomics: quantitative analysis of histone marks and codes by mass spectrometry. Curr Opin Chem Biol 33, 142–150. [DOI] [PMC free article] [PubMed] [Google Scholar]
Associated Data
This section collects any data citations, data availability statements, or supplementary materials included in this article.
Supplementary Materials
Excel spreadsheet: Table S1. LC-MS/MS Peak areas (Ranked by P-values pairwise comparisons). Related to Figure 1.
Excel spreadsheet: Table S2. LC-MS/MS Peak areas (Ranked by P-values pairwise comparisons). Related to Figure S1.
Excel spreadsheet: Table S5. Histone methylation abundance downstream of mTORC1 and MAT2A activity. Related to Figures 4 and S4.
Excel spreadsheet: Table S6. List of m6A modification patterns along with 6524 transcripts and their enriched Gene Ontology (GO) terms of biological process. Related to Figure 4.
Data Availability Statement
The image dataset supporting the current study have been deposited in a public repository; Mendeley Data: http://dx.doi.org/10.17632/wnh653n3xb.1. The m6A RNA-seq dataset generated in this study is available at GEO: GSE165690.