

Abstract
Ferroptosis, a form of regulated cell death triggered by lipid peroxidation, was recently identified as an important mechanism in radiotherapy (RT)-mediated tumor suppression and radioresistance, although the exact genetic contexts in which to target ferroptosis in RT remains to be defined. p53 is the most commonly mutated gene in human cancers and a major effector to RT. Here, we identify ferroptosis as a critical mechanism to mediate p53 function in tumor radiosensitivity. Mechanistically, RT-mediated p53 activation antagonizes RT-induced SLC7A11 expression and represses glutathione synthesis, thereby promoting RT-induced lipid peroxidation and ferroptosis. p53 deficiency promotes radioresistance in cancer cells or tumors at least partly through SLC7A11-mediated ferroptosis inhibition. Ferroptosis inducers (FINs) that inhibit SLC7A11 exert significant radiosensitizing effects in tumor organoids and patient-derived xenografts with p53 mutation or deficiency. Finally, we show that RT-induced ferroptosis correlates with p53 activation and better clinical outcomes to RT in cancer patients. Together, our study uncovers a previously unappreciated role of ferroptosis in p53-mediated radiosensitization and suggest using FINs in combination with RT to treat p53-mutant cancers.
Keywords: p53, ferroptosis, radiotherapy, radiosensitivity, lipid peroxidation, SLC7A11, cell death, tumor suppression
Introduction
Radiotherapy (RT) is a primary therapeutic strategy for many cancers, including lung, esophageal, and head and neck cancers [1, 2]. RT causes DNA double-strand breaks and generates reactive oxygen species (ROS), inducing cell cycle arrest, senescence, and various cell death [3, 4]. As a major effector of RT, p53 is stabilized by RT, regulates the transcription of its target genes, and induces cell cycle arrest, senescence, and apoptosis, among other functions, thereby contributing to the therapeutic effectiveness of RT [5–7]. p53 is the most mutated tumor suppressor in human cancers, and can also be inactivated through multiple other mechanisms, such as gene deletion and epigenetic silencing [8, 9]. Although the role of p53 in determining radiosensitivity is complex and somewhat controversial, p53-deficient tumors are generally considered to be radioresistant [7, 10, 11]. How p53 regulates radiosensitivity in cancer cells remains incompletely understood, hindering our ability to therapeutically target p53-deficient cancers. Therefore, there is a significant need to identify novel agents that can overcome radioresistance in p53-deficient tumors.
Ferroptosis is an iron-dependent lipid peroxidation-induced form of regulatory cell death, which is distinct from other forms of regulated cell death, such as apoptosis, in morphology and mechanisms [12, 13]. Ferroptosis is caused by peroxidation of polyunsaturated-fatty-acid-containing phospholipids (PUFA-PLs). The GPX4-SLC7A11 signaling axis constitutes the major cellular defense mechanism against ferroptosis, wherein GPX4, a glutathione peroxidase, uses reduced glutathione (GSH) to detoxify lipid peroxides and suppress ferroptosis [14–16], while the amino acid transporter SLC7A11 imports cystine, followed by cystine reduction to cysteine, which then provides the rate-limiting precursor for GSH synthesis (Fig. S1) [13, 17–20]. Inactivation of GPX4 or SLC7A11, genetically or pharmacologically by ferroptosis inducers (FINs), induces ferroptosis in cancer cells or tumors [13, 17, 18]. We and others previously identified ferroptosis as a natural tumor suppression mechanism, and showed that some tumor suppressors, including p53 and BAP1, suppress tumor formation at least partly through inducing ferroptosis [21–28]. Whether ferroptosis plays any role in mediating these tumor suppressors’ functions in response to cancer therapy remains less clear.
We and others recently reported that RT can potently induce ferroptosis and that ferroptosis plays an important role in RT-induced cell death and tumor suppression both in vitro and in vivo [29–31]. However, the exact genetic contexts in which ferroptosis plays a role in RT remain unclear. Given that p53 is the most commonly mutated gene in human cancers [8] and that both RT and ferroptosis have been associated with p53 [7, 10, 11, 21, 25, 32–35], in this study we examined whether p53 regulates RT-induced ferroptosis.
Results
Ferroptosis is involved in p53-mediated radiosensitization
We examined whether ferroptosis plays any role in p53-mediated radiosensitization. Wild-type (WT) p53 restoration in p53-deficient H1299 cells significantly promoted RT-induced lipid peroxidation and ferroptosis marker gene PTGS2 expression (Fig. 1a–c). As expected, p53 restoration significantly decreased the clonogenic survival upon RT and enhanced radiosensitization in H1299 cells (Fig. 1d). Treatment with ferroptosis inhibitor ferrostatin-1 (Fig. S1) increased the clonogenic survival upon RT; importantly, the effect of p53 restoration on radiosensitization was significantly attenuated (but not completely abolished) under ferroptosis inhibitor ferrostatin-1 treatment (Fig. 1d), suggesting that p53 promotes radiosensitization through both ferroptosis-dependent and -independent mechanisms.
Figure 1. Ferroptosis is involved in p53-mediated radiosensitization.
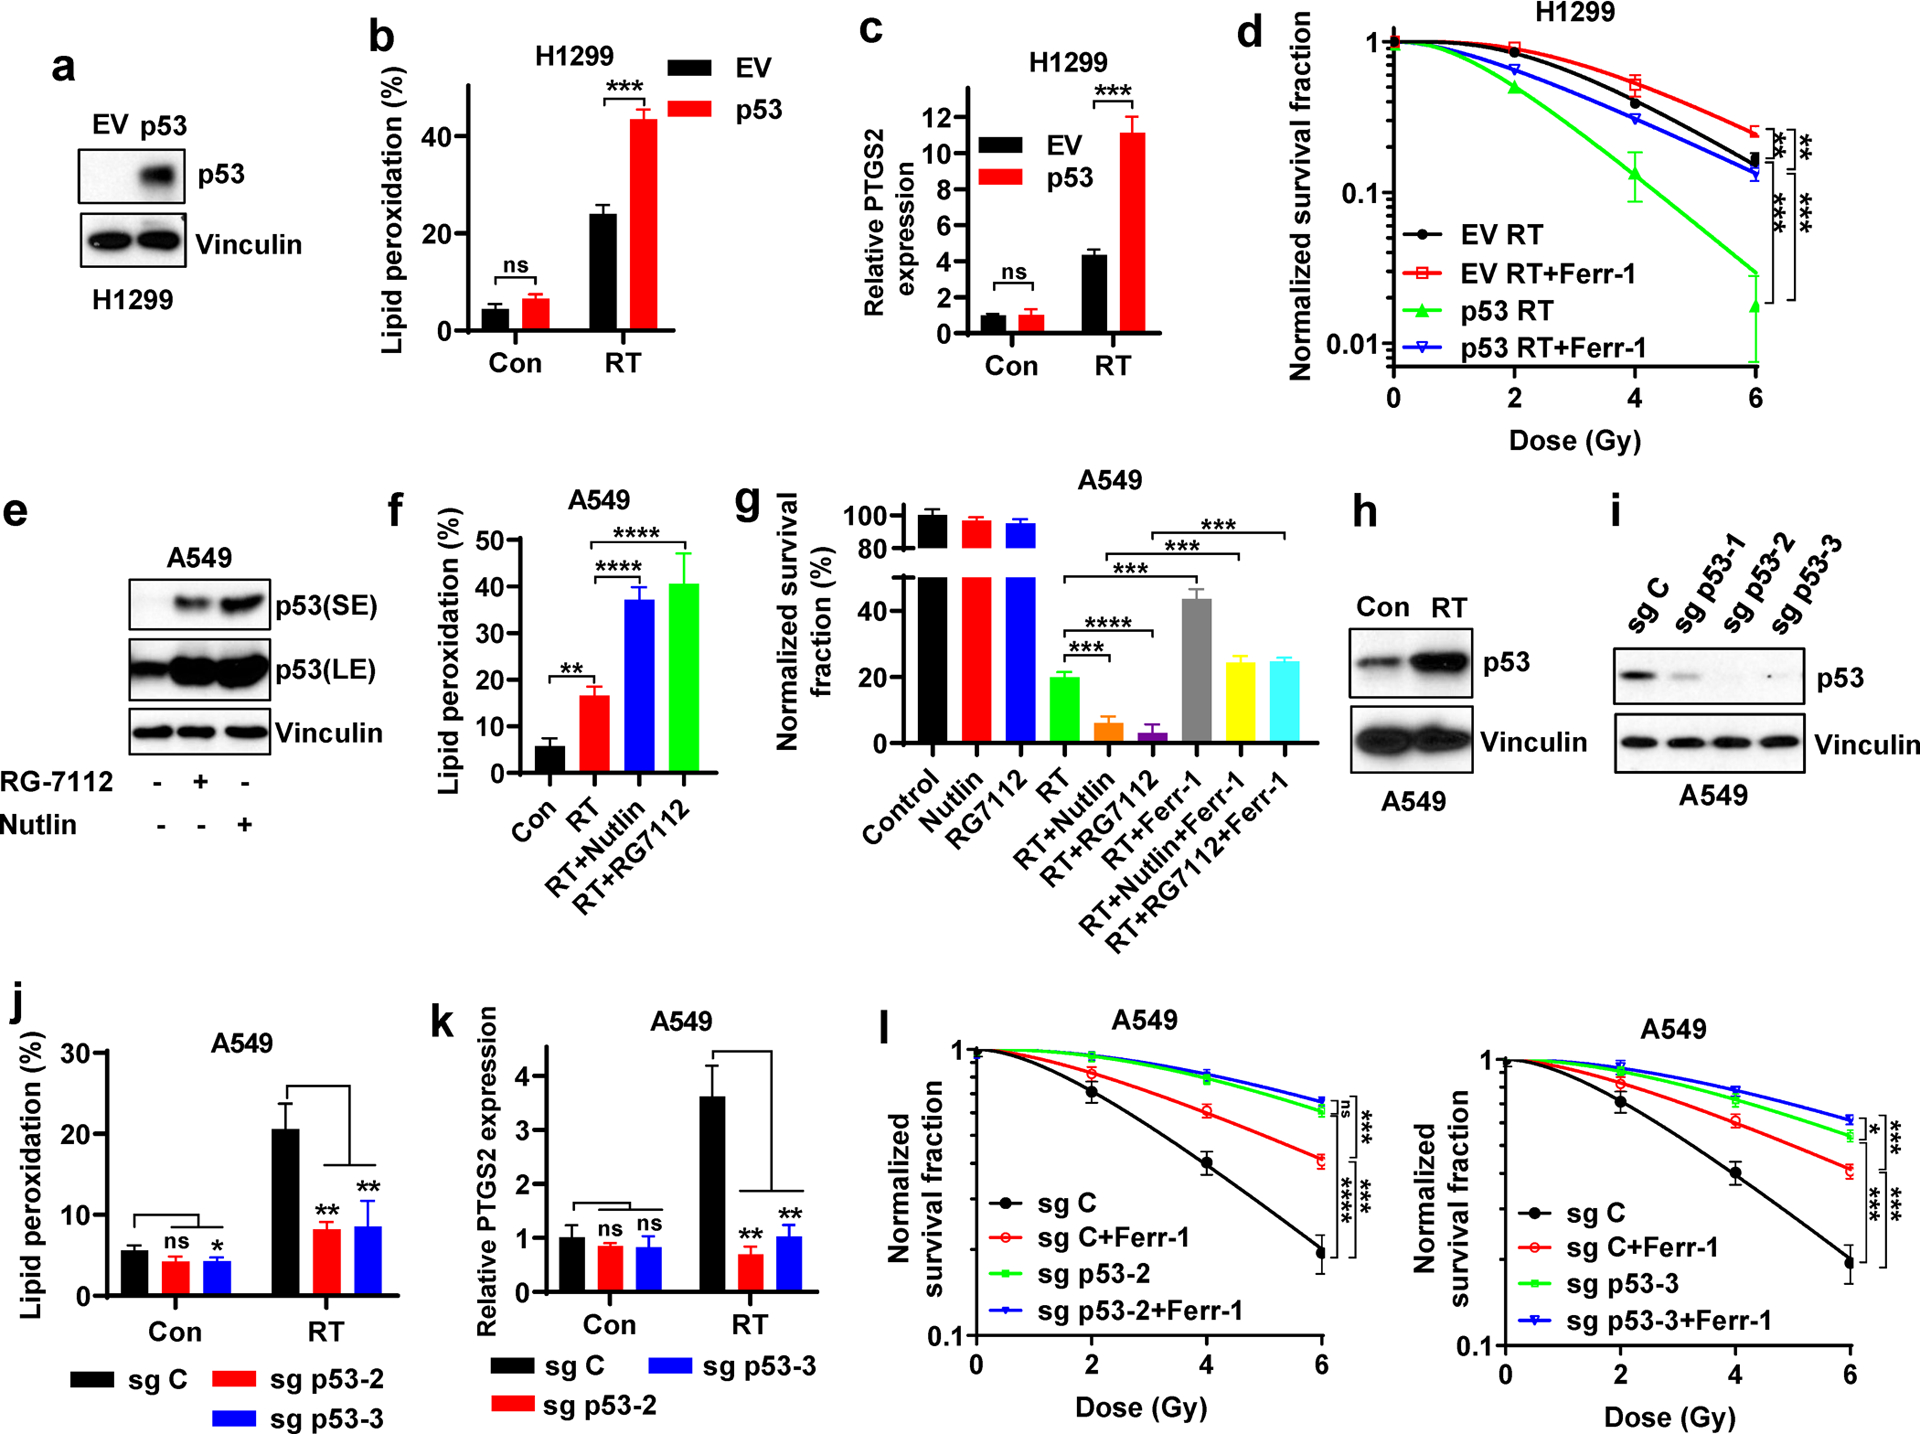
a Western blotting indicating p53 levels in p53-deficient H1299 cells with stable expression of empty vector (EV) and wild-type p53.
b Lipid peroxidation analysis in EV- and wild-type p53-expressing H1299 cells at 24 hours after 6 Gy X-ray irradiation.
c PTGS2 mRNA levels at 24 hours after 6 Gy X-ray irradiation in EV- and wild-type p53-expressing H1299 cells.
d Clonogenic survival curve of EV- and wild-type p53-expressing H1299 cells exposed to X-ray irradiation at indicated doses following pretreatment with 5 μM ferrostatin-1 or DMSO for 24 h. Log10 scale was used for Y axis.
e Western blotting indicating p53 stabilization following treatment with 10 μM Nutlin or 10 μM RG7112 in the p53 wild-type A549 cells.
f Lipid peroxidation analysis in A549 cells exposed to 6 Gy of X-ray irradiation following pretreatment with Nutlin, RG7112 or DMSO for 24 h.
g Clonogenic survival of A549 cells exposed to 6 Gy of X-ray irradiation following indicated pretreatment for 24 h.
h Western blotting indicating p53 stabilization following 6 Gy of X-ray irradiation in the p53 wild-type A549 cell lines.
i Western blotting analysis indicating p53 levels in sg Control (sg C), sg p53-1, sg p53-2, and sg p53-3 A549 cells.
j Lipid peroxidation analysis in sg C, sg p53-2, and sg p53-3 A549 cells at 24 hours after 6 Gy X-ray irradiation.
k PTGS2 mRNA levels at 24 hours after 6 Gy X-ray irradiation in sg C, sg p53-2, and sg p53-3 A549 cells.
l Clonogenic survival curves of sg C, sg p53-2, and sg p53-3 A549 cells exposed to X-ray irradiation at indicated doses following pretreatment with 5 μM ferrostatin-1 or DMSO for 24 h.
The percentage values in the panel b, f and j refer to the percentages of cells with lipid peroxidation measured by BODIPY™ 581/591 C11 staining followed by FACS analysis. Error bars are mean ± SD from three independent repeats. P values calculated by 2-tailed unpaired Student’s t-test.
Treatment with MDM2 inhibitor Nutlin or RG7112 in p53 WT A549 cells significantly increased p53 protein levels (Fig. 1e) and promoted RT-induced lipid peroxidation (Fig. 1f). Clonogenic survival assay showed that Nutlin or RG7112 treatment further decreased clonogenic survival upon RT, and that the radiosensitizing effect by these MDM2 inhibitors was significantly attenuated by ferrostatin-1 treatment (Fig. 1g), suggesting that the radiosensitization afforded by MDM2 inhibition and p53 activation is at least partly mediated by ferroptosis in A549 cells.
RT significantly induced p53 protein levels in p53 WT A549 and H460 cells (Fig. 1h, S2a). p53 deletion in these cells by CRISPR-Cas9 (Fig. 1i, S2b) largely abolished RT-induced lipid peroxidation and PTGS2 expression (Fig. 1j–k, S2c–d). As expected, p53 deletion significantly decreased RT-induced cell death (Fig. S2e), and restored clonogenic survival upon RT, leading to radioresistance; importantly, radioresistance caused by p53 deficiency was significantly attenuated by ferrostatin-1 treatment (Fig. 1l, S2f), suggesting that p53 deficiency promotes radioresistance at least partly through inhibiting ferroptosis. This observation was further confirmed in A549 cells with p53 knockdown (Fig. S2g). We made similar observations by depleting p53 in U2OS cells (Fig. S2h–j). Further analysis with different cell death inhibitors revealed that each of these cell death inhibitors could partially restore clonogenic survival in A549 cells upon RT (Fig. S2k), which is consistent with our previous report [29]; these cell death inhibitors exerted marginal additional restoration effects under p53 deficient background, likely because p53 deficiency in A549 cells already potently blocked these forms of cell death induced by RT.
A recent study identified transferrin receptor protein 1 (TfR1) as a novel ferroptosis marker [36]. We found that RT significantly increased TfR1 staining in A549 cells (p53 WT) but mildly increased it in H1299 cells (p53 deficient) (Fig. S2l); importantly, p53 deletion in A549 cells or its overexpression in H1299 cells decreased or increased RT-induced TfR1 staining, respectively (Fig. S2m–n). Together, our data strongly suggest that p53 promotes RT-induced ferroptosis and that ferroptosis plays a role in p53-mediated radiosensitization.
As a critical effector of RT, p53 is involved in DNA damage response and repair. Consistent with previous reports that p53 promotes DNA repair upon RT [37], we found that p53 restoration in H1299 cells suppressed RT-induced H2AX phosphorylation or phospho-H2AX foci formation, a marker of DNA damage (Fig. S3a–c). Ferrostatin-1 treatment did not affect H2AX phosphorylation or phospho-H2AX foci formation mediated by p53 in response to RT (Fig. S3a–c). These data suggest that the role of ferroptosis in p53-mediated radiosensitization is independent of DNA damage response.
p53 promotes RT-induced ferroptosis partly through antagonizing SLC7A11 induction
Next, we sought to understand how p53 mediates RT-induced ferroptosis. Consistent with our previous observation [29], RT induced the expression of both SLC7A11 and GPX4 (Fig. 2a); while p53 deficiency did not significantly affect GPX4 levels, p53 deletion significantly increased SLC7A11 expression, which is in line with previous findings that p53 represses SLC7A11 expression [21]; notably, this phenotype was particularly pronounced upon RT treatment (Fig. 2a–2b). This observation was confirmed in A549 cells with p53 knockdown (Fig. S4a). We showed that p53 deficiency in U2OS cells also upregulated SLC7A11 levels (Fig. S4b). While RT significantly induced p53 levels (Fig. 2a), RT did not induce the expression of other transcriptional regulators known to repress SLC7A11 transcription, such as BAP1 and ATF3 [26, 38] (Fig. S4c). It should be noted that, despite p53-mediated SLC7A11 repression, RT still induces SLC7A11 expression (Fig. 2a–b). This is further discussed under Discussion.
Figure 2. p53 promotes RT-induced ferroptosis partly via antagonizing SLC7A11 induction.
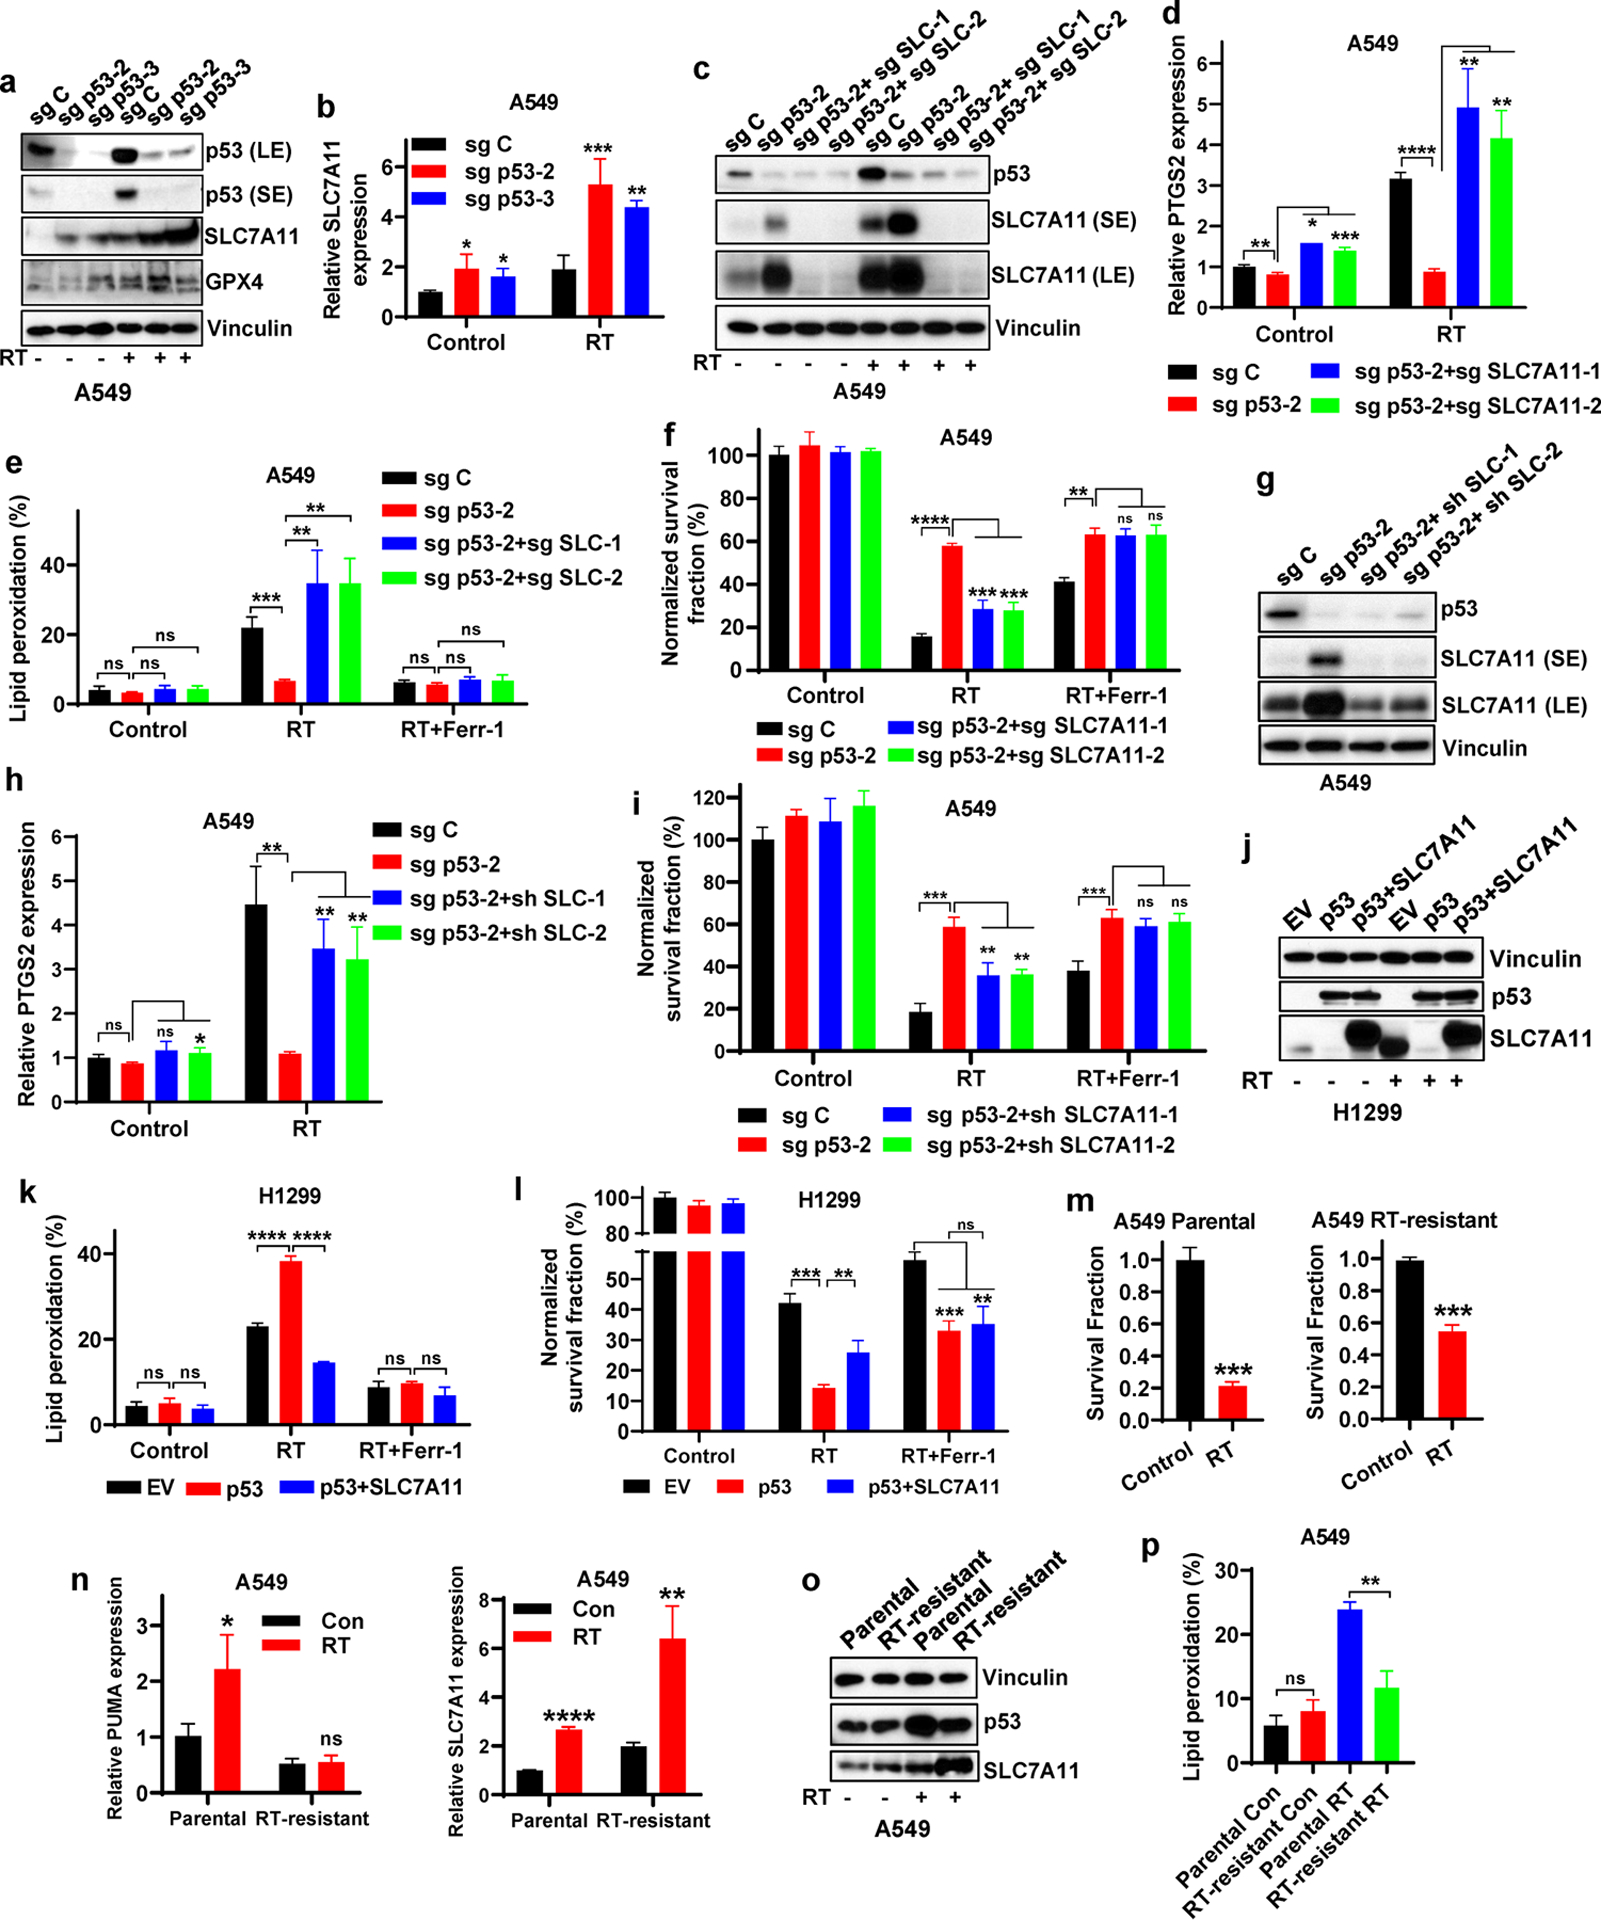
a Western blotting indicating p53, SLC7A11 and GPX4 levels in sg C, sg p53-2, and sg p53-3 A549 cells without X-ray irradiation or at 12 hours after 6 Gy X-ray irradiation.
b mRNA levels of SLC7A11 were analyzed by qPCR in sg C, sg p53-2, and sg p53-3 A549 cells without X-ray irradiation or at 12 hours after 6 Gy X-ray irradiation.
c Western blotting indicating p53 and SLC7A11 levels in sg C, sg p53-2, sg p53-2+sg SLC7A11-1 and sg p53-2+sg SLC7A11-2 A549 cells without X-ray irradiation or at 12 hours after 6 Gy X-ray irradiation.
d PTGS2 mRNA levels in sg C, sg p53-2, sg p53-2+sg SLC7A11-1, and sg p53-2+sg SLC7A11-2 A549 cells without X-ray irradiation or at 12 hours after 6 Gy X-ray irradiation.
e Lipid peroxidation analysis in sg C, sg p53-2, sg p53-2+sg SLC7A11-1, and sg p53-2+sg SLC7A11-2 A549 cells without X-ray irradiation or at 12 hours after exposure to 6 Gy X-ray irradiation following pretreatment with 5 μM ferrostatin-1 or DMSO for 24 h.
f Clonogenic survival analysis of sg C, sg p53-2, sg p53-2+sg SLC7A11-1 and sg p53-2+sg SLC7A11-2 A549 cells exposed to 6 Gy X-ray irradiation following pretreatment with 5 μM ferrostatin-1 or DMSO for 24 h.
g Western blotting indicating p53 and SLC7A11 levels in sg C, sg p53-2, sg p53-2+sh SLC7A11-1 and sg p53-2+sh SLC7A11-2 A549 cells.
h PTGS2 mRNA levels in sg C, sg p53-2, sg p53-2+sh SLC7A11-1, and sg p53-2+sh SLC7A11-2 A549 cells without X-ray irradiation or at 12 hours after 6 Gy X-ray irradiation.
i Clonogenic survival analysis of sg C, sg p53-2, sg p53-2+sh SLC7A11-1 and sg p53-2+sh SLC7A11-2 A549 cells exposed to 6 Gy X-ray irradiation following pretreatment with 5 μM ferrostatin-1 or DMSO for 24 h.
j Western blotting indicating p53 and SLC7A11 levels in H1299 cell line with stable expression of EV, wild-type p53 and wild-type p53 + SLC7A11.
k Lipid peroxidation analysis in EV-, wild-type p53-, and wild-type p53 + SLC7A11-expressing H1299 cells without X-ray irradiation or at 12 hours after exposure to 6 Gy of X-ray irradiation following pretreatment with 5 μM ferrostatin-1 or DMSO for 24 h.
l Clonogenic survival analysis of EV-, wild-type p53-, and wild-type p53 + SLC7A11-expressing H1299 cells exposed to 6 Gy of X-ray irradiation following pretreatment with 5 μM ferrostatin-1 or DMSO for 24 h.
m Clonogenic survival analysis of parental and RT-resistant A549 cells following 6 Gy of X-ray irradiation.
n mRNA levels of PUMA and SLC7A11 were analyzed by qPCR in parental and radioresistant A549 cells with or without 6 Gy X-ray irradiation.
o Western blotting indicating p53 and SLC7A11 levels in parental and radioresistant A549 cells.
p Lipid peroxidation analysis in parental and radioresistant A549 cells at 24 hours after 6 Gy X-ray irradiation.
The percentage values in the panel e, k and p refer to the percentages of cells with lipid peroxidation measured by BODIPY™ 581/591 C11 staining followed by FACS analysis. Error bars are mean ± SD from three independent repeats. P values calculated by 2-tailed unpaired Student’s t-test.
Consistent with our recent report [29], deleting SLC7A11 in p53 knockout (KO) cells restored the reduction of PTGS2 levels and lipid peroxidation under RT caused by p53 deficiency (Fig. 2c–e), re-sensitized p53 KO cells to RT, and the effect of SLC7A11 deletion on radiosensitization in p53 KO cells was completely abrogated by ferrostatin-1 treatment (Fig. 2f). Further, knocking down SLC7A11 in p53 KO cells to the level similar to that in p53 WT cells upregulated RT-induced PTGS2 expression and re-sensitized p53 KO cells to RT (Fig. 2g–i), suggesting that SLC7A11 induction caused by p53 deficiency plays a role in radioresistance. Conversely, p53 restoration in p53-deficient H1299 cells decreased basal SLC7A11 expression (Fig. 2j). Overexpression of SLC7A11 in p53-restored H1299 cells reversed the increased lipid peroxidation under RT caused by p53 restoration (Fig. 2j–k), and partly restored clonogenic survival in RT-treated p53-restored H1299 cells; again, the effect of SLC7A11 overexpression on clonogenic survival was abolished by ferroptosis inhibitor treatment (Fig. 2l).
Finally, by continually culturing RT-treated parental A549 cells, we generated radioresistant A549 cells (Fig. 2m). Compared with parental cells, radioresistant A549 cells exhibited less potent p53 induction by RT, and RT-induced expression of p53 targets, such as PUMA, was largely abolished in radioresistant cells, while RT-induced SLC7A11 expression was markedly increased in radioresistant cells (Fig. 2n–o), suggesting that RT-induced p53 function is compromised in these radioresistant cells. Consistently, RT-induced lipid peroxidation was decreased in these radioresistant cells (Fig. 2p). Together, our data suggest that p53 promotes RT-induced ferroptosis at least partly through antagonizing RT-induced SLC7A11 expression; p53 deficiency or defective RT-induced p53 activation (as shown in radioresistant cells) leads to de-repression of SLC7A11 expression, resulting in ferroptosis inhibition and radioresistance.
p53 deficiency confers radioresistance partly via SLC7A11-mediated GSH synthesis
SLC7A11 is a core component of system xc−, an amino acid transporter system that takes up extracellular cystine to promote GSH synthesis, thereby inhibiting ferroptosis (Fig. S1) [12, 17, 18, 39]. It is known that RT causes radiolysis of cellular water and generates ROS, which subsequently deplete GSH. Consistently, we found that RT decreased GSH levels (Fig. 3a); under RT conditions, p53 deletion in A549 cells significantly restored GSH levels, and SLC7A11 deficiency largely reversed the increased GSH levels caused by p53 deletion (Fig. 3a). Similar to SLC7A11 deficiency (Fig. 2e–f), blocking GSH biosynthesis in p53 KO A549 cells by l-buthionine sulfoximine (BSO) treatment (Fig. S1, 3b) reversed the decreased lipid peroxidation caused by p53 deficiency under RT (Fig. 3c), and re-sensitized p53 KO cells to RT (Fig. 3d). Likewise, culturing cells in cystine deprived medium decreased GSH levels in p53 KO A549 cells and resensitized these cells to RT (Fig. 3e–f). Conversely, supplementing A549 cells with N-acetyl cysteine (NAC) or GSHEE (a membrane permeable form of GSH) increased GSH levels in A549 WT cells under both basal and RT conditions, and partially restored clonogenic survival in A549 cells under RT compared with that in p53 KO A549 cells (Fig. 3g–h). We made similar observations in p53 KO U2OS cells cultured in cystine deprived medium and their WT counterparts supplemented with NAC or GSHEE (Fig. S4d). These data suggest that p53 deficiency in A549 cells promotes radioresistance at least partly through SLC7A11-mediated GSH synthesis and ferroptosis inhibition.
Figure 3. p53 deficiency contributes to radioresistance partly via SLC7A11-mediated GSH synthesis and ferroptosis inhibition.
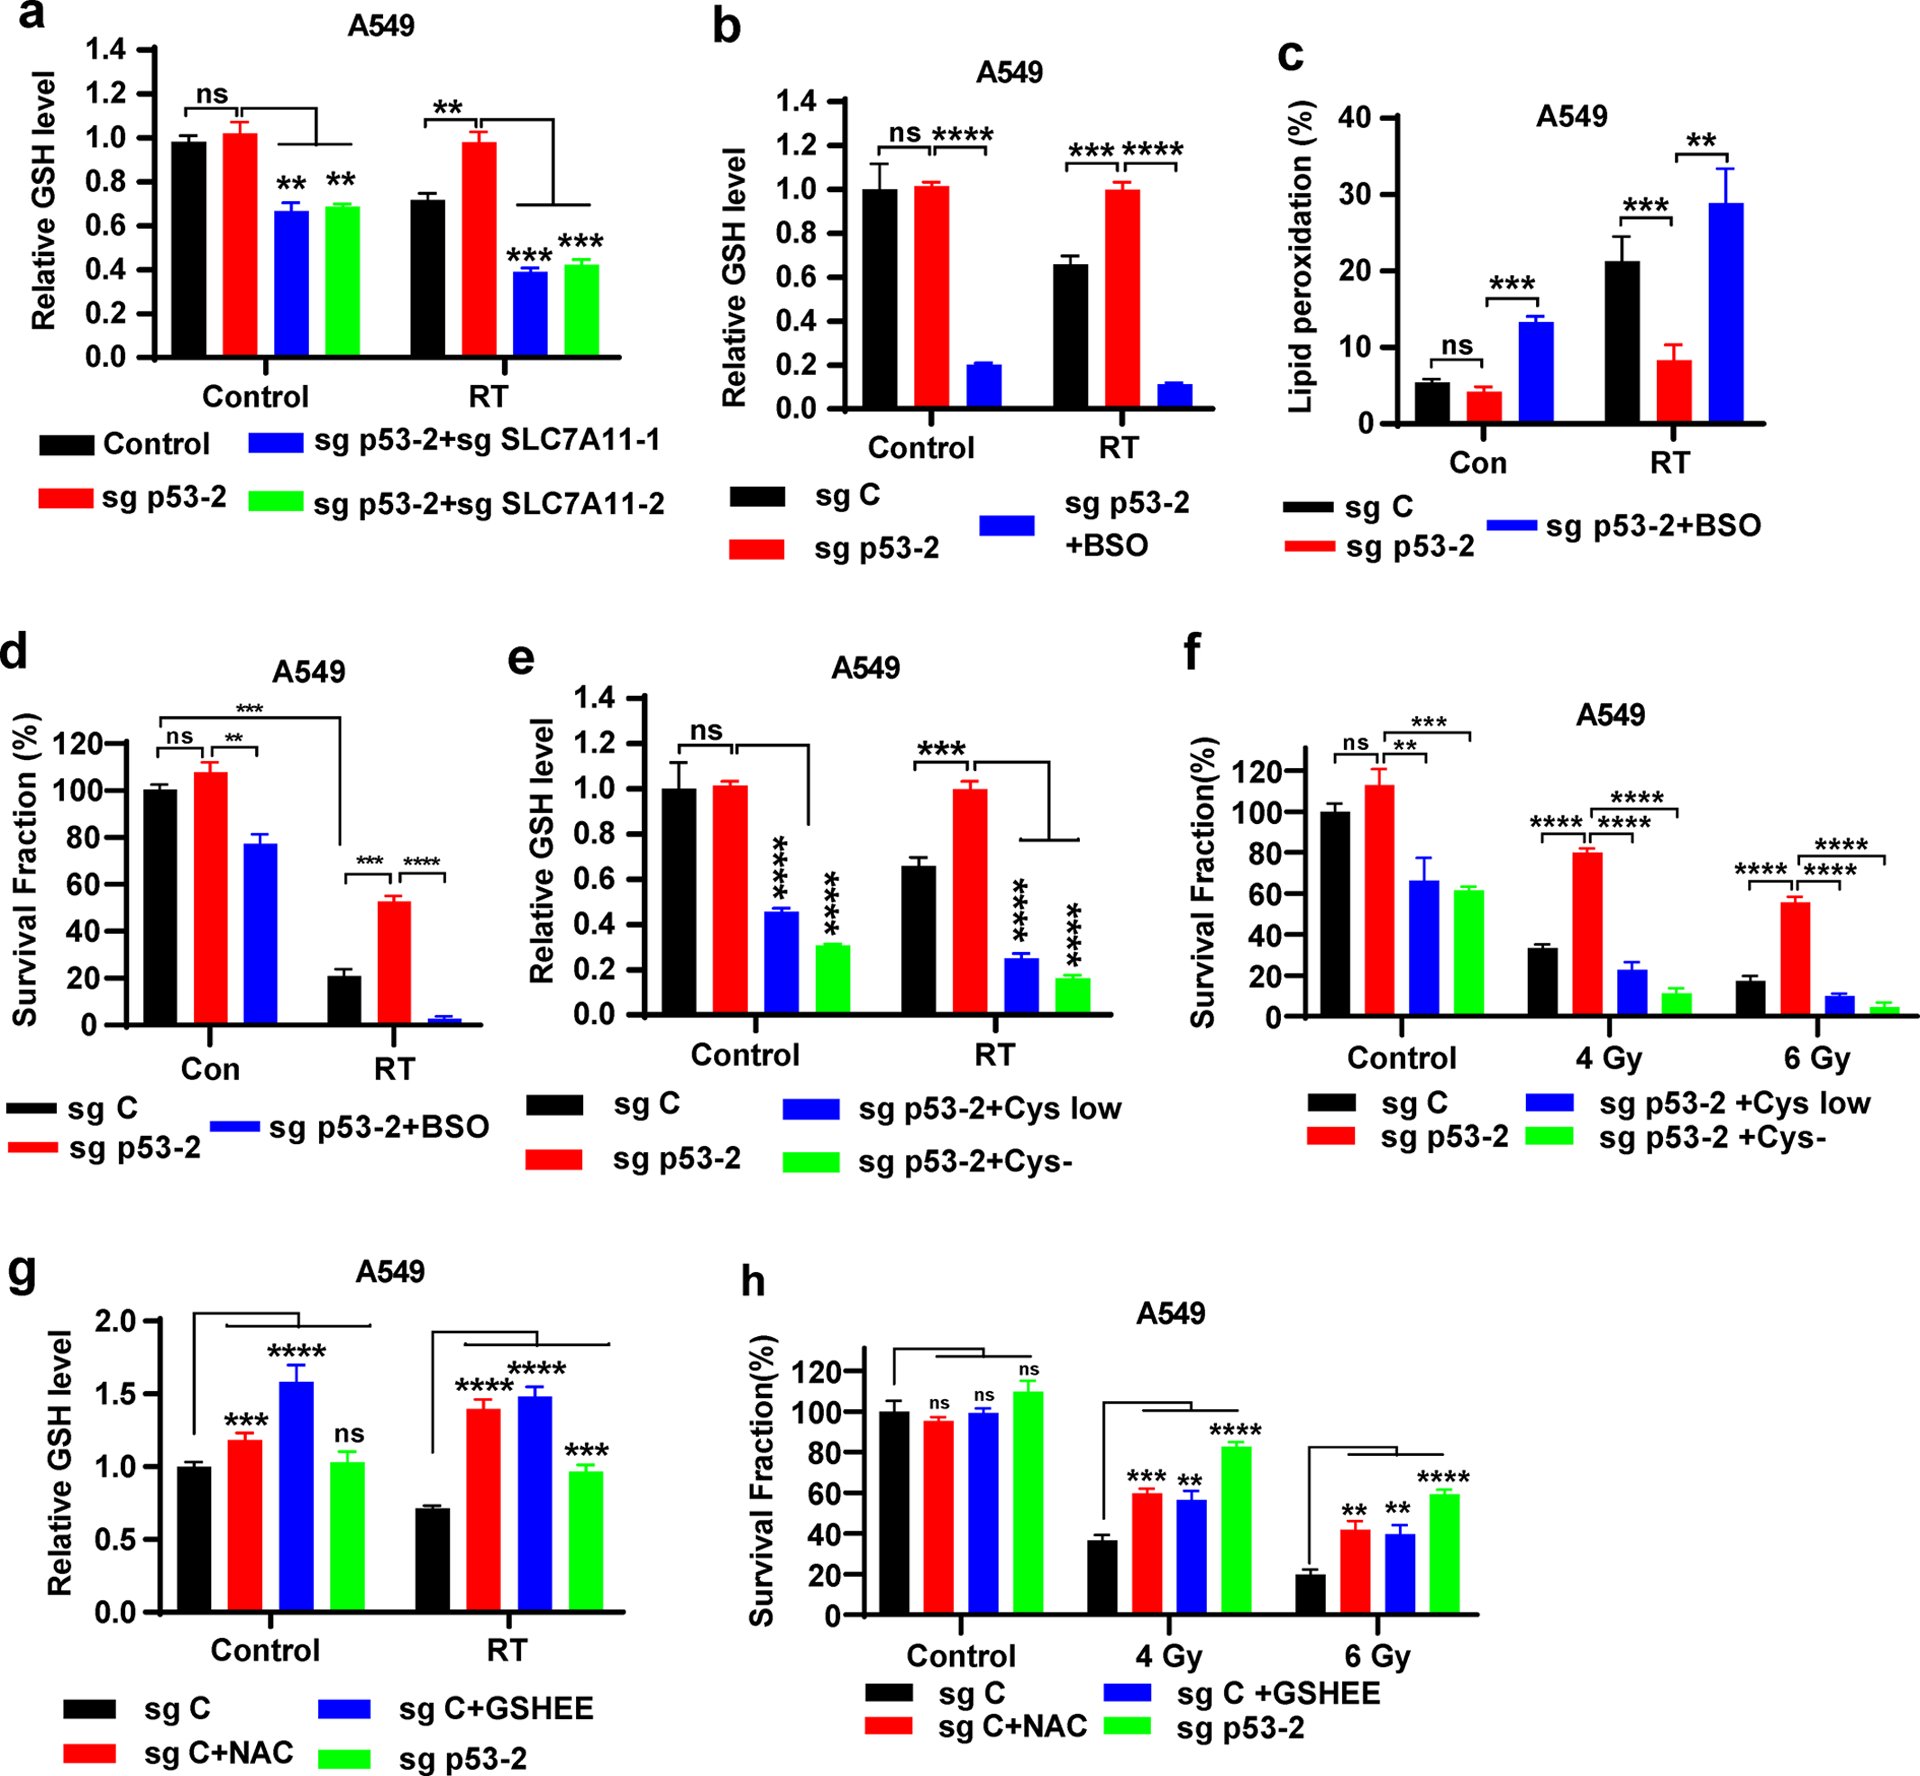
a Intracellular relative GSH levels were measured in sg C, sg p53-2, sg p53-2 + sg SLC7A11-1, and sg p53-2 + sg SLC7A11-2 A549 cells with or without 6 Gy X-ray irradiation.
b Intracellular relative GSH levels were measured in sg C, sg p53-2 A549 cells cultured in media containing DMSO or 100 μM BSO with or without 6 Gy X-ray irradiation.
c Lipid peroxidation analysis in sg C and sg p53-2 A549 cells without X-ray irradiation or at 12 hours after exposure to 6 Gy X-ray irradiation following pretreatment with DMSO or 100 μM BSO for 24 h.
d Clonogenic survival analysis of sg C and sg p53-2 A549 cells exposed to 6 Gy X-ray irradiation following pretreatment with DMSO or 100 μM BSO for 24 h.
e Intracellular relative GSH levels were measured in sg C, sg p53-2 A549 cells cultured in control or cystine-low concentration (5 μM) or cystine-free media with or without 6 Gy X-ray irradiation.
f Clonogenic survival analysis of sg C and sg p53-2 A549 cells exposed to 6 Gy X-ray irradiation following pretreatment with control or cystine-low concentration (5 μM) or cystine-free media for 24 h.
g Intracellular relative GSH levels were measured in sg C, sg p53-2 A549 cells cultured in media containing DMSO or GSHEE or NAC with or without 6 Gy X-ray irradiation.
h Clonogenic survival analysis of sg C and sg p53-2 A549 cells exposed to 6 Gy X-ray irradiation following pretreatment with DMSO or GSHEE or NAC for 24 h.
The percentage values in the panel c refer to the percentages of cells with lipid peroxidation measured by BODIPY™ 581/591 C11 staining followed by FACS analysis. Error bars are mean ± SD from three independent repeats. P values calculated by 2-tailed unpaired Student’s t-test.
FINs radiosensitize p53-deficient cancer cells and tumor organoids
Our above data prompted us to test whether FINs can reverse the radioresistance in cancer cells with p53 deficiency, which are generally radioresistant [7, 10, 11]. As shown in Fig. 4a–b, treatment with various FINs, including erastin, sulfasalazine (class 1 FINs that block SLC7A11-mediated cystine uptake), RSL3, ML162 (class 2 FINs that inactivate GPX4), and FIN56 (a class 3 FIN that depletes GPX4 and ubiquinone) (Fig. S1), all restored RT-induced lipid peroxidation in p53 KO cells (Fig. 4a) and reversed the radioresistance caused by p53 deficiency (Fig. 4b). Likewise, in radioresistant A549 cells (Fig. 2n–o), FIN treatment potentiated RT-induced lipid peroxidation (Fig. 4c) and significantly sensitized these cells to RT (Fig. 4d). We made similar observations in FLO-1 cells, a p53 mutant cancer cell line (Fig. S5a–b).
Figure 4. FINs radiosensitize p53-deficient/-mutant cancer cells and tumor organoids.
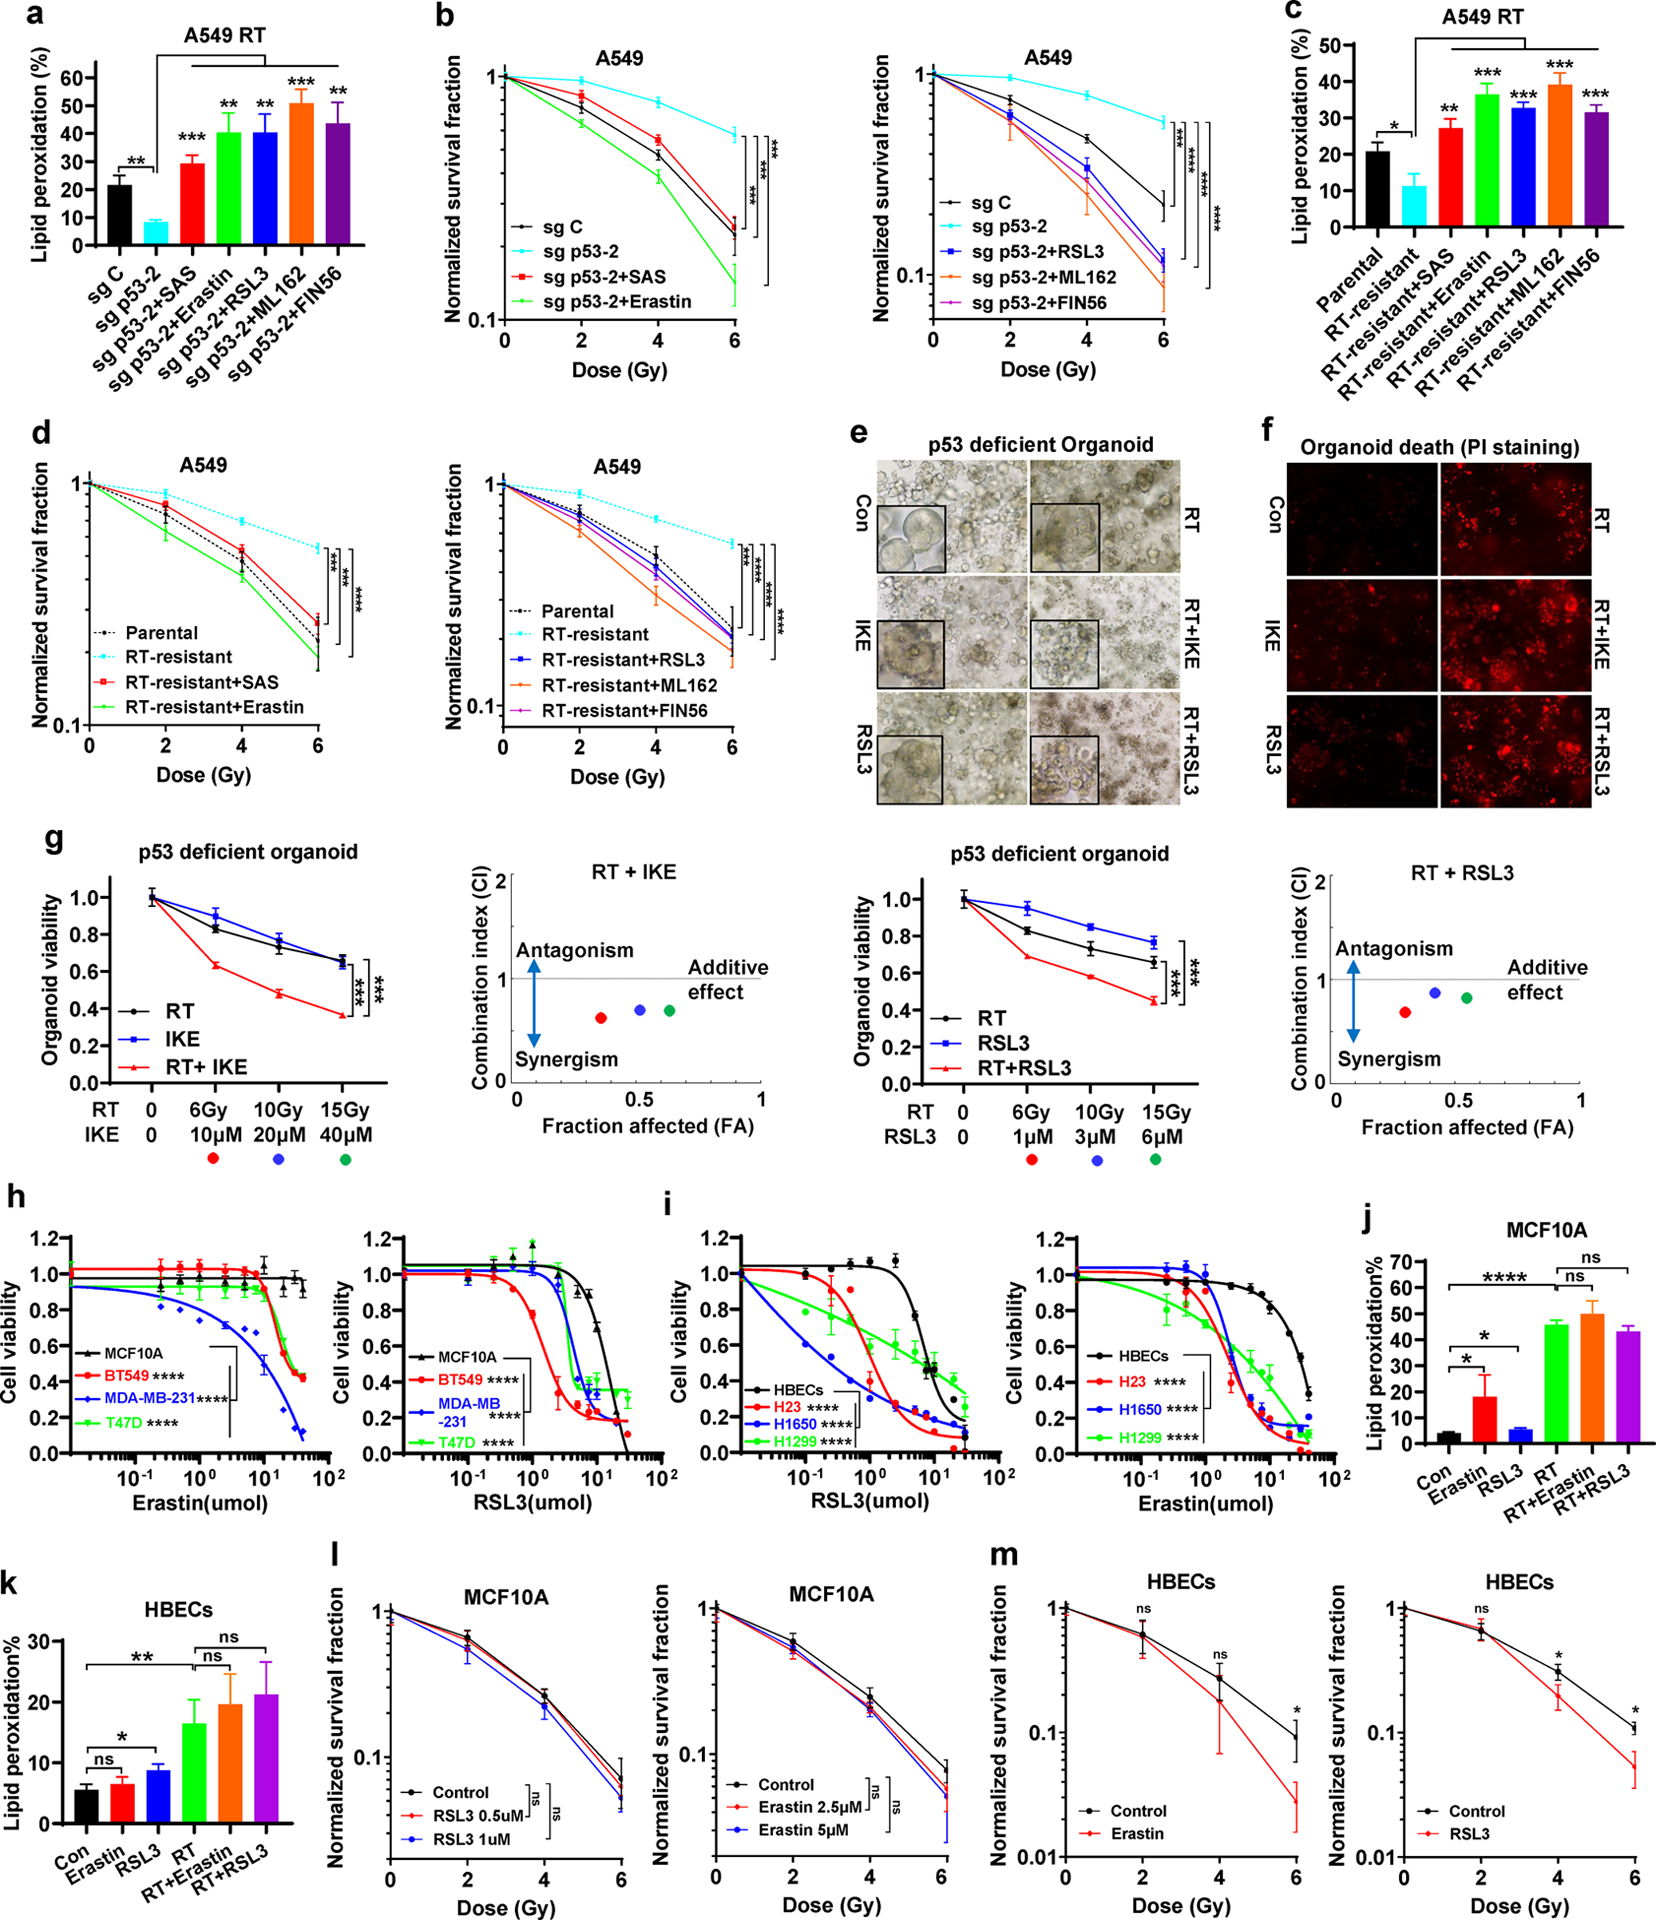
a Lipid peroxidation analysis in sg C and sg p53-2 A549 cells at 24 hours after exposure to 6 Gy X-ray irradiation following pretreatment with DMSO, SAS, erastin, RSL3, ML162, or FIN56 for 24 h.
b Clonogenic survival curve of sg C and sg p53-2 A549 cells exposed to X-ray irradiation at indicated doses following indicated pretreatment for 24 h.
c Lipid peroxidation analysis in parental and radioresistant A549 cells at 24 hours after exposure to 6 Gy of X-ray irradiation following pretreatment with DMSO, SAS, erastin, RSL3, ML162, or FIN56 for 24 h.
d Clonogenic survival curve of parental and radioresistant A549 cells exposed to X-ray irradiation at indicated doses following indicated pretreatment for 24 h.
e Representative phase-contrast images of patient-derived organoids with p53-deficiency at day 7 after exposure to 20 Gy X-ray irradiation following pretreatment with 50 μM IKE, 5 μM RSL3 or DMSO for 24 h.
f Representative PI staining images of ovarian cancer patient-derived organoids with p53-deficiency at day 7 after exposure to 20 Gy X-ray irradiation following pretreatment with 50 μM IKE, 5 μM RSL3 or DMSO for 24 h.
g Sensitivity of patient-derived organoids with p53-deficiency to indicated treatment. Left panel, organoid viability at day 7 after exposure to indicated combination treatments. Right panel, the dots indicated on the Fa-CI plot are shown for the combination effects of indicated treatment (combination index value < 1, synergistic effect; =1, additive effect; >1, antagonistic effect). The black dots represent 6Gy RT+ 10 μM IKE or 1 μM RSL3, the grey dots represent 10 Gy RT+ 20 μM IKE or 3 μM RSL3, and the black circles represent 15 Gy RT+ 40 μM IKE or 6 μM RSL3.
h Cell viability of MCF10A cells treated with DMSO, erastin, or RSL3 at indicated doses for 24 h.
i Cell viability of HBECs cells treated with DMSO, erastin, or RSL3 at indicated doses for 24 h.
j-k Lipid peroxidation analysis in MCF10A and HBECs cells at 24 hours after exposure to 6 Gy of X-ray irradiation following pretreatment with DMSO, erastin, or RSL3 for 24 h.
l Clonogenic survival curve of MCF10A cells exposed to X-ray irradiation at indicated doses following indicated pretreatment for 24 h.
m Clonogenic survival curve of HBECs cells exposed to X-ray irradiation at indicated doses following indicated pretreatment for 24 h.
The percentage values in the panel a, c, j and k refer to the percentages of cells with lipid peroxidation measured by BODIPY™ 581/591 C11 staining followed by FACS analysis. Error bars are mean ± SD from three independent repeats. P values calculated by 2-tailed unpaired Student’s t-test or 2-way ANOVA (h, i).
GSH measurement under these FIN treatment conditions showed that treatment with erastin or sulfasalazine decreased GSH levels under basal and RT conditions, whereas treatment with RSL3, ML162, or FIN56 even increased GSH levels in p53 KO cells (Fig. S5c). Because GPX4 utilizes GSH to detoxify lipid peroxides, GPX4 inactivation or its protein depletion by RSL3, ML162, or FIN56 would decrease GSH consumption, leading to increased GSH levels. This phenotype was particularly pronounced under RT condition, because RT induces potent lipid peroxidation, pushing GPX4 to consume more GSH to detoxify lipid peroxides; consequently, GPX4 inactivation reserves more GSH under RT. Therefore, depending on their mechanisms of action, these FINs can either decrease or increase GSH levels, but they all promote RT-induced lipid peroxidation and sensitize p53 KO cells to RT. Radioresistant A549 cells exhibited increased GSH levels compared with parental cells, and RT decreased GSH levels in parental cells but not in RT-resistant cells (Fig. S5d).
We then tested the combination of FINs with RT in patient-derived tumor organoids, which represents a better in vitro preclinical model for therapeutic testing in cancer research [40, 41]. To this end, we established p53-deficient tumor organoids established from a patient with high grade ovarian serous cancer, which exhibit high p53 mutation or deficiency and is considered to be radioresistant in the clinic [42]. As shown in Fig. 4e–4g, such p53-deficient tumor organoids were resistant to RT, which is consistent with clinical observations in corresponding cancer patients; notably, treatment with RSL3 or imidazole ketone erastin (IKE, a recently developed potent class 1 FIN [43]; also see Fig. S1) significantly synergized with RT to induce cell death and reduce cell viability in these tumor organoids.
Finally, we examined whether FINs induce ferroptosis in normal cells or sensitize normal cells to RT to the same extend as in cancer cells. To this end, we compared ferroptosis sensitivities in MCF10A human breast epithelial cells (or human bronchial epithelial cells [HBECs]) and p53-mutant/-deficient breast cancer BT549, MDA-MB-231, and T47D cells (or lung cancer H23, H1650, and H1299 cells). Intriguingly, MCF10A cells or HBECs exhibited less sensitivities to erastin- or RSL3-induced ferroptosis than corresponding cancer cell lines (Fig. 4h–i). Further, erastin or RSL3 only mildly induced lipid peroxidation in MCF10A cells or HBECs; while RT significantly induced lipid peroxidation in both cell lines, neither erastin nor RSL3 further increased RT-induced lipid peroxidation in these cells (Fig. 4j–k). Consistent with this, erastin or RSL3 exerted no or weak sensitizing effect to RT in these normal cell lines (Fig. 4l–m). Together, our data from different in vitro cancer models show that FINs synergize with RT to induce lipid peroxidation and can reverse the radioresistance in p53-deficient cancer cells and tumor organoids, and further suggest that cancer cells appear to more sensitive to FINs (or FINs in combination with RT) than corresponding normal cells.
Ferroptosis is involved in p53 deficiency-mediated radioresistance and FINs radiosensitize p53-mutant tumors in vivo
Next, we sought to determine the relevance of ferroptosis in p53 deficiency-mediated radioresistance in vivo. We found that p53 deficiency promoted A549 xenograft tumor growth, but SLC7A11 deficiency did not significantly affect tumor growth at the backdrop of p53 deficiency (Fig. 5a–5b). As expected, RT strongly suppressed the growth of control xenograft tumors and p53 deletion promoted tumor radioresistance, resulting in significantly restored tumor growth under RT conditions; notably, under RT conditions, SLC7A11 deletion in p53 KO tumors largely reversed the radioresistance effect caused by p53 deficiency (Fig. 5a–5b). Immunohistochemical (IHC) analyses of phospho-H2AX, cleaved caspase-3, and Ki67 in these tumor samples revealed expected results consistent with the known roles of RT and p53 in DNA damage response, apoptosis, and cell proliferation, respectively (Fig. 5c–f). Notably, SLC7A11 deficiency did not obviously affect these cellular processes under conditions with or without RT (Fig. 5c–f). Further IHC analyses of 4-hydroxy-2-noneal (4-HNE, a lipid peroxidation marker) revealed that p53 deletion largely abolished RT-induced 4-HNE levels and SLC7A11 deletion in p53-KO tumors restored 4-HNE levels (Fig. 5c, 5g). Together, these data suggest that, at least in this tumor model, SLC7A11 does not play a significant role in p53 deficiency-induced tumor growth but specifically mediates tumor radioresistance in p53 KO tumors, and that SLC7A11 promotes tumor radioresistance in p53 KO tumors likely through suppressing lipid peroxidation and ferroptosis.
Figure 5. Ferroptosis is involved in p53 deficiency-mediated radioresistance and FINs radiosensitize p53-mutant tumors in vivo.

a Tumor volume of A549 xenografts in the indicated genotypes and treatment groups at different time points (days) following exposure to 10 Gy of X-ray irradiation. Error bars are mean ± SD from eight independent tumors.
b Tumor weights of A549 xenografts in the indicated genotypes and treatment groups. Error bars are mean ± SD from eight independent tumors.
c Representative images of IHC staining of phospho-H2AX, cleaved caspase-3, Ki67 and 4-HNE in A549 xenograft tumors with indicated genotypes and treatments. Scale bars represent 50 μm/20 μm.
d-g IHC scores for phospho-H2AX, cleaved caspase-3, Ki67 and 4-HNE staining. Error bars are mean ± SD from six randomly selected magnification fields.
h Tumor volume of sg-p53 A549 xenografts in the indicated treatment groups at different time points (days) following exposure to 10 Gy of X-ray irradiation. Error bars are mean ± SD from six independent tumors.
i Tumor volume of PDX TC629 in the indicated treatment groups at different time points (days) following exposure to 10 Gy of X-ray irradiation. In this experiment, mice were sacrificed whenever the tumors reached 1500mm3, except mice in the group of RT+SAS, which were sacrificed at 48 days after treatment because the tumors from this group were still very small at this time point. Error bars are mean ± SD.
j Kaplan–Meier survival curves for NSG mice with PDX TC629 in the indicated treatment groups.
k Representative images of IHC staining of phospho-H2AX, cleaved caspase-3, Ki67 and 4-HNE in PDX TC629 tumors with indicated treatments. All tumors used in IHC analyses were harvested at the same time point. Scale bars represent 50 μm/20 μm.
l-o IHC scores for phospho-H2AX, cleaved caspase-3, Ki67 and 4-HNE staining. Error bars are mean ± SD from six randomly selected magnification fields.
P values calculated by 2-tailed unpaired Student’s t-test or log-rank test (j).
We then tested whether inducing ferroptosis by FINs can sensitize p53-deficient/-mutant tumors to RT using xenografts derived from p53 KO A549 cells. To enable more rapid translation of our findings into clinical application, we chose sulfasalazine, an FDA-approved drug with FIN activity (Fig. S1) [44] in our animal studies. As shown in Fig. 5h, RT only moderately suppressed the tumor growth in p53 KO A549 xenografts, and liproxstatin-1 treatment did not significantly restore p53 KO tumor growth upon RT (likely because p53 deficiency already largely abrogated RT-induced ferroptosis in A549 cells, which is also consistent with in vitro data in these cells; see Fig. 1l). In addition, while sulfasalazine treatment alone did not obviously affect tumor growth, it dramatically sensitized these tumors to RT; notably, liproxstatin-1 almost completely abolished sulfasalazine-mediated radiosensitization effect (Fig. 5h), suggesting that sulfasalazine sensitizes p53 KO tumors to RT mainly through inducing ferroptosis.
We further tested this using p53-mutant lung cancer patient-derived xenografts (PDXs) and obtained similar results (Fig. 5i–j): RT had a moderate suppressive effect on the tumor growth of p53-mutant lung cancer PDXs, and RT-treated tumors continued to grow over time; the effect of sulfasalazine treatment alone on tumor growth or animal survival was marginal, but sulfasalazine had a potent radiosensitizing effect on these tumors, resulting in significantly prolonged animal survivals. These treatments did not affect body weights of animals (Fig. S6), suggesting that the combination treatment is safe. Further analyses of these PDX tumor samples revealed that sulfasalazine treatment did not obviously affect phospho-H2AX, cleaved caspase-3, or Ki67 levels under either control or RT treatment conditions, but significantly synergized with RT to induce 4-HNE levels in tumor samples (Fig. 5k–o). Together, our data suggest that sulfasalazine in combination with RT likely represents a safe and effective therapeutic strategy to treat p53-mutant or -deficient tumors by inducing ferroptosis.
Ferroptosis induction correlates with p53 activation and better clinical responses to RT in cancer patients
We recently showed that more potent RT-induced ferroptosis correlated with better clinical outcomes to RT in cancer patients [29]. Reasoning that the prognosis value of ferroptosis markers can be further improved by combining with other biomarkers, we performed 4-HNE and p53 IHC analyses in the same cohort of 8 matched pre- and post-RT tumor samples as used in our recent study [29], which revealed that p53 staining was negative or mild in pre-RT samples, whereas p53 staining in post-RT tumor samples spanned from negative to strongly positive (Fig. 6a). IHC analyses of both 4-HNE and p53 in 30 post-RT tumor samples revealed a strong positive correlation between p53 and 4-HNE levels (Fig. 6b). Specifically, 11 out of 14 tumor samples with negative/mild/moderate p53 levels exhibited mild/moderate 4-HNE levels, whereas 15 out of 16 tumor samples with strongly positive p53 levels also exhibited strongly positive 4-HNE levels (Fig. 6c). This observation is therefore in line with our cell line studies showing that RT-induced p53 activation promotes lipid peroxidation and ferroptosis in cancer cells (Figs. 1–2).
Figure 6. Ferroptosis induction correlates with p53 activation and better clinical responses to RT in cancer patients.
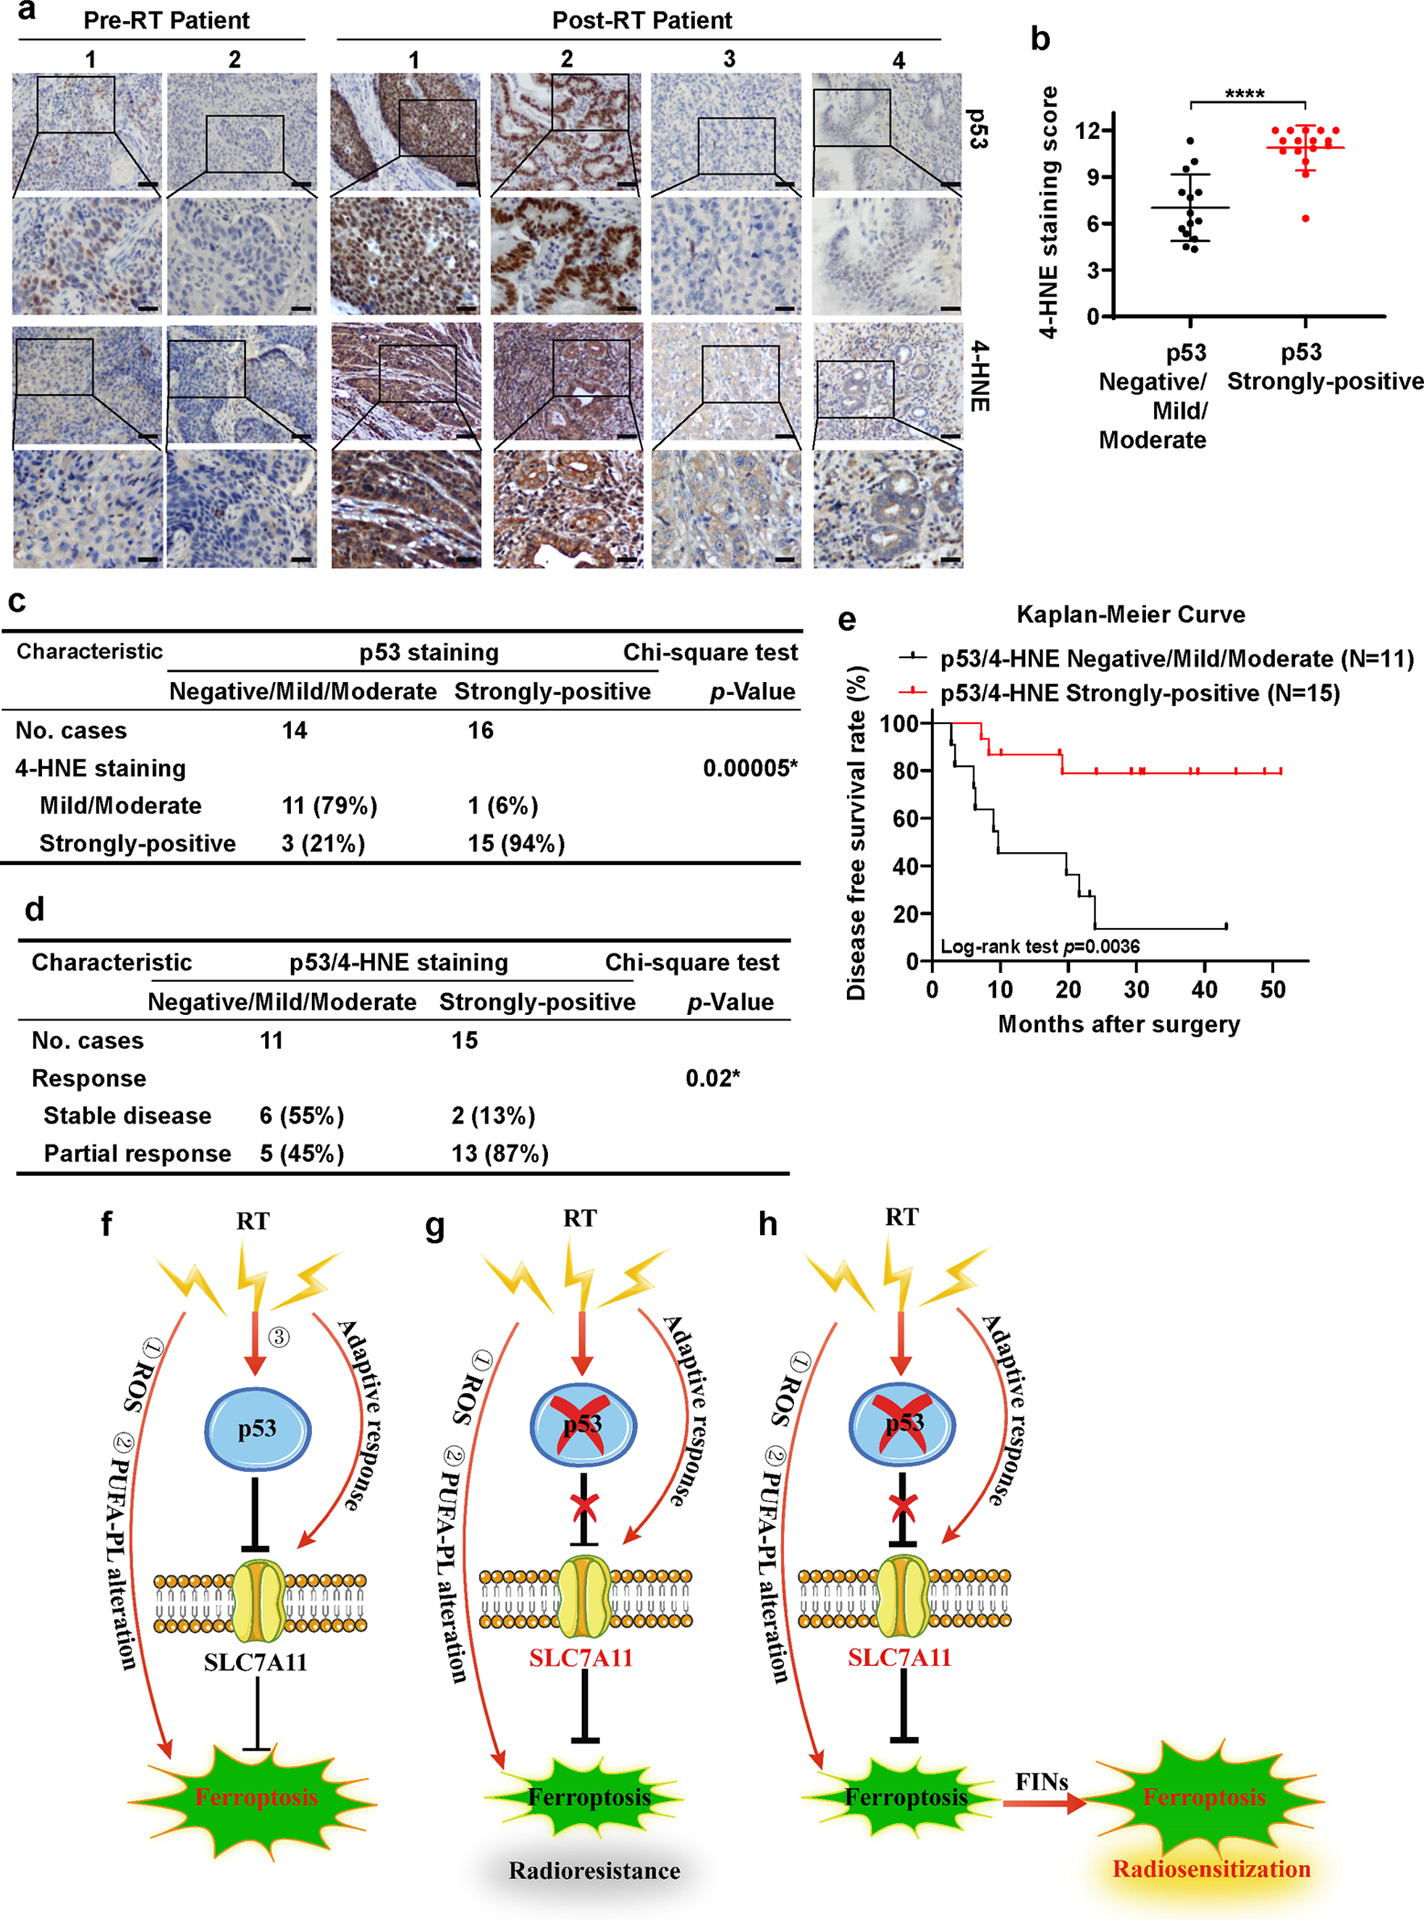
a Representative p53 and 4-HNE IHC staining images in esophageal cancer patient samples before and after radiotherapy. Scale bars represent 50 μm/20 μm.
b IHC scores for 4-HNE staining in p53 negative/mild/moderate and p53 strongly-positive esophageal cancer patient samples after radiotherapy. Error bars are mean ± SD from six randomly selected magnification fields. P values calculated by 2-tailed unpaired Student’s t-test.
c Correlation between 4-HNE and p53 staining in patients with esophageal cancer after radiotherapy. P values calculated by Chi-squared test.
d Correlation between radiotherapy response and p53/4-HNE combination staining in patients with esophageal cancer after radiotherapy. P values calculated by Chi-squared test.
e Kaplan–Meier survival curves for esophageal cancer patients stratified by p53 and 4-HNE staining after radiotherapy. P values calculated by log-rank test.
f-h The working model depicting the roles and mechanisms of ferroptosis in p53-mediated radiosensitization. See Discussion for detailed description.
We then tested whether combining 4-HNE and p53 levels can provide an even stronger prognosis power than 4-HNE alone to predict patient outcomes to RT. To this end, we divided the patients into two groups based on the levels of p53 and 4HNE in post-RT tumor samples: one group (15 samples) with strongly-positive staining in both p53 and 4HNE, whereas the other (11 samples) with negative/mild/moderate staining in both p53 and 4HNE. Our analyses showed that, while there was no significant difference in patient baseline characteristics (such as age, sex, tumor stage, differentiation or histological type) between the two groups, responses to RT or recurrence rates in patients with strongly-positive p53 and 4HNE staining were significantly better than those in patients with negative/mild/moderate p53 and 4HNE staining (Fig. 6d, Table S1). It should be noted that p53 levels along did not significantly correlate with these clinical responses (Fig. S7), suggesting that the significant correlation of combined p53 and 4HNE staining with clinical response does not simply reflect a correlation of p53 levels with clinical outcomes.
Finally, disease free survival analysis also revealed that patients with strongly-positive p53 and 4-HNE staining survived significantly longer than those with mild/moderate p53 and 4-HNE staining (Fig. 6e), with more significant separation of survival curves between the two groups than the data shown in our previous analysis based on only 4-HNE staining (31). In summary, our data suggest that more potent RT-induced p53 activation and ferroptosis correlate with better clinical outcomes to RT in cancer patients, and that the RT-p53-ferroptosis signaling axis likely contributes to therapeutic responses to RT in cancer patients. We acknowledge that one limitation of our analysis is that we do not have p53 mutation information from these cancer patients, precluding us from correlating p53 mutation status with ferroptosis marker staining or patient outcomes; nevertheless, our study at least suggests that RT-induced p53 expression has prognosis values.
Discussion
Recently, we and others identified ferroptosis as an important part of the RT-induced cell death response and revealed that ferroptosis inactivation promotes radioresistance [29–31]. In the current study, we show that ferroptosis represents a previously unrecognized mechanism in mediating p53 function in radiosensitization. On the basis of previous studies and the findings presented in this study, we propose that there are at least three mechanisms that underlie RT-induced ferroptosis (Fig. 6f): (1) RT-induced ROS deplete GSH and promote lipid peroxidation; (2) RT alters the levels of PUFA-PLs, possibly through modulating expression and/or activity of ACSL4 and other ferroptosis regulators; (3) our current study revealed that RT activates p53, which subsequently represses SLC7A11 and further sensitizes cancer cells to ferroptosis. However, RT also induces an adaptive response to upregulate SLC7A11 expression. Under most RT conditions we have tested, it seems that this adaptive response always overrides p53-mediated repressive effect on SLC7A11, resulting in increased SLC7A11 expression as a net effect in response to RT. Nevertheless, p53-mediated SLC7A11 repression is still important in RT-induced ferroptosis, because removing this molecular brake (by p53 deficiency) leads to an even more pronounced induction of SLC7A11 under RT, resulting in ferroptosis- and radio-resistance (Fig. 6g). We further show that FIN treatment weakens the anti-ferroptosis defense systems (by inactivating SLC7A11 or GPX4) in p53-deficient cancer cells or tumors, thereby sensitizing them to RT (Fig. 6h). Our study suggests that further testing the combination of RT and FINs (such as sulfasalazine) in the treatment of p53-deficient cancers is warranted.
Our data are not in conflict with previous studies showing that p53 deficiency promotes radioresistance through multiple other mechanisms such as inhibiting apoptosis [7, 10, 11]. Indeed, our data showed that p53 regulation of radiosensitivity involves both ferroptosis-dependent and -independent mechanisms (i.e., ferroptosis inhibition significantly attenuated, but not completely abrogated, p53’s effect on radiosensitivity; see Fig. 1i, 2f). Therefore, multiple downstream mechanisms (ferroptosis, apoptosis, and others) likely underlie the role of p53 in regulating radiosensitivity.
A recent study proposed that RT induces ferroptosis through suppressing SLC7A11 expression [30], which is opposite to our observation that RT generally induces SLC7A11 expression in cancer cells, which was also reported in other studies [45]. Further analyses revealed that, in HT1080 cells, RT at different doses increased SLC7A11 expression at different time points up to 48 hours; RT did decrease SLC7A11 expression at 72 hours after RT (Fig. S8). Since RT can potently induce lipid peroxidation and PTGS2 expression at 24 hours after RT in HT1080 cells [29, 31] (also see this study), it is less likely that SLC7A11 repression can underlie RT-induced lipid peroxidation at or before this time point. It is possible that SLC7A11 repression could still contribute to RT-induced ferroptosis at late time points. Further studies are required to clarify these questions.
Previous studies revealed a complex role of p53 in regulating ferroptosis induced by different FINs, with both pro- and anti-ferroptosis functions depending on the context [21, 22, 25, 32–35]. Our current study proposes that, at least in the context of RT, p53 exerts a strong pro-ferroptosis function. We also compared ferroptosis sensitivities of p53 WT and KO A549 cells to different FINs, including erastin, RSL3 and tert-butyl hydroperoxide (TBH). Our results showed that p53 deficiency in A549 cells promoted ferroptosis resistance to TBH and erastin, but not to RSL3 (Fig. S9a–b). Our data therefore appear to be consistent with the results published from Gu lab [46]. It should be noted that parental and radioresistant A549 cells did not exhibit apparent differences in ferroptosis sensitivity to erastin or RSL3 (Fig. S9c). This is not entirely surprising, because unlike p53 deficient cells, these radioresistant cells still express p53 but exhibit defective p53 signaling circuitry under RT; as a result, SLC7A11 levels were not significantly changed between parental and radioresistant cells under basal conditions but were significantly upregulated in radioresistant cells compared with parental cells under RT conditions (Fig. 2o). Consequently, these radioresistant cells exhibit ferroptosis resistance under RT conditions, but not under RSL3 or erastin treatment. Of note, although we propose that p53 promotes RT-induced ferroptosis partly through suppressing SLC7A11 expression and GSH synthesis, we do not rule out the potential involvement of other SLC7A11-independent or SLC7A11-dependent/GSH-independent mechanisms mediating p53 function in RT-induced ferroptosis.
Materials and methods
Cell line-derived xenograft and patient-derived xenograft (PDX) models
Cell line xenograft and PDX experiments were conducted as previously described [29, 47–49]. Female 4- to 6-week-old athymic nude mice (Foxn1nu/Foxn1nu) and NOD scid gamma (NSG) mice were obtained from the Experimental Radiation Oncology Breeding Core Facility at MD Anderson Cancer Center. All animal studies were performed under the approval of the Institutional Animal Care and Use Committee (IACUC) of The University of Texas MD Anderson Cancer Center and the protocol is in full in line with IACUC policies. See “Supplementary Material and methods” for detailed information.
Cell lines and organoids
A549, H460, H1299, H23, H1650, T47D, BT549, U2OS and HEK293T cell lines were purchased from American Type Culture Collection (2011–2017). HBECs, MCF10A, MDA-MB-231 and FLO-1 cell line was obtained from MD Anderson Cancer Center. Ovarian cancer organoids were cultured in appropriate organoid medium (OC/OCwnt/OSE/FT medium) and changed to fresh medium every 3–4 days as previously described [50]. CRISPR KO cells were generated as previously described [51]. See “Supplementary Material and methods” for detailed information.
Constructs
The primer sequences used in this study are listed in Table S2. See “Supplementary Material and methods” for details.
Patient samples
The procedure of patient sample collection was reviewed and approved by the Ethic Committee of Hunan Cancer Hospital & The Affiliated Cancer Hospital of Xiangya School Of Medicine, Central South University and The University of Texas MD Anderson Cencer Center, and informed consent was obtained from all subjects. See “Supplementary Material and methods” for detailed information.
Statistical analyses
Statistical analyses were performed with GraphPad Prism 8 or SPSS 25.0 software using unpaired Student’s t-test, chi-squared test, or log-rank test. Data are presented as means ± standard deviation (SD) from three independent experiments or biological replicates. Statistical significance (P values) are as follows: *, p<0.05; **, p<0.01; ***, p<0.001; ****, p<0.0001; n.s., non-significant.
Supplementary Material
Acknowledgements
This research was supported by Institutional Research Fund and RO Strategic Initiatives (ROSI) Boot Walk Seed Award from The University of Texas MD Anderson Cancer Center, KC180131 from Department of Defense Kidney Cancer Research Program, and R01CA181196, R01CA244144, and R01CA247992 from the National Institutes of Health (to B.G.); P50 CA217685, American Cancer Society, and MD Anderson Moon Shot Program in Ovarian Cancer (to A.K.S). B.G. was an Andrew Sabin Family Fellow. P.K. is supported by CPRIT Research Training Grant (RP170067) and Dr. John J. Kopchick Research Award from The University of Texas MD Anderson Cancer Center UTHealth Graduate School of Biomedical Sciences. This research has also been supported by the National Institutes of Health Cancer Center Support Grant P30CA016672 to The University of Texas MD Anderson Cancer Center.
Footnotes
Conflict of interest statement: A.K.S declares the following competing of interests: consulting (Merck, Kiyatec); shareholder (BioPath); and research support (M-Trap). Other authors declare no competing interests.
Additional “Materials and Methods” are provided in Supplementary Material and methods.
References
- 1.Delaney G, Jacob S, Featherstone C, Barton M. The role of radiotherapy in cancer treatment: estimating optimal utilization from a review of evidence-based clinical guidelines. Cancer 2005; 104: 1129–1137. [DOI] [PubMed] [Google Scholar]
- 2.Jaffray DA. Image-guided radiotherapy: from current concept to future perspectives. Nat Rev Clin Oncol 2012; 9: 688–699. [DOI] [PubMed] [Google Scholar]
- 3.Baidoo KE, Yong K, Brechbiel MW. Molecular pathways: targeted alpha-particle radiation therapy. Clin Cancer Res 2013; 19: 530–537. [DOI] [PMC free article] [PubMed] [Google Scholar]
- 4.Azzam EI, Jay-Gerin JP, Pain D. Ionizing radiation-induced metabolic oxidative stress and prolonged cell injury. Cancer letters 2012; 327: 48–60. [DOI] [PMC free article] [PubMed] [Google Scholar]
- 5.Fei P, El-Deiry WS. P53 and radiation responses. Oncogene 2003; 22: 5774–5783. [DOI] [PubMed] [Google Scholar]
- 6.Gudkov AV, Komarova EA. The role of p53 in determining sensitivity to radiotherapy. Nat Rev Cancer 2003; 3: 117–129. [DOI] [PubMed] [Google Scholar]
- 7.Vousden KH, Prives C. Blinded by the Light: The Growing Complexity of p53. Cell 2009; 137: 413–431. [DOI] [PubMed] [Google Scholar]
- 8.Muller PA, Vousden KH. p53 mutations in cancer. Nat Cell Biol 2013; 15: 2–8. [DOI] [PubMed] [Google Scholar]
- 9.Bykov VJN, Eriksson SE, Bianchi J, Wiman KG. Targeting mutant p53 for efficient cancer therapy. Nat Rev Cancer 2018; 18: 89–102. [DOI] [PubMed] [Google Scholar]
- 10.Lee JM, Bernstein A. p53 mutations increase resistance to ionizing radiation. Proc Natl Acad Sci U S A 1993; 90: 5742–5746. [DOI] [PMC free article] [PubMed] [Google Scholar]
- 11.Lowe SW, Bodis S, McClatchey A, Remington L, Ruley HE, Fisher DE et al. p53 status and the efficacy of cancer therapy in vivo. Science 1994; 266: 807–810. [DOI] [PubMed] [Google Scholar]
- 12.Dixon SJ, Lemberg KM, Lamprecht MR, Skouta R, Zaitsev EM, Gleason CE et al. Ferroptosis: an iron-dependent form of nonapoptotic cell death. Cell 2012; 149: 1060–1072. [DOI] [PMC free article] [PubMed] [Google Scholar]
- 13.Stockwell BR, Friedmann Angeli JP, Bayir H, Bush AI, Conrad M, Dixon SJ et al. Ferroptosis: A Regulated Cell Death Nexus Linking Metabolism, Redox Biology, and Disease. Cell 2017; 171: 273–285. [DOI] [PMC free article] [PubMed] [Google Scholar]
- 14.Seibt TM, Proneth B, Conrad M. Role of GPX4 in ferroptosis and its pharmacological implication. Free Radic Biol Med 2019; 133: 144–152. [DOI] [PubMed] [Google Scholar]
- 15.Friedmann Angeli JP, Schneider M, Proneth B, Tyurina YY, Tyurin VA, Hammond VJ et al. Inactivation of the ferroptosis regulator Gpx4 triggers acute renal failure in mice. Nat Cell Biol 2014; 16: 1180–1191. [DOI] [PMC free article] [PubMed] [Google Scholar]
- 16.Yang WS, SriRamaratnam R, Welsch ME, Shimada K, Skouta R, Viswanathan VS et al. Regulation of ferroptotic cancer cell death by GPX4. Cell 2014; 156: 317–331. [DOI] [PMC free article] [PubMed] [Google Scholar]
- 17.Koppula P, Zhang Y, Zhuang L, Gan B. Amino acid transporter SLC7A11/xCT at the crossroads of regulating redox homeostasis and nutrient dependency of cancer. Cancer Commun (Lond) 2018; 38: 12. [DOI] [PMC free article] [PubMed] [Google Scholar]
- 18.Conrad M, Sato H. The oxidative stress-inducible cystine/glutamate antiporter, system x (c) (−) : cystine supplier and beyond. Amino Acids 2012; 42: 231–246. [DOI] [PubMed] [Google Scholar]
- 19.Koppula P, Zhuang L, Gan B. Cystine transporter SLC7A11/xCT in cancer: Ferroptosis, nutrient dependency, and cancer therapy. Protein & Cell 2020: 1–22. 10.1007/s13238-020-00789-5. [DOI] [PMC free article] [PubMed] [Google Scholar]
- 20.Liu X, Zhang Y, Zhuang L, Olszewski K, Gan B. NADPH debt drives redox bankruptcy: SLC7A11/xCT-mediated cystine uptake as a double-edge sword in cellular redox regulation. Genes & Diseases 2020. 10.1016/j.gendis.2020.11.010. [DOI] [PMC free article] [PubMed] [Google Scholar]
- 21.Jiang L, Kon N, Li T, Wang SJ, Su T, Hibshoosh H et al. Ferroptosis as a p53-mediated activity during tumour suppression. Nature 2015; 520: 57–62. [DOI] [PMC free article] [PubMed] [Google Scholar]
- 22.Chu B, Kon N, Chen D, Li T, Liu T, Jiang L et al. ALOX12 is required for p53-mediated tumour suppression through a distinct ferroptosis pathway. Nat Cell Biol 2019; 21: 579–591. [DOI] [PMC free article] [PubMed] [Google Scholar]
- 23.Gan B. DUBbing Ferroptosis in Cancer Cells. Cancer Res 2019; 79: 1749–1750. [DOI] [PMC free article] [PubMed] [Google Scholar]
- 24.Liu T, Jiang L, Tavana O, Gu W. The Deubiquitylase OTUB1 Mediates Ferroptosis via Stabilization of SLC7A11. Cancer Res 2019; 79: 1913–1924. [DOI] [PMC free article] [PubMed] [Google Scholar]
- 25.Jennis M, Kung CP, Basu S, Budina-Kolomets A, Leu JI, Khaku S et al. An African-specific polymorphism in the TP53 gene impairs p53 tumor suppressor function in a mouse model. Genes Dev 2016; 30: 918–930. [DOI] [PMC free article] [PubMed] [Google Scholar]
- 26.Zhang Y, Shi J, Liu X, Feng L, Gong Z, Koppula P et al. BAP1 links metabolic regulation of ferroptosis to tumour suppression. Nat Cell Biol 2018; 20: 1181–1192. [DOI] [PMC free article] [PubMed] [Google Scholar]
- 27.Gao M, Yi J, Zhu J, Minikes AM, Monian P, Thompson CB et al. Role of Mitochondria in Ferroptosis. Mol Cell 2019; 73: 354–363 e353. [DOI] [PMC free article] [PubMed] [Google Scholar]
- 28.Zhang Y, Zhuang L, Gan B. BAP1 suppresses tumor development by inducing ferroptosis upon SLC7A11 repression. Molecular & cellular oncology 2019; 6: 1536845. [DOI] [PMC free article] [PubMed] [Google Scholar]
- 29.Lei G, Zhang Y, Koppula P, Liu X, Zhang J, Lin SH et al. The role of ferroptosis in ionizing radiation-induced cell death and tumor suppression. Cell research 2020; 30: 146–162. [DOI] [PMC free article] [PubMed] [Google Scholar]
- 30.Lang X, Green MD, Wang W, Yu J, Choi JE, Jiang L et al. Radiotherapy and Immunotherapy Promote Tumoral Lipid Oxidation and Ferroptosis via Synergistic Repression of SLC7A11. Cancer Discov 2019; 9: 1673–1685. [DOI] [PMC free article] [PubMed] [Google Scholar]
- 31.Ye LF, Chaudhary KR, Zandkarimi F, Harken AD, Kinslow CJ, Upadhyayula PS et al. Radiation-Induced Lipid Peroxidation Triggers Ferroptosis and Synergizes with Ferroptosis Inducers. ACS Chem Biol 2020; 15:469–484. doi: 10.1021/acschembio.9b00939. [DOI] [PMC free article] [PubMed] [Google Scholar]
- 32.Tarangelo A, Magtanong L, Bieging-Rolett KT, Li Y, Ye J, Attardi LD et al. p53 Suppresses Metabolic Stress-Induced Ferroptosis in Cancer Cells. Cell Rep 2018; 22: 569–575. [DOI] [PMC free article] [PubMed] [Google Scholar]
- 33.Xie Y, Zhu S, Song X, Sun X, Fan Y, Liu J et al. The Tumor Suppressor p53 Limits Ferroptosis by Blocking DPP4 Activity. Cell Rep 2017; 20: 1692–1704. [DOI] [PubMed] [Google Scholar]
- 34.Ou Y, Wang SJ, Li D, Chu B, Gu W. Activation of SAT1 engages polyamine metabolism with p53-mediated ferroptotic responses. Proc Natl Acad Sci U S A 2016; 113: E6806–E6812. [DOI] [PMC free article] [PubMed] [Google Scholar]
- 35.Leu JI, Murphy ME, George DL. Mechanistic basis for impaired ferroptosis in cells expressing the African-centric S47 variant of p53. Proc Natl Acad Sci U S A 2019; 116: 8390–8396. [DOI] [PMC free article] [PubMed] [Google Scholar]
- 36.Feng H, Schorpp K, Jin J, Yozwiak CE, Hoffstrom BG, Decker AM et al. Transferrin Receptor Is a Specific Ferroptosis Marker. Cell reports 2020; 30: 3411–3423. e3417. [DOI] [PMC free article] [PubMed] [Google Scholar]
- 37.Zheng H, Chen L, Pledger WJ, Fang J, Chen JJO. p53 promotes repair of heterochromatin DNA by regulating JMJD2b and SUV39H1 expression. Oncogene 2014; 33: 734–744. doi: 10.1038/onc.2013.6. [DOI] [PMC free article] [PubMed] [Google Scholar]
- 38.Wang L, Liu Y, Du T, Yang H, Lei L, Guo M et al. ATF3 promotes erastin-induced ferroptosis by suppressing system Xc–. Cell Death & Differentiation 2020; 27: 662–675. [DOI] [PMC free article] [PubMed] [Google Scholar]
- 39.Sato H, Tamba M, Ishii T, Bannai S. Cloning and expression of a plasma membrane cystine/glutamate exchange transporter composed of two distinct proteins. J Biol Chem 1999; 274: 11455–11458. [DOI] [PubMed] [Google Scholar]
- 40.Drost J, Clevers H. Organoids in cancer research. Nat Rev Cancer 2018; 18: 407–418. [DOI] [PubMed] [Google Scholar]
- 41.Li M, Izpisua Belmonte JC. Organoids - Preclinical Models of Human Disease. N Engl J Med 2019; 380: 569–579. [DOI] [PubMed] [Google Scholar]
- 42.Cancer Genome Atlas Research N. Integrated genomic analyses of ovarian carcinoma. Nature 2011; 474: 609–615. [DOI] [PMC free article] [PubMed] [Google Scholar]
- 43.Zhang Y, Tan H, Daniels JD, Zandkarimi F, Liu H, Brown LM et al. Imidazole Ketone Erastin Induces Ferroptosis and Slows Tumor Growth in a Mouse Lymphoma Model. Cell Chem Biol 2019; 26:623–633.e9. doi: 10.1016/j.chembiol.2019.01.008. [DOI] [PMC free article] [PubMed] [Google Scholar]
- 44.Gout PW, Buckley AR, Simms CR, Bruchovsky N. Sulfasalazine, a potent suppressor of lymphoma growth by inhibition of the x(c)- cystine transporter: a new action for an old drug. Leukemia 2001; 15: 1633–1640. [DOI] [PubMed] [Google Scholar]
- 45.Xie L, Song X, Yu J, Guo W, Wei L, Liu Y et al. Solute carrier protein family may involve in radiation-induced radioresistance of non-small cell lung cancer. J Cancer Res Clin Oncol 2011; 137: 1739–1747. [DOI] [PMC free article] [PubMed] [Google Scholar]
- 46.Chu B, Kon N, Chen D, Li T, Liu T, Jiang L et al. ALOX12 is required for p53-mediated tumour suppression through a distinct ferroptosis pathway. Nature cell biology 2019; 21: 579–591. [DOI] [PMC free article] [PubMed] [Google Scholar]
- 47.Lin A, Piao HL, Zhuang L, Sarbassov DD, Ma L, Gan B. FoxO transcription factors promote AKT Ser473 phosphorylation and renal tumor growth in response to pharmacological inhibition of the PI3K-AKT pathway. Cancer Res 2014; 74:1682–93. doi: 10.1158/0008-5472.CAN-13-1729. [DOI] [PMC free article] [PubMed] [Google Scholar]
- 48.Xiao ZD, Han L, Lee H, Zhuang L, Zhang Y, Baddour J et al. Energy stress-induced lncRNA FILNC1 represses c-Myc-mediated energy metabolism and inhibits renal tumor development. Nature communications 2017; 8: 783. [DOI] [PMC free article] [PubMed] [Google Scholar]
- 49.Liu X, Olszewski K, Zhang Y, Lim EW, Shi J, Zhang X et al. Cystine transporter regulation of pentose phosphate pathway dependency and disulfide stress exposes a targetable metabolic vulnerability in cancer. Nat Cell Biol 2020; 22: 476–486. [DOI] [PMC free article] [PubMed] [Google Scholar]
- 50.Kopper O, de Witte CJ, Lohmussaar K, Valle-Inclan JE, Hami N, Kester L et al. An organoid platform for ovarian cancer captures intra- and interpatient heterogeneity. Nat Med 2019; 25: 838–849. [DOI] [PubMed] [Google Scholar]
- 51.Zhang Y, Shi J, Liu X, Xiao Z, Lei G, Lee H et al. H2A Monoubiquitination Links Glucose Availability to Epigenetic Regulation of the Endoplasmic Reticulum Stress Response and Cancer Cell Death. Cancer Res 2020; 80: 2243–2256. [DOI] [PMC free article] [PubMed] [Google Scholar]
Associated Data
This section collects any data citations, data availability statements, or supplementary materials included in this article.