

Abstract
Background
Many vulnerable populations experience elevated exposures to environmental and social stressors, with deleterious effects on health. Multi-stressor epidemiological models can be used to assess benefits of exposure reductions. However, requisite individual-level risk factor data are often unavailable at adequate spatial resolution.
Objective
To leverage public data and novel simulation methods to estimate birthweight changes following simulated environmental interventions in two environmental justice communities in Massachusetts, US.
Methods
We gathered risk factor data from public sources (US Census, Behavioral Risk Factor Surveillance System, and Massachusetts Department of Health). We then created synthetic individual-level datasets using combinatorial optimization, and probabilistic and logistic modeling. Finally, we used coefficients from a multi-stressor epidemiological model to estimate birthweight and birthweight improvement associated with simulated environmental interventions.
Results
We created geographically-resolved synthetic microdata. Mothers with the lowest predicted birthweight were those identifying as Black or Hispanic, with parity > 1, utilization of government prenatal support, and lower educational attainment. Birthweight improvements following greenness and temperature improvements were similar for all high-risk groups and were larger than benefits from smoking cessation.
Significance
Absent private health data, this methodology allows for assessment of cumulative risk and health inequities, and comparison of individual-level impacts of localized health interventions.
Keywords: multi-stressor epidemiology, synthetic population microdata, cumulative risk assessment, public data, vulnerable populations, exposure modeling
1. Introduction
Health risk assessments have historically focused on individual stressors with distinct sources [1, 2]. Recently, such assessments have broadened to include impacts of exposure to multiple chemical stressors [1]. Many disadvantaged communities, including those designated as “environmental justice communities,” are exposed to multiple chemical and physical stressors and experience social stressors (e.g., material hardship), with deleterious effects on health [3–5]. Therefore, cumulative approaches to health risk assessment are needed. A 2009 National Research Council (NRC) committee [1] provided recommendations for how cumulative risk assessment could better incorporate multiple types of stressors, e.g., through adoption of techniques from social epidemiology to capture health impacts related to non-chemical stressors, and development of screening techniques (e.g., by using public data) to provide simpler tools for decision-making.
Epidemiological models that include non-chemical stressors and chemical mixtures as risk factors (i.e., “multi-stressor models”) are a key component of advancing cumulative risk assessment and addressing health inequities influenced by social factors and the built environment [6, 7]. Multi-stressor epidemiological models can explicitly quantify and compare the impact of changes to environmental and individual risk factors [8]. However, widespread application of multi-stressor epidemiological models in cumulative risk assessment is limited, in part by the lack of corresponding risk factor data. Meaningful community-scale applications require risk factors that vary by socio-demographic categories at high spatial resolution. Such individual-level data are available from public datasets, e.g., the Behavioral Risk Factor Surveillance System (BRFSS), but rarely with the spatial resolution needed to evaluate the health benefits of community-scale actions. Furthermore, vulnerable populations may be less well-monitored for key stressors [9], which can hinder development of multi-stressor epidemiological models in these communities.
Computational techniques can be used to create the high-resolution datasets necessary for multi-stressor cumulative risk assessment. Constrained sampling of representative individual data from large geographic areas can generate synthetic population microdata in smaller geographic units that match aggregated unit-level data-tables [10]. Regression coefficients from a corresponding epidemiological model then permit simulation of the impact of proposed public health interventions. Social science applications (economics, sociology, geography) have used representative US Census data to create synthetic microdata and evaluate policy implications [11], but these techniques are less common in public health settings [12]. We previously applied and evaluated these methods to estimate behaviors such as smoking, hypertension, physical activity, and fruit and vegetable consumption [12–14], and found that estimates aligned with published aggregated values.
In this work, we extend our prior methods to examine modeled shifts in birthweight distribution due to simulated environmental changes in two environmental justice communities in Massachusetts, US. Lower birthweight is a marker for exposure to both social and environmental stressors. Mothers from the most disadvantaged US communities (measured by financial instability, racial segregation and composition, and crime rates) have a 27 % higher chance of having a child with lower birthweight than do mothers from the least disadvantaged communities [15]. Furthermore, lower birthweight has been associated with modifiable environmental risk factors including exposure to higher fine particulate matter [16], ambient temperature [17], and nighttime noise [18], and living in an area with lower greenness [19]. Improvements in birthweight following changes to the modifiable environment around pregnant women have largely been unexplored – common interventions for improving birthweight include financial supplementation, nutritional supplementation, and smoking cessation programming [20]. We use a published multi-stressor epidemiological model for birthweight in Massachusetts (MA), which includes chemical and non-chemical stressors as predictors [21], and leverage risk factor data from public sources to demonstrate the public health application of combining multi-stressor epidemiology, exposure modeling, and microdata simulation methods.
2. Methods
Figure 1 presents an overview of the datasets and methods we used to estimate the impact of changes in environmental exposures on birthweight in Chelsea (8 census tracts covering 5.7 km2) and Dorchester (28 census tracts covering 17.6 km2), two environmental justice communities in the Greater Boston area (Figure S1). In Massachusetts, environmental justice communities are those that meet any of the following criteria [22]: annual median household income less than or equal to 65 percent of the statewide median ($62,072 in 2010); at least 25% of residents identify as a race other than white; or at least 25% of households have limited ability to communicate in English. In addition, these communities are partners of our Environmental Health Disparities center, called the Center for Research on Social Stressors in Housing across the life course (CRESSH).
Figure 1.

Schematic of modeling methods used to create a synthetic population of mothers and newborns in Chelsea and Dorchester, Massachusetts using publically available data.
2.1. Multi-stressor epidemiological model of birthweight
We leveraged regression coefficients from a published multi-stressor epidemiological model to predict birthweight using individual socio-demographic, socio-behavioral, and clinical characteristics, and neighborhood-level economic and environmental risk factors [21]. The underlying dataset for the model was a cohort of singleton live births for the years 2001 to 2011 from the Massachusetts birth registry, excluding records of low or high birthweight (< 500 g, > 6,000 g respectively), and gestational age > 42 weeks. Socio-demographic, socio-behavioral and clinical predictors included newborn’s birthweight (grams), season of birth, gestational age (weeks), maternal government support for prenatal care (yes/no), race (Black/white/other), maternal age at birth, parity (child is mother’s first-born: parity = 1; child is not mother’s first-born: parity > 1), maternal smoking prior to or during pregnancy (yes/no), maternal educational attainment (less than high school, high school, some college, college, advanced degree beyond college), diabetes mellitus (yes/no), and chronic hypertension (yes/no). Environmental and economic risk factors at the tract-level were also included as risk factors (described below). See Table S1 for regression coefficients.
2.2. Synthetic population microdata and exposures
We expanded on our previous methods [12] to generate synthetic microdata for mothers in Chelsea and Dorchester in 2010. We first applied simulated annealing with replacement to build microdata for the general population of Chelsea and Dorchester. We then used simulated annealing without replacement, probability sampling, and logistic regression modeling to create maternal characteristics of the population of women who gave birth. Finally, we used simple probabilistic and regression models to predict newborn characteristics.
Socio-demographic risk factors.
To generate general population microdata, we first gathered American Community Survey (ACS) 5-year data for 2010 to 2014 [23] at the census tract level in Chelsea and Dorchester and created univariate and cross-tabulations of person-level and household-level variables. The person-level tabulations were ancestry, sex, age, educational attainment, sex by age, sex by educational attainment, age by educational attainment, and sex by age by educational attainment. We categorized ancestry by separating out groups that represented 1% or more of total neighborhood population and grouping all other ancestries into a single category; this amounted to 20 ancestry categories in Chelsea and 14 categories in Dorchester (See Table S2). We categorized age (in years) into the following groups: less than 18, 18 to 24, 25 to 34, 35 to 44, 45 to 64, and 65 and older. Educational attainment categories were less than 9th grade, 9th to 12th grade (no diploma), high school graduate (GED or alternative), some college (no degree), associate’s degree, bachelor’s degree, and graduate or professional degree. We assigned any person younger than 18 years to a unique education category. The household-level tabulations were head of household age, household income, rent/own, rent/own by head of household age, and household income by head of household age. Householder age categories (in years) were less than 25, 25 to 44, 45 to 64, and 65 and older. Household income categorizations were less than $10,000, increments of $5,000 from $10,000 to $50,000, $50,000 to $60,000, $60,000 to $75,000, $75,000 to $100,000, $100,000 to $125,000, $125,000 to $150,000, $150,000 to $200,000, and greater than $200,000.
We used these tabulations in the CO model [24], an open-source FORTRAN code that employs simulated annealing, to construct a synthetic population of Chelsea and Dorchester residents at the census tract level. In the CO model, the user imports a dataset of representative individual data (grouped by household) from a large geographic area, with the goal of resampling households (with replacement) into smaller geographic units until the error between observed and resampled individual and household constraint tables for each smaller geographic unit is minimized. The minimization is accomplished using a simulated annealing algorithm. In this paper, the source of individual and household-level data was the ACS Public Use Microdata Sample (PUMS) for 2010 to 2014 [25]. PUMS data are provided in aggregated geographic areas, called Public Use Microdata Areas (PUMAs), which are composed of 100,000 or more individuals. PUMS data are categorized identically to tables in the ACS, and are provided at the person level and the household level; the two datasets are connected by a house-specific serial number and reference person indicator (a value of “0” refers to the head of a household). We removed households without residents, and adjusted household income (using the ADJINC parameter). For household characteristics, we added additional categories to account for missing data: missing householder age by tenure, missing tenure, missing householder age by household income, and missing householder income. The CO model provides a metric to evaluate goodness-of-fit of synthetic microdata: the overall (i.e., summed) total absolute error (OTAE) per household [24]. OTAE = 1.00 represents an average of one error in socio-demographic characteristic per household (e.g., the wrong education level for one household member), and ‘good’ agreement is OTAE per household ≤ 1.0 [24].
After making a general synthetic population for each neighborhood, we modified the CO model to estimate which women in each neighborhood gave birth. To create necessary constraint tables, we calculated age- and race-adjusted birth rates (i.e., number of births per 1,000 women by race or age-group) by dividing age and race-specific state-wide birth totals from the Massachusetts Births report for 2010 [26] by state-wide population data from the ACS [23] (Table S3a & b). We then used these adjusted birth-rates and ACS data for each neighborhood to estimate births by race and age (separately) in Chelsea and Dorchester. We used a global non-linear optimization algorithm, DIRECT [27] via the platform NLOPT [28], to harmonize births-per-tract predicted by age and race-adjusted birth rates (rates in tract i were multiplied by αRace,i and αAge,i respectively, where 0.75 ≤ αRace,i, αAge,i ≤ 1.25). We scaled age and race-specific constraint tables by a factor of five to avoid small cross-tabulated populations during probability sampling for socio-behavioral and clinical characteristics. We modified the simulated annealing algorithm within CO to select households without replacement from the pool of available women in each tract. Given the high degrees of freedom for potential solutions, we created five population replications for each tract, and checked the stability of non-constrained population characteristics by calculating the coefficient of variation across replications.
In preparation for application of synthetic socio-demographic data with the multi-stressor epidemiological model, we re-categorized variables for maternal educational attainment and race/ethnicity. We re-categorized ACS educational attainment into the categories listed above. Following the epidemiological model, we re-categorized maternal race/ethnicity into non-Hispanic White, non-Hispanic Black, and a category that included mothers who identified as Hispanic, Asian, Pacific Islander, Native American Indian, and others, including multiple race/ethnicities.
Socio-behavioral and clinical risk factors.
Gestational age, parity, use of government-provided prenatal support, and prevalence of smoking, diabetes, and hypertension were not available in PUMS. However, these variables are available in public documents and datasets, namely, the Massachusetts Births report for 2010 [26] and the Behavioral Risk Factor Surveillance System (BRFSS) [29]. The Massachusetts Births report contains tables and figures which provide cross-tabulated distributions of gestational age by race, parity by age, use of government supported prenatal care by educational attainment, and smoking during pregnancy by race and education. We used these cross tabulations as probability sampling weights and predicted 1,000 outcome distributions for each mother.
To estimate hypertension and diabetes prevalence, we used BRFSS 2011 data for Massachusetts [29], as hypertension data were not collected in 2010 in Massachusetts. We created simple logistic regressions from socio-demographic predictors in PUMS for each outcome (X = existing diabetes, high blood pressure):
| (1) |
We then used Monte Carlo techniques to introduce uncertainty into model predictions, similar to our previous work [12]. Briefly, the logistic models provide estimates of each regression parameter βi, as well as an associated variance-covariance matrix. We generated 1,000 estimates of each βi using β (the set of all βi) and the variance-covariance matrix of β in a multivariate normal distribution (to adjust for correlation among socio-demographic predictors). Applying these estimates to synthetic socio-demographic data for each synthetic mother, we generated a matrix of N = 1,000 outcome probabilities for each regressed response variable. We subsequently used this matrix of probabilities in random draws from a Bernoulli distribution to create a distribution of N = 1,000 binary outcome values for each mother and outcome.
Neighborhood risk factors.
Finally, we assigned environmental exposures and economic risk factors to synthetic mothers by census tract. These variables were prepared in previous work [21]. In summary, our collaborators used hybrid methods to estimate daily average PM2.5 and ambient temperature at a 1 × 1 km grid [30, 31]; we averaged these to the tract-level for each trimester. We downloaded monthly satellite data of normalized differential vegetation index (NDVI) to 250 m buffers around addresses in Massachusetts [21] and averaged exposures to the tract level for each trimester. We obtained and averaged (to the tract level) an annual-average walkability index that incorporated provided services, street intersection density, and other factors [32, 33]. Our collaborators designed a machine-learning model that incorporated geo-spatial features to predict annual average nighttime noise at a 270 m grid [34]; we averaged these estimates to the tract level. We used two metrics to quantify the mixture of household income levels within tracts [35]: economic residential segregation (ERS), which ranges from −1 to 1 (where −1 means a higher proportion of low income households), and the index of economic dissimilarity (IED), which ranges from 1 to 100 % (where lower means more similarity in household incomes in a specific tract).
Newborn characteristics.
We assigned each mother a singleton birth with a modeled estimate of newborn birth season. We simulated birth season by fitting a simple linear regression model (with the predictors month and day-type, e.g., Mondays, non-Monday weekdays, Saturdays, and Sundays) to Centers for Disease Control and Prevention (CDC) data for counts of births in Massachusetts (vaginal and Cesarean) from 2003 to 2018, totaled by year, month, and day of week [36]. We then assigned a percentage of total annual births to each day of the sample year (2010), i.e., the probability of a synthetic birth on that day, which we used to simulate newborn birthdays and birth season.
The resulting synthetic microdata included socio-demographic, socio-behavioral, clinical, environmental, and economic risk factors for each reproductive-aged woman living in Chelsea and Dorchester, and an assigned singleton newborn with sex and birth season. We calculated distributions and mean birthweight for each newborn (assumed to be healthy) by applying the predictor coefficients from the multi-stressor model [21] (displayed in Table S1) to synthetic socio-demographic and neighborhood risk factor data and each of the Monte Carlo predictions for socio-behavioral and clinical risk factors.
2.3. Combined application of multi-stressor models and synthetic methods
To illustrate the analyses possible from the combination of multi-stressor epidemiology and exposure models, we present comparisons between population subsets, and a comparison of the sociodemographic and geographic patterns of benefits for simulated reductions in environmental exposures. Throughout this work, we ran the CO model on a single laptop computer, and used the R scripting language [37] for pre- and post-processing.
In Section 3.1, we characterize the efficacy of the synthetic population methodology and compare observed state-wide risk factor prevalence to predicted prevalence among synthetic mothers. This comparison highlights drivers of differences in birthweight for these neighborhoods. We also analyze spatial clustering and correlations among environmental exposures to facilitate interpretation of our findings.
In Section 3.2, we compare synthetic birthweight and risk factor prevalence at the neighborhood-level and among these mothers and newborns in the lowest tertile of synthetic birthweight (i.e., < 3,172 grams). We used birthweight tertiles given the narrow range of birthweights predicted using regressed coefficients. We discuss impacts among Black, Indigenous, and People of Color (BIPOC), which summarizes impacts on mothers identifying their race as Black, Hispanic, Asian, Pacific Islander, Native American Indian, or other (non-white) race/ethnicities.
Finally, in Section 3.3, we analyze impacts on birthweight following simulated improvements in environmental exposures and socio-behavioral changes. We modified exposures by increasing individual NDVI exposures to the 95th percentile of the distribution of exposures for each neighborhood, or decreasing noise or temperature exposure to the 5th percentile. For comparison, we also simulated a smoking cessation program. We re-assigned mothers in the highest tertile of smoking probability to the lowest tertile, and re-calculated birthweights. We did not investigate birthweight changes following modification of exposure to PM2.5, utilization of government support, or walkability, as regression coefficients were not statistically significant (PM2.5) or displayed an inverse relationship with birthweight (Table S1).
3. Results
3.1. Synthetic microdata: sociodemographic characteristics and environmental exposures
We successfully generated a synthetic cohort of mothers in Chelsea and Dorchester. Average census tract OTAE per household was 0.39 and 0.12 for Chelsea and Dorchester, both within the threshold of ‘good’ agreement [24]. Non-linear optimization produced tract-level population matches between race- and age-adjusted births (Table S4). The resulting census tract populations were similar in rank order to the average of unadjusted census tract populations (Spearman R2 = 0.97), meaning that census tracts maintained order by population size after optimized adjustment. In logistic models for diabetes and hypertension from BRFSS data, we observed higher probabilities of these outcomes for mothers over 40 years old and with less than a college education (Table S5). Regression models for birth season showed trends by day-of-week and month (Figure S2). Simulated annealing without replacement produced exact matches to the race- and age-adjusted birth rate tables (as expected given the high degrees of freedom). Sampling without replacement did not significantly affect time to CO model convergence. The variance in non-constrained parameters across the five replications was low (all tract-level coefficients of variation across replications were < 1.0, see Table S6 for sample data), therefore we present results below for a single population replication.
Table 1 presents characteristics of the synthetic population of women who gave birth in Chelsea and Dorchester. Compared to state averages, newborns in Chelsea and Dorchester had lower mean birthweight, and mothers were younger, were predominately BIPOC, had higher utilization of government-sponsored prenatal care, and had lower rates of high-school graduation. The predicted prevalence of maternal smoking prior to or during pregnancy was approximately half the state average in both communities. The rates of hypertension and diabetes in the synthetic cohort were higher than observed in Massachusetts [21], however, they reflect the percentages from the Massachusetts BRFSS for 2011 (Table S7). Compared to state levels, mean PM2.5 in Chelsea and Dorchester was higher, mean ambient temperature was higher, mean NDVI was lower, and walkability (an index of urban features) was more than twice as high. Nighttime noise was higher in these communities, much more so in Chelsea (likely given the proximity to Boston Logan Airport). Chelsea and Dorchester had lower economic residential segregation as well as slightly lower economic dissimilarity.
Table 1.
Birthweights and risk factor prevalence for mothers in the MA birth registry for 2001 to 2011 (21), and synthetic population birthweight and risk factors for women and newborns in Chelsea, and Dorchester in 2010. “Lowest BW” refers to mother-newborn pairs in the lowest tertile of predicted birthweight (< 3,172 g).
| MA Birth registry* | Chelsea |
Dorchester |
|||
|---|---|---|---|---|---|
| Synthetic | Synthetic Lowest BW | Synthetic | Synthetic Lowest BW | ||
| N | 640,659 | 2,475 | 1,059 | 7,535 | 2,253 |
| Birthweight, mean ± s.d. (grams) | 3,379.3 ± 533.2 | 3,201.6 ± 67.9 | 3,149.2 ± 18.3 | 3,208.6 ± 67.7 | 3,145.5 ± 22.8 |
| Socio-demographic risk factors | |||||
| Mother’s age (years) | 30.1 | 29.9 | 30.2 | 29.6 | 30.3 |
| Maternal race: | |||||
| % Race = Black | 8.5 | 4.4 | 6.0 | 50.0 | 68.6 |
| % Race = Hispanic, Asian, Pacific Islander, Native American Indian, or others | 21.6 | 77.6 | 94.0 | 35.7 | 31.4 |
| % Race = White | 69.9 | 18.0 | 0.0 | 14.3 | 0.0 |
| Educational attainment: | |||||
| % Did not complete high school | 11.3 | 33.7 | 62.1 | 18.4 | 40.7 |
| % Completed high school | 25.3 | 36.0 | 34.7 | 27.0 | 45.7 |
| % Completed some college | 21.5 | 11.2 | 2.2 | 24.7 | 8.2 |
| % Completed college | 26.0 | 15.2 | 1.0 | 23.1 | 4.4 |
| % Completed more than college | 15.9 | 3.8 | 0.0 | 6.8 | 1.0 |
| Neonatal characteristics: | |||||
| Gestational age | 39.0 | 38.6 | 38.5 | 38.6 | 38.5 |
| Clinical risk factors | |||||
| % Newborn is not 1st child (parity > 1) | 54.7 | 56.0 | 57.3 | 54.2 | 56.3 |
| % Has diabetes mellitus | 1.0 | 5.5 | 6.1 | 6.0 | 7.7 |
| % Has high blood pressure | 1.3 | 13.7 | 14.8 | 15.6 | 20.2 |
| Socio-behavioral risk factors | |||||
| % Smoked prior or during pregnancy | 14.2 | 5.8 | 6.2 | 4.7 | 6.8 |
| % Used government support while pregnant | 33.3 | 57.9 | 75.4 | 44.9 | 65.7 |
| Neighborhood risk factors | |||||
| Mean 1st trimester PM2.5 (μg/m3) | 10.5 | 11.0 | 11.0 | 10.9 | 10.9 |
| Mean 2nd trimester PM2.5 (μg/m3) | 10.4 | 11.0 | 11.0 | 10.9 | 10.9 |
| Mean 3rd trimester PM2.5 (μg/m3) | 10.4 | 11.0 | 11.0 | 11.0 | 11.0 |
| Mean 1st trimester Temperature (°C) | 10.9 | 11.6 | 11.5 | 11.3 | 11.1 |
| Mean 2nd trimester Temperature (°C) | 11.2 | 11.6 | 12.0 | 11.3 | 11.7 |
| Mean 3rd trimester Temperature (°C) | 11.4 | 11.6 | 11.7 | 11.7 | 11.8 |
| Mean 1st trimester NDVI | 0.5 | 0.3 | 0.3 | 0.4 | 0.4 |
| Mean 2nd trimester NDVI | 0.5 | 0.3 | 0.3 | 0.4 | 0.4 |
| Mean 3rd trimester NDVI | 0.5 | 0.3 | 0.3 | 0.4 | 0.4 |
| Mean walkability | 1.1 | 2.4 | 2.7 | 2.4 | 2.5 |
| Economic Residential Segregation (ERS): | |||||
| % between −1.0 and −0.6 | 2.6 | 0.0 | 0.0 | 0.0 | 0.0 |
| % between −1.0 and −0.2 | 19.0 | 23.0 | 30.8 | 27.5 | 35.5 |
| % between −0.2 and 0.2 | 39.3 | 77.0 | 69.2 | 68.7 | 63.7 |
| % between 0.2 and 0.6 | 33.5 | 0.0 | 0.0 | 3.7 | 0.8 |
| % greater than 0.6 | 5.6 | 0.0 | 0.0 | 0.0 | 0.0 |
| Mean Index of Economic Dissimilarity (IED) (%) | 16.9 | 15.1 | 14.3 | 14.3 | 14.7 |
| Mean nighttime noise levels (dB) | 43.5 | 50.2 | 50.5 | 44.0 | 44.1 |
Combines data from Table 1 and 2 from (21).
Acronyms: NDVI = Normalized Differential Vegetation Index
Figure 2 shows spatial relationships of neighborhood risk factors in Chelsea and Dorchester. We observed correlations between temperature and NDVI (R2 = 0.59 and 0.64 in Chelsea and Dorchester) and temperature and PM2.5 (R2 = 0.34 and 0.32) (Figure S3 and S4). Correlations between PM2.5 and NDVI were lower (R2 = 0.17 and 0.20). Walkability was slightly correlated with nighttime noise (R2 = 0.35 in Chelsea) and economic dissimilarity (R2 = 0.20 in Chelsea and 0.26 in Dorchester). PM2.5 and temperature showed similar spatial patterns in Dorchester: the highs of both variables were centered in the southwestern section of the neighborhood, which suggests that changes in environmental exposures in these census tracts may improve birthweight. Interestingly, NDVI was also high in this region, likely due to the nearby greenspace (Figure S5). Nighttime noise in Chelsea was highest near Boston Logan Airport (to the southwest), and in Dorchester, nighttime noise increased with proximity to the Boston city center.
Figure 2.

Annual average neighborhood-level economic and environmental exposures in Chelsea and Dorchester. Graph scales vary. Acronyms: NDVI = Normalized differential vegetation index, ERS = Economic residential segregation, IED = Index of economic dissimilarity.
3.2. Trends in risk factors of birthweight and lower birthweight
Mothers and newborns in the lowest tertile of modeled birthweight were majority BIPOC, had higher utilization of government prenatal support, and had lower educational attainment compared to women who gave birth in the overall population. Mothers with newborns in the lowest birthweight tertiles had similar neighborhood environmental and economic exposures to mothers with newborns in other tertiles.
We plotted the cumulative adverse nature of major risk factors for lower birth weight (Figure 3); the mothers with the highest risk of lower birthweight were those experiencing a combination of risk factors. We also plotted these risk factors spatially (Figure 4). In both Chelsea and Dorchester, there were spatial clusters of mothers and newborns in the lowest tertile of birthweight.
Figure 3.
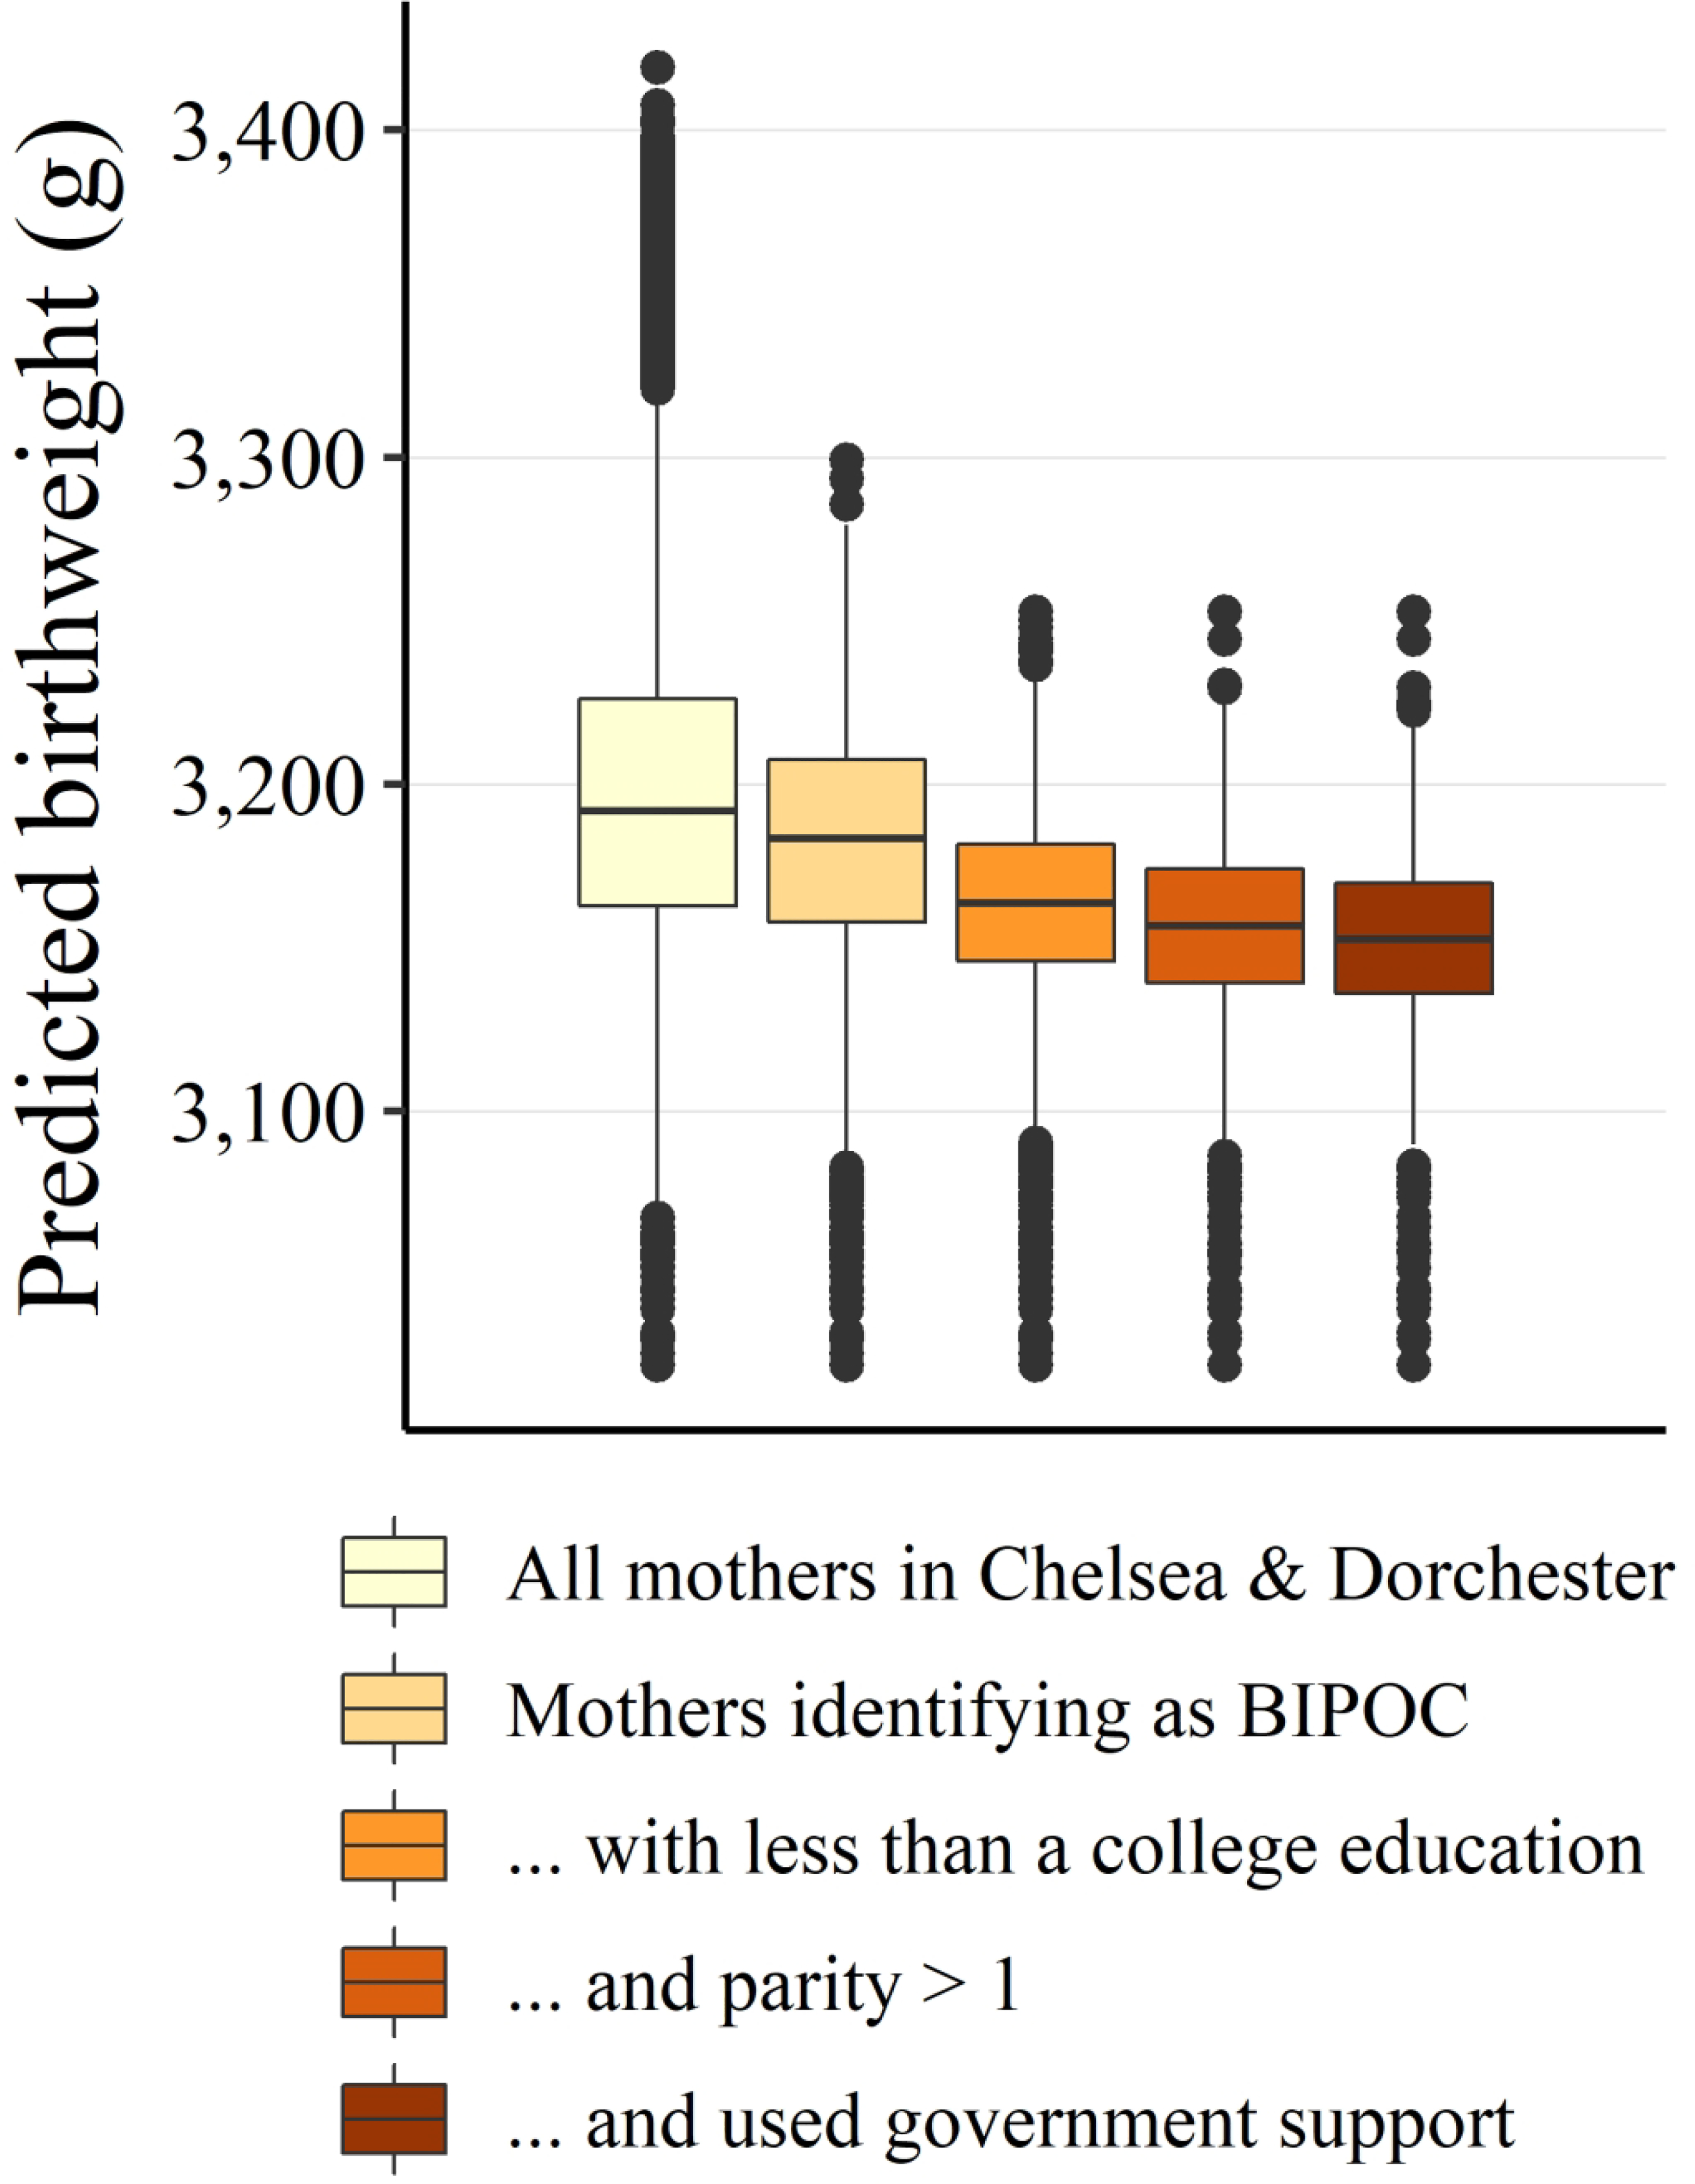
Distributions of predicted birthweight (grams), separated by common risk factors. Boxplots show the median (horizontal bar), inter-quartile range (IQR, box height), 1.5 × IQR (whiskers), and outliers (points). Acronyms: BIPOC = Black, Indigenous, and People of Color. Cumulative risk factor groupings are subsets of larger groups (e.g., Mothers identifying as BIPOC, with less than a college education, and parity > 1).
Figure 4.

Census tracts for Chelsea and Dorchester with the number (#) of newborns in the lowest tertile of synthetic birthweight. Graph scales vary by city. Acronyms: BIPOC = Black, Indigenous, and People of Color.
Other risk factors were associated with birthweight to a lesser degree. High impact socio-behavioral and clinical risk factors (i.e., smoking, diabetes, high blood pressure) were higher in prevalence for mothers in the lowest tertile of predicted birthweight. Walkability (a marker of urbanicity) was slightly higher for the lowest tertile mothers. Economic residential segregation and economic dissimilarity were also lower, meaning that lowest tertile mothers more likely lived in census tracts with many low-income households.
Mothers in the lowest tertile of modeled birthweight were older in both communities, in contrast to the maternal age regression coefficient that showed birthweight increasing with maternal age. This discrepancy highlights a benefit of combining multi-stressor methods with synthetic microdata: individual risk factors and spatial clustering for specific communities are included in health outcome calculations.
3.3. Impact of improvements in environmental exposures on birthweight
Changes to modifiable environmental exposures (Table S8) resulted in modest birthweight improvements. Reducing noise levels increased mean birthweight by 1.9 grams. Increasing trimester-average NDVI exposure to the 95th percentile increased mean birthweight of 8.8 grams. Adjusting trimester-average temperature exposure to the 5th percentile increased mean birthweight by 14.8 grams.
The spatial nature of birthweight improvement followed from the distribution of environmental exposures. In Chelsea, the largest increases in birthweight occurred in the southernmost tracts closest to Boston Logan Airport. In Dorchester, the lowest birthweight census tract was adjacent to local greenspace, and given that NDVI was defined in a buffer, many lower birthweight newborns in that region had high NDVI exposure. Thus, in this tract in Dorchester, birthweight gains from modifications to environmental exposures were not as high as in other neighborhoods, e.g., the northernmost tracts, which had lower numbers of mothers identifying as BIPOC.
Figure 5 describes how each exposure change influenced birthweight in high-risk population groups. Noise reduction benefits increased as underlying risk of lower birthweight increased. NDVI improvements were similar for all high-risk groups, with large outliers. Temperature improvements were similar for all high-risk groups, with few outliers. The benefits of smoking cessation for mothers identifying as BIPOC were lower than benefits from temperature or NDVI improvements, as expected given low prevalence of smoking among BIPOC mothers with low educational attainment[26].
Figure 5.

Change in birthweight following environmental exposure improvements and smoking cessation for different high-risk population groups. Boxplots show the median (horizontal bar), inter-quartile range (IQR, box height), 1.5 × IQR (whiskers), and outliers (points). Acronyms: BIPOC = Black, Indigenous, and People of Color; NDVI = Normalized differential vegetation index. Cumulative risk factor groupings are subsets of larger groups (e.g., Mothers identifying as BIPOC, with less than a college education, and parity > 1).
4. Discussion
In this study, we demonstrated a novel methodology for conducting community-scale cumulative risk assessments: combining a synthetic population and its associated multi-stressor exposure estimates with a multi-stressor epidemiological model. The results leveraged modeled relationships and the prevalence of underlying individual risk factors and neighborhood-level risk factors, and allowed us to directly compare the benefits of simulated exposure improvements. The mothers in the synthetic population with the highest risk of giving birth to a newborn with lower birthweight were those with a combination of risk factors, including identifying as a BIPOC, lower educational attainment, parity > 1, and utilization of government support, which were cumulative in reducing birthweight and showed spatial clusters. Birthweight improvements following greenness and temperature improvements were similar for all high-risk groups and were larger than benefits from smoking cessation.
Each stage of our analysis highlighted elements of an expanded cumulative risk assessment. In examining risk factor prevalence, we identified potential drivers of birthweight differences in each community versus statewide. For example, smoking had lower prevalence in these communities, indicating that other factors may play a larger role in driving lower birthweight. Many of the drivers of low synthetic birthweight were as expected. High-risk populations were those with overlapping adverse risk factors and lower synthetic birthweight (Figure 3). Furthermore, these risk groups were spatially clustered (Figure 4). This finding highlights a benefit of incorporating synthetic population data with multi-stressor models: community-specific drivers of lower birthweight depend on who lives where. The combined methodology of a multi-stressor epidemiological model and exposure models connected to synthetic microdata provides a mechanism for direct comparison of interventions (Figure 5) in absence of access to private health data, as opposed to comparison of generalized benefits calculated by multiplying exposure improvements (Table S8) by a corresponding regression coefficient (Table S1). As well, although the magnitudes of birthweight improvement predicted by neighborhood-level changes in exposure (Table S8) were similar to those predicted using our framework, the individualized nature of the combined methodology allowed us to examine birthweight changes for different sub-populations (Figure 5) in ways that enhance decision-making.
The estimated birthweight increases associated with simulated improvements in environmental exposures were comparable in magnitude to results of real-life interventions via other mechanisms. An analysis of randomized control trials and cluster-randomized trials for smoking cessation during pregnancy showed a mean improvement in birthweight of 53.9 g [38]. A meta-analysis of multiple micronutrient supplements in low-income countries showed a mean increase in birthweight of 22.4 g [39], while a systematic review of multiple micronutrient supplementation in a wider range of countries showed a weighted mean improvement in birthweight of 52.6 g [40]. Finally, a conditional cash-transfer program in Mexico, called “Oportunidades,” provided a suite of interventions to low-income families, e.g., healthcare, education, and nutritional supplements, which resulted in a mean birthweight improvement of 127.3 g [41]. Our modeled benefits were somewhat lower, but modifying environmental exposures to address neighborhood-level health inequities may have fewer implementation barriers compared to traditional hospital-centered randomized control trials for behavior change. As well, environmental improvements likely have many additional health benefits for local communities.
4.1. Limitations
We focused on birthweight, in part because of epidemiological analyses that have connected lower birthweight with increased mortality and morbidity throughout the life course. Recent reviews and meta-analyses have found significant between-study heterogeneity and statistically “weak” evidence that birthweight improvement leads to improved health and reduced disease later in life [42, 43]. However, birthweight remains an important marker of neonatal health and morbidity [44], as well as a useful first-order indicator of neighborhoods potentially in need of public health intervention.
Uncertainties were present at each step of synthetic population creation. All birthday were given the same probability, when there may be outliers on religious and other holidays. All individual and household-level constraints were given the same penalty in the synthetic population goodness-of-fit calculation. We were limited by the tables prepared in the Massachusetts Births report, including self-report of maternal behavior (e.g., smoking) which may bias distributions towards the null. The exposure estimation in this work assumed that mothers had the same residential address throughout their pregnancy. These would all have minimal effects on our findings. Monte Carlo techniques were employed to introduce uncertainty associated with selected regression model uncertainty, but we did not fully capture population uncertainty, resulting in bias towards the mean in our birthweight distributions. This likely reduces the impacts of proposed exposure improvements and limits our ability to directly investigate newborns with the lowest birthweights. The most granular ancestry data were available at the census tract level, and downscaling synthetic data into finer geographic units could allow for more targeted simulated exposure improvements.
There were also limitations in the multi-stressor epidemiological model. The impact of racist policies and other mechanisms that may drive historical differences in birthweight across racial and ethnic groups must be carefully considered, e.g., by expanded classification of racial and ethnic groups. Some risk factors may be proxies rather than direct causal agents (e.g., greenness [45]), which makes interpretation of exposure improvements challenging. Inclusion of interaction terms between stressors could capture synergistic or antagonistic associations.
4.2. Conclusions
This study demonstrates a technique for expanding cumulative human health risk assessments by using multi-stressor epidemiology and exposure models connected to synthetic population microdata. Many chemical and non-chemical stressors influence health outcomes, especially in vulnerable communities, and the application of epidemiological models in decision-making requires individual data and the ability to compare alternatives directly. Through the combined methodology, we can quantify differences in outcomes related to simulated changes in environmental exposures, with a focus on vulnerable populations and health inequities. In addition, all model components can be constructed using public data, which broadens the usability of these methods, particularly in communities with historically less available data. When customized for specific regions and contexts, synthetic population microdata, multi-stressor exposure models, and multi-stressor epidemiology are powerful tools for investigating interventions for vulnerable populations.
Supplementary Material
5. Acknowledgements
The authors appreciate feedback from the Center for Research on Social Stressors in Housing across the life course (CRESSH) advisory board, and acknowledge Fei Carnes for data processing.
7. Funding sources:
This research is part of the Center for Research on Social Stressors in Housing across the life course (CRESSH); NIH/NIHMD grants P50 MD010428 and US EPA RD83615601. The contents are solely the responsibility of the grantee and do not necessarily represent the official views of the USEPA. Further, USEPA does not endorse the purchase of any commercial products or services mentioned in the publication.
Footnotes
6 Conflict of interest
The authors declare no conflict of interest.
8 References
- 1.National Research Council, Science and Decisions: Advancing Risk Assessment. 2009: National Academies Press. [PubMed] [Google Scholar]
- 2.Sexton K, Cumulative health risk assessment: Finding new ideas and escaping from the old ones. Human and Ecological Risk Assessment: An International Journal, 2015. 21(4): p. 934–951. [Google Scholar]
- 3.Institute of Medicine Committee on Environmental Justice, Toward environmental justice: research, education, and health policy needs. 1999. [PubMed] [Google Scholar]
- 4.Clougherty JE, Shmool JL, and Kubzansky LD, The role of non-chemical stressors in mediating socioeconomic susceptibility to environmental chemicals. Current Environmental Health Reports, 2014. 1(4): p. 302–313. [Google Scholar]
- 5.Hicken MT, Gee GC, Morenoff J, Connell CM, Snow RC, and Hu H, A novel look at racial health disparities: the interaction between social disadvantage and environmental health. American journal of public health, 2012. 102(12): p. 2344–2351. [DOI] [PMC free article] [PubMed] [Google Scholar]
- 6.Gee GC and Payne-Sturges DC, Environmental health disparities: a framework integrating psychosocial and environmental concepts. Environmental health perspectives, 2004. 112(17): p. 1645–1653. [DOI] [PMC free article] [PubMed] [Google Scholar]
- 7.Payne-Sturges D, Gee GC, Crowder K, Hurley BJ, Lee C, Morello-Frosch R, et al. , Workshop Summary: Connecting social and environmental factors to measure and track environmental health disparities. Environmental research, 2006. 102(2): p. 146–153. [DOI] [PubMed] [Google Scholar]
- 8.Morello-Frosch R and Shenassa ED, The environmental “riskscape” and social inequality: implications for explaining maternal and child health disparities. Environ Health Perspect, 2006. 114(8): p. 1150–3. [DOI] [PMC free article] [PubMed] [Google Scholar]
- 9.Burgard SA and Chen PV, Challenges of health measurement in studies of health disparities. Soc Sci Med, 2014. 106: p. 143–50. [DOI] [PMC free article] [PubMed] [Google Scholar]
- 10.Hermes K and Poulsen M, A review of current methods to generate synthetic spatial microdata using reweighting and future directions. Computers Environment and Urban Systems, 2012. 36(4): p. 281–290. [Google Scholar]
- 11.Ballas D, Clarke G, and Turton I, Exploring Microsimulation Methodologies for the Estimation of Household Attributes, in International Conference on GeoComputation. 1999: Mary Washington College, Virginia, USA. [Google Scholar]
- 12.Levy JI, Fabian MP, and Peters JL, Community-Wide Health Risk Assessment Using Geographically Resolved Demographic Data: A Synthetic Population Approach. Plos One, 2014. 9(1). [DOI] [PMC free article] [PubMed] [Google Scholar]
- 13.Peters JL, Fabian MP, and Levy JI, Epidemiologically-informed cumulative risk hypertension models simulating the impact of changes in metal, organochlorine, and non-chemical exposures in an environmental justice community. Environmental research, 2019. 176: p. 108544. [DOI] [PMC free article] [PubMed] [Google Scholar]
- 14.Basra K, Fabian MP, Holberger RR, French R, and Levy JI, Community-engaged modeling of geographic and demographic patterns of multiple public health risk factors. International journal of environmental research and public health, 2017. 14(7): p. 730. [DOI] [PMC free article] [PubMed] [Google Scholar]
- 15.Ncube CN, Enquobahrie DA, Albert SM, Herrick AL, and Burke JG, Association of neighborhood context with offspring risk of preterm birth and low birthweight: A systematic review and meta-analysis of population-based studies. Social Science & Medicine, 2016. 153: p. 156–164. [DOI] [PMC free article] [PubMed] [Google Scholar]
- 16.Zhu X, Liu Y, Chen Y, Yao C, Che Z, and Cao J, Maternal exposure to fine particulate matter (PM2.5) and pregnancy outcomes: a meta-analysis. Environ Sci Pollut Res Int, 2015. 22(5): p. 3383–96. [DOI] [PubMed] [Google Scholar]
- 17.Zhang Y, Yu C, and Wang L, Temperature exposure during pregnancy and birth outcomes: An updated systematic review of epidemiological evidence. Environ Pollut, 2017. 225: p. 700–712. [DOI] [PubMed] [Google Scholar]
- 18.Smith RB, Fecht D, Gulliver J, Beevers SD, Dajnak D, Blangiardo M, et al. , Impact of London’s road traffic air and noise pollution on birth weight: retrospective population based cohort study. BMJ, 2017. 359: p. j5299. [DOI] [PMC free article] [PubMed] [Google Scholar]
- 19.Ebisu K, Holford TR, and Bell ML, Association between greenness, urbanicity, and birth weight. Science of the Total Environment, 2016. 542: p. 750–756. [DOI] [PMC free article] [PubMed] [Google Scholar]
- 20.Barker M, Dombrowski SU, Colbourn T, Fall CHD, Kriznik NM, Lawrence WT, et al. , Intervention strategies to improve nutrition and health behaviours before conception. Lancet, 2018. 391(10132): p. 1853–1864. [DOI] [PMC free article] [PubMed] [Google Scholar]
- 21.Yitshak-Sade M, Fabian MP, Lane KJ, Hart JE, Schwartz JD, Laden F, et al. , Estimating the Combined Effects of Natural and Built Environmental Exposures on Birthweight among Urban Residents in Massachusetts. International journal of environmental research and public health, 2020. 17(23): p. 8805. [DOI] [PMC free article] [PubMed] [Google Scholar]
- 22.Massachusetts Department of Environmental Protection (MASS DEP). Environmental Justice Populations in Massachusetts. Available from: https://www.mass.gov/info-details/environmental-justice-populations-in-massachusetts.
- 23.US Census Bureau. 2010 American Community Survey (ACS) 5-year estimates. [Accessed on January 15, 2019]; Available from: data.census.gov. [Google Scholar]
- 24.Williamson P. CO Code and Documentation. Working Paper 2007/1 (v. 07.06.25) ed: Population Microdata Unit, Department of Geography, University of Liverpool; 2007. [Accessed on January 15, 2019]; Available from: http://pcwww.liv.ac.uk/~william/microdata/CO%20070615/CO_software.html. [Google Scholar]
- 25.US Census Bureau. 2010–2014 American Community Survey 5-year Public Use Microdata Samples (PUMS). [Accessed on January 15, 2019]; Available from: data.census.gov. [Google Scholar]
- 26.Massachusetts Department of Public Health, Massachusetts Births 2010. 2013. Available from: https://www.mass.gov/doc/2010-report-2/download. [Google Scholar]
- 27.Jones DR, Perttunen CD, and Stuckman BE, Lipschitzian optimization without the Lipschitz constant. Journal of optimization Theory and Applications, 1993. 79(1): p. 157–181. [Google Scholar]
- 28.Johnson SG The NLopt nonlinear-optimization package. Available from: http://github.com/stevengj/nlopt.
- 29.Centers for Disease Control and Prevention (CDC), Behavioral Risk Factor Surveillance System Survey Data (BRFSS). 2011: Atlanta, GA. Available from: https://www.cdc.gov/brfss/annual_data/annual_2011.htm. [Google Scholar]
- 30.Kloog I, Chudnovsky AA, Just AC, Nordio F, Koutrakis P, Coull BA, et al. , A new hybrid spatio-temporal model for estimating daily multi-year PM2.5 concentrations across northeastern USA using high resolution aerosol optical depth data. Atmospheric Environment, 2014. 95: p. 581–590. [DOI] [PMC free article] [PubMed] [Google Scholar]
- 31.Kloog I, Nordio F, Coull BA, and Schwartz J, Predicting spatiotemporal mean air temperature using MODIS satellite surface temperature measurements across the Northeastern USA. Remote sensing of environment, 2014. 150: p. 132–139. [Google Scholar]
- 32.James P, Kioumourtzoglou MA, Hart JE, Banay RF, Kloog I, and Laden F, Interrelationships Between Walkability, Air Pollution, Greenness, and Body Mass Index. Epidemiology, 2017. 28(6): p. 780–788. [DOI] [PMC free article] [PubMed] [Google Scholar]
- 33.US Environmental Protection Agency, Smart location database. Technical documentation and user guide. 2014. [Google Scholar]
- 34.Mennitt DJ and Fristrup KM, Influence factors and spatiotemporal patterns of environmental sound levels in the contiguous United States. Noise Control Engineering Journal, 2016. 64(3): p. 342–353. [Google Scholar]
- 35.Krieger N, Waterman PD, Batra N, Murphy JS, Dooley DP, and Shah SN, Measures of local segregation for monitoring health inequities by local health departments. American journal of public health, 2017. 107(6): p. 903–906. [DOI] [PMC free article] [PubMed] [Google Scholar]
- 36.United States Department of Health and Human Services (US DHHS) Centers for Disease Control and Prevention (CDC) National Center for Health Statistics (NCHS) Division of Vital Statistics. Natality public-use data 2007–2018, on CDC WONDER Online Database. 2019; Available from: http://wonder.cdc.gov/natality-current.html.
- 37.R Core Team. R: A language and environment for statistical computing. R Foundation for Statistical Computing, Vienna, Austria: 2017; Available from: https://www.R-project.org/. [Google Scholar]
- 38.Lumley J, Chamberlain C, Dowswell T, Oliver S, Oakley L, and Watson L, Interventions for promoting smoking cessation during pregnancy. Cochrane Database Syst Rev, 2009(3): p. CD001055. [DOI] [PMC free article] [PubMed] [Google Scholar]
- 39.Fall CH, Fisher DJ, Osmond C, Margetts BM, and Maternal G Micronutrient Supplementation Study, Multiple micronutrient supplementation during pregnancy in low-income countries: a meta-analysis of effects on birth size and length of gestation. Food Nutr Bull, 2009. 30(4 Suppl): p. S533–46. [DOI] [PMC free article] [PubMed] [Google Scholar]
- 40.Ramakrishnan U, Grant FK, Goldenberg T, Bui V, Imdad A, and Bhutta ZA, Effect of multiple micronutrient supplementation on pregnancy and infant outcomes: a systematic review. Paediatric and perinatal epidemiology, 2012. 26: p. 153–167. [DOI] [PubMed] [Google Scholar]
- 41.Barber SL and Gertler PJ, The impact of Mexico’s conditional cash transfer programme, Oportunidades, on birthweight. Trop Med Int Health, 2008. 13(11): p. 1405–14. [DOI] [PMC free article] [PubMed] [Google Scholar]
- 42.Belbasis L, Savvidou MD, Kanu C, Evangelou E, and Tzoulaki I, Birth weight in relation to health and disease in later life: an umbrella review of systematic reviews and meta-analyses. BMC Med, 2016. 14(1): p. 147. [DOI] [PMC free article] [PubMed] [Google Scholar]
- 43.Malin G, Morris R, Riley R, Teune M, and Khan K, When is birthweight at term (≥ 37 weeks’ gestation) abnormally low? A systematic review and meta-analysis of the prognostic and predictive ability of current birthweight standards for childhood and adult outcomes. BJOG: An International Journal of Obstetrics & Gynaecology, 2015. 122(5): p. 634–642. [DOI] [PMC free article] [PubMed] [Google Scholar]
- 44.Malin G, Morris R, Riley R, Teune M, and Khan K, When is birthweight at term abnormally low? A systematic review and meta-analysis of the association and predictive ability of current birthweight standards for neonatal outcomes. BJOG: An International Journal of Obstetrics & Gynaecology, 2014. 121(5): p. 515–526. [DOI] [PMC free article] [PubMed] [Google Scholar]
- 45.James P, Banay RF, Hart JE, and Laden F, A Review of the Health Benefits of Greenness. Curr Epidemiol Rep, 2015. 2(2): p. 131–142. [DOI] [PMC free article] [PubMed] [Google Scholar]
Associated Data
This section collects any data citations, data availability statements, or supplementary materials included in this article.