

Abstract
Prefractionation of complex mixtures of proteins derived from biological samples is indispensable for proteome analysis via top-down mass spectrometry (MS). Polyacrylamide gel electrophoresis (PAGE), which enables high-resolution protein separation based on molecular size, is a widely used technique in biochemical experiments and has the potential to be useful in sample fractionation for top-down MS analysis. However, the lack of a means to efficiently recover the separated proteins in-gel has always been a barrier to its use in sample prefractionation. In this study, we present a novel experimental workflow, called Passively Eluting Proteins from Polyacrylamide gels as Intact species for MS (‘PEPPI-MS’), which allows top-down MS of PAGE-separated proteins. The optimization of Coomassie Brilliant Blue staining followed by the passive extraction step in the PEPPI-MS workflow enabled the efficient recovery of proteins, separated on commercial precast gels, from a wide range of molecular weight regions in under 10 minutes. Two-dimensional separation combining off-line PEPPI-MS with on-line reversed-phase liquid chromatographic separation resulted in identification of over 1000 proteoforms recovered from the target region of the gel (≤50 kDa). Given the widespread availability and relatively low cost of traditional SDS-PAGE equipment, the PEPPI-MS workflow will be a powerful prefractionation strategy for top-down proteomics.
Keywords: Polyacrylamide gel electrophoresis, Coomassie Brilliant Blue, Fractionation, Mass spectrometry, Top-down proteomics, Native mass spectrometry, 21 tesla FT-ICR
Introduction
Sodium dodecyl sulfate-polyacrylamide gel electrophoresis (SDS-PAGE) is a standard protein separation technique vital to biochemistry, molecular biology, and proteomics research. The widely-used SDS-PAGE protocol established by Laemmli1 separates linearized (denatured by SDS) protein molecules based on their size as they migrate through the cross-linked polyacrylamide mesh under the influence of an applied electric field. SDS-PAGE is often used in analyses of complex mixtures extracted from biological samples because it enables high-resolution separation of proteins at low cost. SDS-PAGE has been one of the major options for sample prefractionation in mass spectrometry (MS)-based proteomics studies.2–6 Proteins separated by SDS-PAGE are fixed, visualized by staining with dyes (e.g., Coomassie or silver stain), and bands containing proteins of interest are cut from the gel. These gel pieces are then saturated in solutions containing reagents to reduce, alkylate, and destain the proteins contained within. This is followed by in-gel protease digestion (usually with trypsin) and extraction of the resulting peptides. Tryptic peptides are generally small (< 3 kDa), are easily separated by reversed-phase liquid chromatography (LC), and fragment efficiently by collision-induced dissociation methods. Thus, this approach has been widely adopted as it suits the resolution and sensitivity capabilities of most MS instruments.
Intact protein or “top-down” MS methods suffer several additional analytical limitations compared to their “bottom-up” (tryptic peptide-based) counterparts, chiefly because signal-to-noise (S:N) ratio is inversely proportional to the molecular weight (MW) of the analyte.7 As MW increases, ion current is distributed among wider charge state and isotope distributions, which ultimately translates to lower signal intensity. Additionally, specialized (and costly) high-resolution mass analyzers are required for charge state and accurate mass determination.8,9 For a time, these challenges, combined with the ease and success of in-gel digestion for peptide, and thereby protein characterization, hindered efforts to recover intact proteins from traditional SDS-PAGE gels for subsequent MS analysis.
Advances in MS instrumentation9–16 and fragmentation techniques17–21 have led to an increased interest in intact protein analysis, and have subsequently sparked efforts to improve prefractionation of complex proteoform mixtures.22–24 Size-based prefractionation methods are crucial to the success of top-down MS. Optimal online LC and MS data acquisition parameters that are appropriate for characterization of low-MW proteins differ greatly from those required for high-MW proteins (e.g., chromatography media, resolving power, activation type, m/z range, ion counts, extent of signal averaging, etc.). Additionally, low-MW proteins often interfere with the detection of coeluting proteins of higher MW since ion trapping instruments often used for such work have limitations in charge capacity.23,23
In 2008, Tran & Doucette introduced Gel-eluted liquid fraction entrapment electrophoresis (GELFrEE), a method for partitioning mixtures of proteins into discrete MW ranges by SDS-PAGE.25,26 In this method, a tube gel is housed between two chambers for sample loading and collection, and up to 500 μg of proteins are separated based on their electrophoretic mobilities. The MW-range of recovered proteins, elution times, and the resolution of separation are affected primarily by the acrylamide percentage of the polyacrylamide medium. GELFrEE fractionation systems are commercially available. More recently, Cai et al. developed a serial-size exclusion chromatography (sSEC) method in which multiple columns with size exclusion media of different pore sizes are connected serially for prefractionation of complex protein mixtures in MS-compatible buffers.27 This approach enables a higher resolution of separation compared to that of conventional SEC, and when combined with online reversed-phase LC significantly improves the detection of higher MW proteins (up to 223 kDa).
While not routinely implemented, applications involving global intact proteome and targeted top-down proteoform characterization have improved our understanding of numerous biological systems, and cemented a place for intact protein analysis by MS in the pantheon of proteomic approaches.22,23 However, traditional SDS-PAGE is not routinely preferred for the separation of proteins prior to MS analysis of intact species, primarily because procedures for efficient intact protein recovery are lacking. Proteins separated by PAGE are tightly trapped in the gel matrix and thus require additional treatments for their recovery, such as “active” extraction by electroelution or “passive” extraction by diffusion.28–32 These extraction procedures usually employ organic solvents or high concentrations of surfactants to overcome the affinities of the proteins toward the gel matrix.33–36 However, it is time consuming to extract a sufficient amount of protein, and the passive extraction of high-MW proteins (over 60 kDa) is usually difficult.37 Furthermore, detergents must be thoroughly removed from the recovered solution prior to analysis.
Establishing an efficient method to draw whole proteins from the traditional gel would facilitate the preparation of samples for intact analysis by MS in almost any laboratory, as no expensive, specialized equipment would be required (LCs or GELFrEE station). In this study, we aimed to establish a novel workflow and optimize conditions for passive extraction of intact proteins to markedly improve yields, while ensuring compatibility with MS. To improve protein recovery, Sheer and Ryan developed the syringe maceration extraction method (SME), which grinds the gel by repeatedly extruding it through the syringe orifice.38 Thorough disruption of the gel, SME was effective in improving protein recovery, and more than 90% of the 160-kDa standard protein could be recovered without the use of surfactants. However, SME was effective only in recovery from unstained gels. In contrast, an extreme reduction in protein recovery was observed from gels stained with Coomassie Brilliant Blue (CBB), a very popular staining reagent for PAGE-separated proteins. In conventional CBB formulations, the CBB dye is dissolved in an acidic solution. In this acidic environment, proteins form electrostatic and hydrophobic bonds with CBB dyes39 and are strongly immobilized to the surrounding gel matrix. Although this type of protein fixation method prevents protein diffusion in the gel matrix after PAGE, it significantly contributes to the impairment of protein recovery in passive extraction. Moreover, the use of an organic solvent (e.g., methanol or ethanol) for preparing conventional CBB exposes the hydrophobic parts of the protein, thereby enhancing its affinity to the surrounding gel matrix. Recently, aqueous formulations that avoid organic solvents and acetic acid are becoming more popular.40 In this study, we investigated passive extraction conditions for overcoming the excessive fixation of CBB-protein complexes in the gel matrix using aqueous CBB. Subsequently, we established an experimental workflow for introducing proteins, obtained by rapid passive extraction with aqueous CBB, into the mass spectrometer, and evaluated protein recovery by quantitative MS analysis. We also evaluated the efficacy of this workflow for pre-fractionation of complex mixtures of intact proteoforms for top-down analysis with high-resolution MS.
Experimental Section
Due to the volume of experiments described here, several experimental details can be found in the Supporting Information. These include aspects of the following: materials, SDS-PAGE, LC-MS/MS for iTRAQ-based protein quantification, protein quantification using SILAC, GELFrEE fractionation, protein precipitation, native-PAGE, native 2D-PAGE, native MS analysis of hemoglobin, and supplementary PEPPI-MS protocol for top-down proteomics. We believe the experiments described below provide a reasonable foundation for understanding the results presented without need to consult SI.
Protein Extraction from PAGE Gels
Protein bands of interest were excised from wet PAGE gels with a razor blade and transferred to a BioMasher disposable homogenizer tube (Nippi, Tokyo, Japan). The excised gel segments were uniformly ground for 30 seconds using a plastic pestle. To extract proteins, 300-500 μL of protein extraction solution A (100 mM ammonium bicarbonate, pH 8), B (0.1% (w/v) SDS/100 mM ammonium bicarbonate, pH 8), or C (for native PAGE-native running buffer or water and 0.1% (w/v) octylglucoside) were added to the macerated gels in the homogenizer tube and shaken vigorously (1500 rpm) at room temperature for 10 minutes on a MixMate desktop tube shaker (Eppendorf, Hamburg, Germany). After filtration through a 0.45-μm cellulose acetate membrane within a Spin-X centrifuge tube filter (Corning, Corning, NY, USA), the protein filtrate was concentrated using an Amicon centrifugal 3-kDa ultrafiltration device (Merck Millipore, Darmstadt, Germany).
iTRAQ
The compound eyes from wild-type Drosophila melanogaster (Canton-S) were isolated as described previously41 and used for the iTRAQ analysis. The compound eye tissues (n = 150) were homogenized in 300 μL NuPAGE LDS sample buffer (Thermo Fisher Scientific) containing 50 mM dithiothreitol. After centrifugation at 18,000 × g for 5 minutes, the supernatant was incubated at 70 °C for 10 minutes, followed by alkylation with 75 μL 1 M iodoacetamide for 30 minutes at room temperature. Protein concentrations were determined using a Qubit protein assay kit (Thermo Fisher Scientific) according to the manufacturer’s instructions. After SDS-PAGE of the tissue extract (15 μg of total protein), the separated proteins were recovered by passive extraction using 0.1% (w/v) SDS/100 mM ammonium bicarbonate (with shaking and filtration as described in Experimental Section “Protein Extraction from SDS-PAGE Gels”). Recovered proteins (“recovered sample”) were purified by methanol/chloroform/water precipitation as described in the Supporting Information, and the precipitated protein pellet was dissolved in 20 μL iTRAQ buffer containing 0.1% (w/v) of RapiGest surfactant (Waters, Milford, MA, USA). Another 15 μg aliquot of the extract (one that had not been subjected to SDS-PAGE) was dissolved in 20 μL iTRAQ buffer containing 0.1% (w/v) of RapiGest following methanol/chloroform/water precipitation and used as a control for quantitative analysis (“original sample”). After in-solution digestion of the recovered and original sample with 0.2 μg trypsin for 16 hours at 37 °C, the digested peptides were labelled with iTRAQ reagents (iTRAQ 113, 114, and 115 for original sample; iTRAQ 116, 117, and 118 for recovered sample) for 2 hours at room temperature. For labelling, each iTRAQ reagent was dissolved in 50 μl of isopropanol and added to the respective protein digests. The labelled samples were mixed with 25 μL 2% (v/v) trifluoroacetic acid (TFA), incubated for 30 minutes at 37 °C, and combined in a 1.5 mL microfuge tube. After centrifugation at 18,000 × g for 10 minutes, the digested peptides in the supernatant were fractionated using a Pierce high pH reversed-phase peptide fractionation kit (Thermo Fisher Scientific) and purified using self-made C18 STAGE tips. The obtained peptides were dried using vacuum centrifugation, resuspended in 0.1% (v/v) TFA, and subjected to LC-MS/MS analysis (detailed in the Supporting Information).
Top-Down Proteomics
Escherichia coli strain MG1655 (Coli Genetic Stock Center, Yale University) was grown in suspension in M9 minimal medium to the mid-to-late log phase. Cells were collected by centrifugation at 4,000 RCF for 15 min then suspended and lysed in 50 mM Tris buffer at pH 7.5 containing 100 mM NaCl, 1% (w/v) N-lauroylsarcosine and Halt protease inhibitor cocktail (Thermo Fisher Scientific). A Pierce microplate BCA protein assay (Thermo Fisher Scientific) was performed to determine the protein concentration. Prior to PAGE or GELFrEE separation, lysates were reduced with 1.0 mM dithiothreitol at 50 °C for 60 min and alkylated with 2.0 mM iodoacetamide at room temperature in the dark for 45 min.
Detailed descriptions of SDS-PAGE and protein extraction for PEPPI-MS fractionation are given in the Supporting Information (Supplemental Protocol). Briefly, aliquots of reduced an alkylated cell lysates containing ~80-110 μg protein were subjected to separation on NuPAGE Precast 4-12% Bis-Tris gradient gel (1-mm-thick, 10-well & 2D-well format, Thermo Fisher Scientific) with NuPAGE MES Running Buffer (Thermo Fisher Scientific) according to the manufacturer’s instructions. After electrophoresis, the region of the gel containing proteins ≤ 50 kDa was cut into nine pieces (or “fractions”) with bands collected across a total of nine gel lanes per fraction. Proteins were recovered by passive extraction using 300 μL 0.1% (w/v) SDS/100 mM ammonium bicarbonate. GELFrEE fractionation was performed on aliquots containing 100 μg proteins (details included in SI Supplementary Methods). For both PEPPI-MS and GELFrEE, recovered proteins were then purified by methanol/chloroform/water precipitation to remove SDS and other contaminants.
Following precipitation, E. coli PEPPI and GELFrEE fractions were immediately reconstituted in 35 μL of solvent A. These were analyzed by reversed-phase LC-MS/MS in duplicate. A blank gradient was run between duplicate runs of each fraction to reduce fraction-to-fraction carryover. For each injection, 4 μL was loaded onto an in-house-fabricated 360 μm O.D. × 150 μm I.D. fused-silica microcapillary trap column packed 2.5 cm with PLRP-S resin (5 μm particle, 1000 Å pore, Agilent Technologies, Palo Alto, CA, USA). The LC system (Acquity M-Class, Waters, Milford, MA, USA) was operated at a flow rate of 2.5 μL/min for loading onto the trap column and washed with 95% solvent A for 10 min. Separation was achieved on an in-house-fabricated analytical column packed 17.5 cm with PLRP-S resin. Samples were eluted over 100 min at a flow rate of 0.3 μL/min by use of the following gradient: 5-15% solvent B in 5 min, 15-50 %B in 80 min, 50-70 %B in 10 min, and 70-75 %B in 5 min. The gradients utilized LC-MS-grade solvent A: 0.3% formic acid and 5% acetonitrile in water, and solvent B: 47.5% acetonitrile, 47.5% 2-propanol, 4.7% water and 0.3% formic acid (% all expressed as v/v). Following separation, proteins were directly ionized by nanoelectrospray ionization (2.75 kV source voltage; 20 V SID) using a 15 μm fused-silica PicoTip emitter (New Objective, Woburn, MA) packed with 3 mm PLRP-S resin.
The instrument was operated in data-dependent mode with Xcalibur software (Thermo Fisher Scientific). All spectra were collected in the ion cyclotron resonance (ICR) mass analyzer at 21 tesla (T). Data acquisition parameters were varied based upon the expected MW range of the proteins contained in each fraction. For MSI spectra – resolving power (RP) was set to 300,000 at m/z 400; 1E6 automatic gain control (AGC) target; 3-6 microscans per spectrum; 600-2000 m/z range; source induced dissociation 20 V. For MS2 spectra – RP was set to 150,000 or 300,000 at m/z 400; 5E5 AGC target; 1-2 microscans per spectrum; 300-2000 m/z range. CID activation was performed with 10 m/z isolation width, 35% normalized collision energy, 10 ms activation period, 0.25 q, and 3-5 fragment ion fills of the multipole storage device42 were performed such that cumulative fragment ion targets were 1.5-2.5E6 prior to detection in the ICR cell. Dynamic exclusion was enabled with a repeat count of 1, repeat duration of 60 sec, and exclusion duration of 90 sec. Data-dependent selection was allowed over m/z 700-1400. Charge state rejection was enabled for [M+1H]+ and [M+2H]2+.
The data (.raw files) were uploaded to the National Resource for Translational and Developmental Proteomics Galaxy43 web portal (http://nrtdp.northwestern.edu/tdportal-request) for performing top-down proteomics database searches (UniProt E. coli, May 2016). This platform (TDPortal44) utilizes three search modes: a narrow absolute mass search (with intact mass measurement tolerance of 2.2 Da and 10 ppm fragment mass tolerance), a biomarker search (similar to traditional “no-enzyme” search) with biomarker and fragment mass tolerances set to 10 ppm, and a “find unexpected modifications” search that utilized an intact mass tolerance of 200 Da (“delta m” mode enabled) and a 10 ppm fragment mass tolerance. Carbamidomethylation of Cys residues was included as a fixed modification. Details regarding Xtract deconvolution parameters and other aspects of the data analysis can be found within the TDReport files (Supplemental Files 1–4), which can be viewed with TDViewer software (freely available at http://topdownviewer.northwestern.edu). Additional data analysis and visualization was carried out using TDViewer software and in-house-fabricated R package CRawFISh (https://github.com/davidsbutcher/CRawFISh). CRawFISh utilizes rawDiag45 for extracting scans and metadata from Thermo .raw files. Visualization of extracted data (heatmaps and intersection degree plots) was carried out using the R package ggplot2.46 UpSet plots were created using the R package UpSetR.47
MALDI MS
A human serum sample was passed through MARS Human 14 spin column (Agilent Technologies, Santa Clara, CA, USA) according to the manufacturer’s instructions and the 14 bound major protein components were used for the analysis. The bound proteins were eluted with 2 mL of MARS elution buffer (Agilent Technology) and purified by methanol/chloroform/water precipitation. After separating the 14 proteins (15 μg total protein/lane) by SDS-PAGE, the selected protein band was excised from the gel and the protein component was recovered by passive extraction with 0.1% (w/v) SDS/100 mM ammonium bicarbonate. The recovered protein was desalted using methanol/chloroform/water precipitation and reconstituted in 5 μL of 0.1% (v/v) TFA.
A 10 mg/mL solution of 1,5-diaminonaphthalene in 50% (v/v) acetonitrile/0.1% (v/v) TFA was used as the matrix-assisted laser desorption/ionization (MALDI) matrix. The sample was spotted onto a stainless steel MALDI sample plate and the matrix solution was overlaid on the sample spot. MALDI in-source decay (ISD) analysis was performed using a SHIMADZU MALDI-8020 mass spectrometer (Shimadzu, Kyoto, Japan). The obtained MALDI spectra were processed by the MALDI Solutions Data Acquisition software V2.5.1 and searched against the SwissProt proteome database (2017_02) using the online Mascot server (Matrix Science). In the MASCOT database search, the ion peak at m/z 3689 in the obtained MALDI-ISD spectrum was used as the “virtual precursor ion” and ISD fragments lower than m/z 3689 were considered as product ions derived from the virtual precursor ion. The following parameters were used for the database search: instruments type, MALDI ISD; taxonomy, mammals; Enzyme, none; mass values, average; protein mass, unrestricted; peptide mass tolerance, 2 Da; fragment mass tolerance, 2 Da; max missed cleavages, 0.
Native MS
For native MS analysis of the hemogobin (Hb) tetramer in human red blood cells (RBCs), human peripheral blood was collected from a healthy volunteer in accordance with the procedures approved by the human ethics committee of Ehime University. The peripheral blood sample was suspended in an equal volume phosphate-buffered saline, and gently layered onto 25 mL of Ficoll-Paque Plus (GE Healthcare). After centrifugation at 1500 rpm for 30 min, the RBC layer was carefully transferred to a 50-mL centrifuge tube by pipetting and was washed twice in PBS with centrifugation at 1500 rpm for 5 min. After removing the supernatant, the cell pellet (approx. 3 x 10⁹ cells) was homogenized with 500 μL of Novex IEF sample buffer (Thermo Fisher Scientific) and the supernatant obtained after centrifugation at 15000 rpm for 15 min at 4 °C was concentrated to 50 μL by ultrafiltration. After resuspension in 500 μL of Novex IEF sample buffer, the sample was concentrated again to 50 μL by ultrafiltration. Prepared samples were loaded onto Novex pH 3–10 IEF gels (5% (w/v) polyacrylamide, 2% (v/v) ampholytes) and subjected to native IEF as described above. After IEF separation, the gel pieces containing Hb bands were cut out and Hb was recovered from the gel pieces by the PEPPI workflow with 0.1% (w/v) octylglucoside. The recovered Hb was further separated using Novex NativePAGE 4–16% Bis-Tris Protein gel according to the manufacturer’s instructions. The gel-separated Hb was recovered again by the PEPPI workflow with 0.1% (w/v) octylglucoside. The recovered Hb was cleaned using a micro Bio-Spin size exclusion column (BioRad). For native MS analysis, the purified Hb solution was directly infused into the nano ESI source using a syringe pump at a flow rate of 1 μL/min. The Q-Exactive HF-X orbitrap mass spectrometer (Thermo Fisher Scientific) SLens RF value was set at 150, the source CID was 75 eV, the transfer tube temperature was 125 °C, and the HCD collision energy was 20 eV. The obtained MS data were processed using the Thermo Scientific Xcalibur software V4.1.31.9 (Thermo Fisher Scientific) and interpreted manually.
Results and Discussion
Highly Efficient Passive Extraction after CBB Staining
We first evaluated the use of aqueous CBB to develop a novel extraction workflow that would overcome the challenges associated with in-gel protein recovery. Rapid and sensitive aqueous CBB reagents are commercially available (e.g. Atto’s EzStain Aqua and BioRad’s Bio-Safe CBB G-250), although their use in passive extraction has not yet been reported. ATTO’s EzStain AQua consists of CBB and a stabilizing agent in water acidified with citric acid. EzStain AQua was capable of staining the gel with low background, and 16 ng bovine serum albumin (BSA) could be detected after washing the gel for 30 min (Figure S1). EzStain AQua is characterized by very short staining and de-staining times, which leads to a significant reduction in overall protocol time. Introduction of efficient gel-grinding technique is also indispensable for improving recovery. Here, we used a disposable plastic masher to crush the gel. The inner surface of the masher and the pestle were dimpled so that the gel could be quickly pulverized into fine pieces. To reduce sample loss by protein adsorption, all the steps from gel crushing to protein extraction were performed sequentially in the same masher tube. The recovered solution was concentrated by ultrafiltration.
The results evaluating the aqueous CBB effect in overcoming the affinities of the proteins toward the gel matrix are shown in Figure 1a and 1b. After SDS-PAGE of BSA, the polyacrylamide gel was stained with commercial aqueous CBB solution and the recovery of in-gel BSA by passive extraction with three different conditions (0.1% (w/v) SDS/100 mM ammonium bicarbonate, 100 mM ammonium bicarbonate, and HPLC-grade water) was examined (Figure 1a). When passively extracting with HPLC-grade water, we observed that the gel pieces remained stained after shaking for 10 minutes and no released BSA was recovered. On the other hand, extraction with 0.1% (w/v) SDS/100 mM ammonium bicarbonate rapidly released CBB dye from the crushed gel pieces, and the shredded gel was destained after 10 minutes. No CBB stain was visible in the polyacrylamide residue after filtering the extract. SDS-PAGE analysis of the extraction solution demonstrated that BSA could be successfully extracted by shaking for 10 minutes (Figure 1b). We have previously reported the recovery workflow of PAGE-separated proteins, employing a dissolvable polyacrylamide gel made with N,N’-bis(acryloyl)cystamine (BAC)-crosslinker with a disulfide bond.48 That method recovers proteins in 30 minutes by completely dissolving the BAC gel. However, passive extraction post-CBB staining recovers BSA from gels in only 10 minutes, significantly faster than gel dissolution. We evaluated extractions employing a 100 mM ammonium bicarbonate solution lacking SDS. Gels destained rapidly in the solution, and the BSA recovery was the same as that obtained with 0.1% (w/v) SDS/100 mM ammonium bicarbonate. In contrast, proteins stained with conventional CBB (containing methanol and acetic acid), were immobilized, apparently locked in place by methanol-acetic acid fixation. No BSA could be extracted from such gels, despite shaking with 100 mM ammonium bicarbonate for 10 minutes (Figure 1b).
Figure 1. Passive extraction of in-gel proteins separated by SDS-PAGE.

(a) Experimental workflow for passive extraction of CBB-stained BSA. For aqueous CBB staining, the gel was stained with EzStain Aqua CBB (ATTO) for 8 minutes, and washed for 30 minutes in water. Inset photo: gel pieces after protein extraction. Most of the CBB dye released into the solution upon passive extraction with 100 mM ABC was adsorbed on the membrane of the spin column occasionally resulting in a slightly blue hue. (b) SDS-PAGE images of BSA recovered from polyacrylamide gels stained with aqueous CBB and conventional CBB G-250. (c) Passive protein extraction under different pH conditions, (d) SDS-PAGE images of gel-recovered BSA. Separated BSA bands were visualized using BioSafe CBB (BioRad). CBB-stained BSA was extracted from polyacrylamide gels treated in two different ways: extraction performed immediately after PAGE (Wet) and extraction performed after gel dehydration and storage for 1 week (Dry 1W). (e) Recoveries for passive extraction. The recovery efficiency was estimated based on the intensity of each BSA band (Figure 1d).
Passive extraction without SDS was also performed at different pH conditions (Figure 1c). Different pH Britton-Robinson buffers (3 to 11) were used for extraction. At pH 3 and 4, the blue color of the stain did not fade and BSA was not recovered. CBB removal increased with incrementally elevated pH, as did the amount of BSA recovered. Maximum recovery was achieved at pH 7 to 11. These results indicate that the recovery of aqueous CBB-stained proteins is pH-dependent. Next, we quantified passive extraction recoveries after aqueous CBB staining (Figures 1d and 1e), comparing recoveries immediately following electrophoresis and from dried gels. Extraction with 100 mM ammonium bicarbonate yielded a recovery efficiency of 76 ± 5%. This recovery was superior to the previously reported recovery of BSA (59.7%) by dissolution of BAC gel.48 Even when gels were dehydrated for 1 hour with a gel dryer and stored at 20 °C for 1 week, a recovery efficiency of 44 ± 6% was achieved. Finally, extraction using 0.1% SDS/100 mM ammonium bicarbonate yielded almost the same recovery (75± 2%) as that obtained before gel drying (72 ± 3%).
PEPPI-MS after SDS-PAGE enabled selective recovery of proteins visualized with aqueous CBB. CBB binds electrostatically to arginine, lysine, and histidine residues of proteins in an acidic environment; however, loss of positive charge from these amino acid residues in an alkaline environment causes the dye to dissociate from the protein. Jin and Manabe previously reported that CBB release in a strong alkaline environment (0.1% NaOH, pH 13) reduces affinity of the protein to its surrounding gel, leading to improved efficiency of passive extraction.49 In this study, we demonstrated that CBB dye could dissociate from the aqueous CBB-stained gel in an environment with pH 7–11. Aqueous CBB may also be used for surfactant-free protein extraction, which is a significant advantage for direct-MS analysis of recovered proteins. In the case of surfactant-free extraction, it would be desirable to select the pH of the recovery buffer based on the pi of the target protein; in the case of retrieval of membrane proteins, decreased recovery rate may be a concern. Therefore, use of a low concentration of surfactant (e.g., 0.1% SDS) for passive extraction of samples is desirable for proteomic analysis.
Passive Extraction Workflow for MS-based Proteomics
With aqueous CBB acting as a recovery enhancer, we developed a high-speed passive extraction workflow to overcome the challenges associated with in-gel whole protein recovery (Figure 2a). We refer to this workflow by the acronym ‘PEPPI-MS’ (Passively Eluting Proteins from Polyacrylamide gels as Intact species for MS) for brevity. The PEPPI-MS workflow consists of: 1) PAGE separation, 2) CBB staining and gel band cutting, 3) gel crushing, 4) passive extraction, and 5) purification of the recovered protein. Following passive extraction, additional sample handling steps are required to further purify the proteins and to remove CBB and other contaminants. However, losses in these pretreatment processes result in reduced final recovery rates. In this workflow, methanol/chloroform/water precipitation50, which is effective for purification of trace protein, was adopted. Figure 2b illustrates the SDS-PAGE fractionation of Drosophila melanogaster proteins (15 μg) and their recovery by PEPPI-MS using 0.1% (w/v) SDS/100 mM ammonium bicarbonate. SDS-PAGE analysis of the recovered fractions revealed efficient extraction of proteins from the gel over a ~25-250 kDa MW range. To quantify PEPPI-MS performance, we evaluated protein recovery with iTRAQand performed tandem MS (Figures 2c and 2d). Initial and extracted protein solutions were digested (after passive extraction from the gel), labeled, mixed, and analyzed. For proteins below 100 kDa, the median protein recovery rate was 68%, and for high-MW proteins greater than 100 kDa, the median recovery rate was 57%. Among the 560 proteins identified by MS, 91% (508 proteins) were recovered at levels exceeding 50%. However, six proteins delivered recovery rates exceeding 100% (maximum 156%), suggesting that a change in protein structure due to SDS-PAGE may have increased the digestion efficiency relative to the unresolved proteins.
Figure 2. Large-scale verification of PEPPI-MS performance.

(a) Schematic illustration of the PEPPI-MS workflow. Red characters indicate the required time for each experiment, (b) Protein fractionation using the PEPPI workflow. Protein components extracted from Drosophila compound eyes were separated by SDS-PAGE and stained with aqueous CBB. After dividing the sample lane into six portions, proteins were extracted from each split gel using PEPPI. Extracted proteins were displayed on SDS-PAGE gels. (c) Histogram showing the protein recovery efficiency. Recovery rate of gel-separated Drosophila proteins was estimated by iTRAQ-based quantitative analysis. (d) Distribution of recovery efficiency with the theoretical molecular weight of recovered proteins.
We further verified the recovery efficiency by proteome-wide quantification using stable isotope labeling with amino acids in cell culture (SILAC) (Figure S2). In this experiment, effectiveness of the PEPPI-MS method for gels stained with conventional CBB solution (containing methanol and acetic acid) was also verified. After separation on 12% (w/v) SDS-PAGE, Saccharomyces cerevisiae protein extracts were separately stained using different CBB dyes and subjected to PEPPI-MS (Figures S2a–S2c). To quantify the recovery efficiency following PEPPI-MS, stable isotope-labelled yeast extract was added as an internal standard to the recovered protein prior to tryptic digestion. The recovery rates following PEPPI using aqueous CBB were similar to those observed in the iTRAQ labeled Drosophila samples (Figure S2d). Although conventional CBB staining was expected to decrease the recovery from PEPPI-MS because of methanol fixation, its recovery was actually somewhat better than that from aqueous CBB (Figure S2e). The addition of 0.1% (w/v) SDS improved the recovery rate from conventional CBB stained (i.e., methanol-fixed) gel samples. The release of CBB was also confirmed using gels stained with conventional CBB, in 0.1% SDS/bicarbonate ammonium solution. SDS is considered to contribute to the improvement of protein extraction by dissociating CBB from the protein and lowering the affinity between the two. For the recovery of low-MW proteins, fixed gels were superior to aqueous CBB stained gels (Figure S2f), suggesting that some in-gel proteins, especially small proteins, partially diffuse away during aqueous CBB staining, as it does not employ fixation. In contrast to protocols including fixation steps, aqueous CBB is fast and requires only a single step, thus greatly shortening the time required for recovering proteins.
Top-Down Mass Spectrometry of Gel Recovered Proteins
In the following top-down proteomic analysis, we used a PEPPI-MS workflow combining gel fixation with aqueous CBB staining to maximize recovery of low molecular weight proteoforms (Supplemental Protocol). As proof of the principle that PEPPI-MS can be used to prefractionate complex mixtures for top-down proteomic analysis, 100 μg aliquots of. E. coli MG1655 whole cell lysate were separated with a 4-12% NuPAGE gel and bands, here referred to as “fractions”, 1-9 were subjected to PEPPI-MS (Figures S3a and S3b). Recovered proteins were analyzed by 21 tesla (T) FT-ICR MS/MS at the National High Magnetic Field Laboratory (Tallahassee, FL, USA).14,51 Each fraction was run in duplicate, for a total of 18 LC-MS/MS experiments. The data (.raw files) were uploaded to the National Resource for Translational and Developmental Proteomics (NRTDP; based at Northwestern University) Galaxy web portal43 for performing top-down proteomics searches (TDPortal)44 and searched concurrently against forward and decoy databases (Table S1). This search resulted in identification of 372 proteins expressed as 1,016 proteoforms at a 1% false discovery rate (FDR). A replicate preparation of 9 additional PEPPI-MS fractions resulted in identification of 324 and 847 proteins and proteoforms, respectively (Table S2).
Representative data obtained from a single injection of fraction 3 are shown in Figure 3. The base peak chromatogram is shown in Figure 3a along with spectra depicting the charge-state distributions of proteins eluting over 10 chromatographic peaks. The protein identities (given by UniProt accession number) were manually validated. Global q-values and sequence coverage (% Cleavages) of each protein are also indicated. Figure 3b shows a zoom inset of the [M+18H]18+ charge state of 50 S ribosomal protein L10. These peaks are assigned with 0.66 ppm RMS error when compared to theoretical isotope distributions based upon the elemental composition of this proteoform. A singlescan CID MS/MS spectrum of membrane protein OsmE is given in Figure 3c, and corresponding fragment map given in Figure 3d. Example total ion and base peak chromatograms for each PEPPI-MS fraction are shown in Figure S4.
Figure 3. LC-21 T FT-ICR MS/MS of a Single Injection of PEPPI Fraction 3.
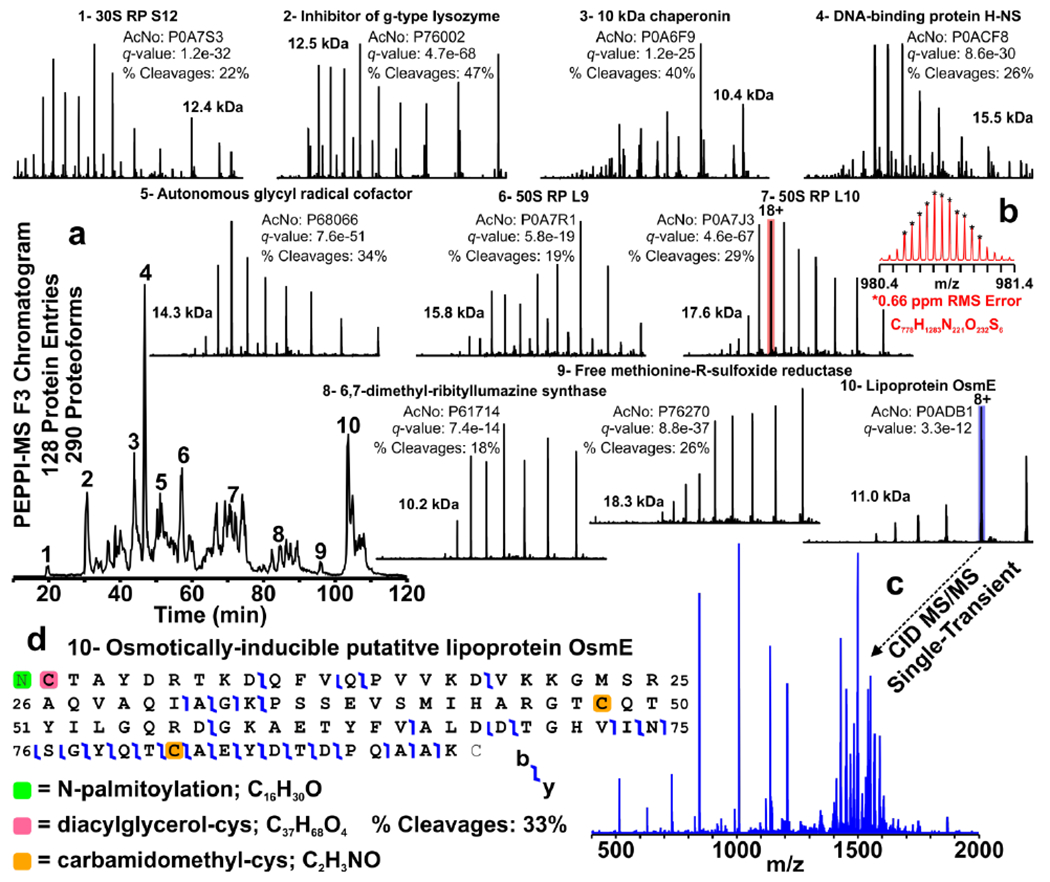
(a) Base peak chromatogram of E. coli whole cell lysate PEPPI fraction 3. Spectra (600-1600 m/z) depicting charge-state distributions of ten proteins identified by TDPortal (and manually confirmed) are shown as insets. The identity of each protein is indicated along with UniProt accession number (AcNo), q-values (from TDPortal search), molecular weight, and sequence coverage (% Cleavages). (b) m/z-scale expanded segment of the broadband mass spectrum (red) depicting the isotopic distribution of the [M+18H]18+ charge state of 50S ribosomal protein L10. These peaks (*) matched the theoretical isotope distribution simulated from the known elemental composition of this proteoform with an RMS error of 0.66 ppm. (c) Single-transient CID MS/MS spectrum of the [M+8H]8+ charge state (blue) of membrane protein OsmE along with (d) sequence coverage map. A total of 290 proteoforms derived from 128 unique protein entries were identified at 1% FDR from this single injection.
Furthermore, we compared the performance of PEPPI-MS to a standard GELFrEE prefractionation strategy. With a 10% Tris-acetate GELFrEE cartridge, proteins of MW ≤50 kDa generally elute in fractions 1 through 8 to 10. We analyzed 9 fractions as this provides the fairest comparison to the PEPPI-MS data in terms of the total number of LC-MS/MS experiments, and the MW range (Figure S5). As with PEPPI-MS, 100 μg aliquots of reduced and alkylated whole cell lysates were prefractionated by GELFrEE (Figure S3c) and analyzed by online reversed-phase LC-FT-ICR MS/MS in duplicate at 21 T (18 total LC-MS/MS experiments). The TDPortal search of the data resulted in identification of 350 proteins expressed as 839 proteoforms at 1% FDR (Table S3). A replicate GELFrEE separation resulted in identification of 365 and 876 proteins and proteoforms, respectively (Table S4).
Molecular weight distributions of proteoforms identified in each of 9 fractions for PEPPI-MS and GELFrEE are given as heat maps in Figure S5. PEPPI-MS proteoforms ranged from 2.2-51.4 kDa; 58 proteoforms were >30 kDa. GELFrEE proteoforms ranged from 1.5-46.0 kDa, and 66 of these were >30 kDa. Total proteoform IDs per fraction (with redundancies) are given in Figures 4c and 4d as insets. GELFrEE fractions one and two yielded very few proteoform IDs compared to PEPPI-MS, which was also observed in the technical replicate GELFrEE fractionation (just three proteoforms identified in the second fraction). However, more high-MW proteoforms were identified in the later-eluting GELFrEE fractions. Additionally, more proteoforms were identified in a single injection of GELFrEE (fraction 5) than any PEPPI-MS fraction.
Figure 4. Intersection Degree and UpSet Plots for PEPPI-MS and GELFrEE Prefractionation.

(a) Intersection degree plot for proteoforms identified at 1% FDR from E. coli MG1655 whole cell lysate prefractionated by PEPPI-MS and (b) GELFrEE. Intersection degree indicates the number of fractions a proteoform was identified in as indicated by analysis of the results from TDPortal. (c) UpSet plot for proteoforms identified at 1% FDR from E. coli MG1655 whole cell lysate prefractionated by PEPPI-MS and (d) GELFrEE. All included sets (fractions) and their respective sizes (with redundancies) are shown as an inset in the upper right corner of the panel. The colored circles at the bottom indicate the range of sets included in an intersection, and the intersection sizes (unique proteoform IDs in intersection) are shown by the bars immediately above.
In order to gauge differences in the resolution of PEPPI-MS and GELFrEE prefractionation of whole cell lysates, we evaluated the extent to which proteoforms were observed across multiple fractions. Intersection degree plots for PEPPI-MS and GELFrEE are shown in Figures 4a and 4b, respectively. These plots indicate the number of fractions in which a proteoform was observed. Roughly two-thirds of all proteoforms recovered and identified from PEPPI-MS were observed in just one fraction and 91% were observed in just one or two fractions. The proportion of proteoforms identified in just one or two GELFrEE fractions was 82%. These figures are further broken out in the UpSet plots shown in Figures 4c and 4d. These depict the number of unique proteoforms identified in each individual fraction (or set) as well as all observed combinations of fractions (or intersections of sets). As expected, most proteoform overlap occurs among adjacent fractions containing the most proteoforms with very few proteoforms observed in combinations of four or more fractions for both prefractionation strategies.
Our results demonstrate that samples prefractionated by PEPP-MS are amenable to downstream top-down proteomic analysis by online reversed-phase LC-MS/MS. When equivalent quantities of whole cell lysates were subjected to the two prefractionation strategies explored, PEPPI-MS performed comparably to GELFrEE with regard to total proteoform identifications. As expected, in both cases the number of proteoforms identified decreased as a function of MW. This is largely due to lower observed S:N ratios inherent to mass spectrometric analysis of large proteins electrosprayed under denaturing conditions, as well as the need for improved separation of larger proteins by reversed-phase LC (Figure S4).7,27 Additionally, all MS/MS spectra were taken as a single-scan. Sampling rate was prioritized over spectral quality (higher quality achieved via additional signal averaging requiring additional time per scan) to the detriment of higher-MW proteoform identifications. Despite this, the MW range of recovered proteoforms suits the capabilities of most commercially available instrumentation for resolved proteoform analysis. Note that while GELFrEE exhibited poor recovery of proteins in low-MW fractions, additional studies are required to determine if this is the case for other samples or cartridges containing different percentages of acrylamide. Previous studies involving human whole cell lysates prefractionated by 10 % Tris-acetate GELFrEE and analyzed by LC-MS/MS at 21T did not suffer this limitation, but utilized over four-times more sample.51 The manufacturer’s protocol for 10% Tris-acetate cartridges recommends loading up to 500 μg of protein per lane. These earlier observations taken with the results presented here suggest PEPPI-MS may be more suitable for prefractionation of small amounts of protein (≤100 μg) compared to GELFrEE.
A significant drawback of any prefractionation approach is that some proteoforms can (and will) be split among more than one fraction. This complicates label-free quantitation strategies because changes in individual proteoform abundances are more difficult to detect as signal is diluted across LC-MS/MS experiments. Furthermore, the number of individual experiments that must be performed is increased. Combined, these difficulties stipulate that reproducible sample handling processes be employed across multiple levels of replication, and instrument performance/sensitivity must be maintained for all experiments to ensure that observed changes in proteoform abundance are biologically affected.24,52 A promising aspect of the PEPPI-MS workflow for top-down proteomics is the limited number of proteoforms observed across multiple fractions. We anticipate that the established workflow can be further optimized to reduce overlap and improve quantitative top-down proteomic analyses.
Application to other mass spectrometry methods
The release of intact proteins from gel matrices lends itself to a variety of MS applications. For example, the combination of the PEPPI-MS workflow and highly sensitive MALDI MS is an attractive approach when the goal is to rapidly identify protein bands in the gel. Figure 5 shows an example of protein identification (human serum albumin, 66.4 kDa) by ISD fragmentation following PEPPI-MS. The PEPPI-MS workflow enabled us to excise the proteins of interest from a band-dense area, which was effective in reducing contamination from other proteins (Figures 5a and 5b). In particular, selective extraction from a 1 mm-wide band was possible when using a dried gel. If the protein recovered from a single lane was insufficient for subsequent analysis, subsequent extraction of identical bands from multiple lanes resulted in increased recovery (Figure 5c).
Figure 5. Selective protein recovery from crude biological samples.

(a) MALDI-TOF MS analysis of a gel-recovered serum protein. After gel separation of 14 major human serum proteins, the selected band (red arrow) was excised, and the extracted protein was subjected to MALDI-TOF MS analysis, (b) MALDI-ISD of the gel-recovered protein. The N-terminal amino acid sequence of the recovered protein (human serum albumin) was determined using product ions generated by MALDI-ISD. The ion peak at m/z 3689 (asterisk) was used as a “virtual precursor ion” in the MASCOT database search. Inset: MASCOT database search results, (c) Selective enrichment of target proteins from crude biological samples. The crude protein extract from Drosophila compound eyes was separated by SDS-PAGE and the target protein bands (arrows) were excised. The recovered proteins were separated again by SDS-PAGE and stained with CBB.
Native-PAGE protocols (blue-native PAGE, clear-native PAGE, and/or non-denaturing PAGE) that are performed without strong ionic detergents allow separated proteins to retain their native structures, which is desirable when purifying and analyzing non-covalent complexes53–56. Passive extraction of separated protein complexes from clear native-PAGE gels will allow for structural analysis by native MS. CBB-based PEPPI-MS protocols require CBB removal after protein recovery, prior to further MS analysis. Typically, organic solvents are employed to remove CBB. However, these would alter the native structure of the recovered proteins. Low concentrations of octyl-β-D-glucoside (‘octylglucoside’) have been reported to have no discernible influence on ESI MS of intact proteins.57 Thus, an appropriate concentration of octylglucoside for the recovery of proteins separated by native-PAGE could be expected to enable recovery with low impact on the native structure of the recovered proteins. In the PEPPI-MS workflow, passive extraction with 0.1% (w/v) octylglucoside was effective for rapid protein recovery following native PAGE separation (Supplementary Results and Figure S6), and the native structure and enzymatic activity of the recovered proteins were maintained (Supplementary Results and Figure S7).
To demonstrate that protein complexes were preserved after extraction with octylglucoside, we performed native MS on recovered human Hb. After buffer exchange of the recovered Hb sample with 20 mM ammonium acetate (pH 6.8) by 30-kDa ultrafiltration (Figure S8a), we performed native MS analysis on-line with CE (Figure S8b). Although some adduction of the acrylamide monomer was observed in the recovered Hb, the 64 kDa Hb tetramer was detected by CE-MS in neutral pH buffer (Figures S8c and S8d). As demonstrated in Figure S6e, two-dimensional native PAGE (native IEF + native PAGE) allows high-resolution separation of target proteins. We further evaluated the effectiveness of PEPPI-MS with octylglucoside extraction following two-dimensional PAGE separation as a method for purification of protein complexes from crude biological samples for native MS analysis (Figure 6a). Hb tetramer derived from lysis of human RBCs was selected as a test case. Two-dimensional separation was effective for selective Hb recovery (Figure 6b), and no additional separation was necessary. After simple gel filtration, the recovered Hb tetramer was detected in native ESI MS analysis. Although we show a simple example targeting an abundant protein complex, our study demonstrated that an octylglucoside-based PEPPI-MS workflow can successfully combine native PAGE with native MS analysis. In addition to octylglucoside, other nonionic saccharide surfactants that are compatible with MS, such as n-dodecyl glucoside and n-hexyl glucoside, can be effective in the extraction workflow. The advantage of PEPPI-MS is that target protein complexes can be selectively recovered by a simple process, and our proposed workflow enables acquisition of high-quality native MS information on target proteins with reduced contamination, even from crude samples.
Figure 6. MS-based characterization of recovered human hemoglobin (Hb) from a native PAGE gel.

(a) Scheme for the recovery of Hb from human red blood cell (RBC) samples by two-dimensional native PAGE and PEPPI. In the 1st separation, RBC lysates were separated by native IEF (pl 3–10) and the gel band of Hb (red arrow) was subjected to PEPPI using 0.1% octyl glucoside. A portion of the IEF gel was stained with CBB. In the second separation, the recovered Hb was further separated by native PAGE and again recovered by PEPPI. The recovered sample was purified on a gel filtration spin column and subjected to native MS analysis by direct infusion ESI. (b) A representative SDS-PAGE gel image of Hb recovered with PEPPI (red arrow). The Hb sample purified by 2D native PAGE was separated with a 4–12% NuPAGE gel and visualized with BioRad’s bio-safe CBB. (c) Native MS spectra of the recovered Hb.
Conclusions
We have developed a novel method for rapid and efficient extraction of intact proteins and protein complexes from polyacrylamide gels to expand the “toolbox” of prefractionation strategies for intact protein analysis by MS. Effective recovery of intact proteins following high-resolution SDS-PAGE separation will be particularly useful for targeted, as well as large-scale top-down proteomics. For complex samples, offline fractionation is a hallmark of top-down proteomics as it enables observation of less-abundant proteoforms and reduces the complexity of the sample introduced to the mass spectrometer at any given time, thereby improving many facets of the analysis (e.g. observed S:N, required resolving power, co-isolation of precursors prior to MS/MS, etc.). Several approaches have been developed (e.g. isoelectric focusing58, GELFrEE59, high-pH/low-pH60, and sSEC27) and applied to top-down proteomics, but these often require specialized equipment to implement (e.g. GELFrEE 8100 fractionation station and cartridge kits, or dedicated HPLC pumps and columns). The PEPPI-MS workflow is a powerful addition to these approaches. In addition to the rapid, high-resolution separation performance, the ability to tailor parameters of the PAGE step of PEPPI-MS (e.g. gel percentage and running buffer) to optimize separation within the MW range of interest offers significant advantages. In cases where the desired proteoforms are present in low abundances, samples can be combined across additional gel lanes or entire gels to enable purification of the desired amount of protein. The widespread availability and relatively low cost of traditional SDS-PAGE equipment can also empower many laboratories to prepare samples for intact analysis by MS. Furthermore, PEPPI-MS using octyl glucoside instead of CBB or SDS was effective in recovering Hb tetramer separated by native PAGE. While here we demonstrated an effective workflow with an easily-detectable, chromophore-containing complex, future studies are needed to develop a workflow for more common, non-colored protein samples separated by native PAGE without staining.
Supplementary Material
Acknowledgments
This study was supported by JSPS KAKENHI Grants (16K08937, 18H04559, and 19K05526 to N.T.). A portion of this work was performed at the Ion Cyclotron Resonance User Facility (available free-of-charge to all qualified users) at the National High Magnetic Field Laboratory, which is supported by National Science Foundation Division of Materials Research and Division of Chemistry through Cooperative Agreement No. DMR-1644779* and the State of Florida* (* L.C.A. and D.S.B. support). The work was also supported by grants from the Biotechnology and Biological Sciences Research Council (BB/M025756/1 and BB/R005311/1 to R.J.B.) and the US National Institutes of Health (R01GM104610 and R01GM103479 to R.R.O.L. and J.A.L.). We gratefully acknowledge Joseph B. Greer of the National Resource for Translational and Developmental Proteomics (NRTDP) for facilitating data analysis via TDPortal. TDPortal is a publically available resource provided by the NRTDP based at Northwestern University, which is supported by a grant from the National Institute of General Medical Sciences, National Institutes of Health P41 GM108569 (Neil L. Kelleher, P.I.) with additional support provided by the Sherman Fairchild Foundation.
Footnotes
Supporting Information
The following supporting information is available free of charge at ACS website http://pubs.acs.org.
• Supplementary Results; Supplementary Materials and Methods; Supplementary Protocol (PEPPI-MS for top-down proteomics); Comparison of two different aqueous CBB methods (Figure S1); Quantitative evaluation of protein recovery by SILAC (Figure S2); Representative PAGE images of the fractionated E. coli proteome (Figure S3); 21T FT-ICR MS total ion and base peak chromatograms (Figure S4); Heat maps depicting molecular weight distributions of E. coli proteoforms (Figure S5); Protein recovery after native PAGE separation (Figure S6); Analysis of gel-extracted luciferase activity (Figure S7); Native MS analysis of gel-extracted hemoglobin (Figure S8); (PDF)
• Proteins and proteoforms identified by TDPortal analysis of 21 T FT-ICR LC-MS/MS data (Table S1–4) (XLSX)
Conflicts of interest
The authors declare no competing financial interest.
References
- 1.Laemmli UK, Cleavage of structural proteins during the assembly of the head of bacteriophage T4. Nature 1970, 227, (5259), 680–5. [DOI] [PubMed] [Google Scholar]
- 2.Rosenfeld J; Capdevielle J; Guillemot JC; Ferrara P, In-gel digestion of proteins for internal sequence analysis after one- or two-dimensional gel electrophoresis. Anal Biochem 1992, 203, (1), 173–9. [DOI] [PubMed] [Google Scholar]
- 3.Heilman U; Wernstedt C; Gonez J; Heldin CH, Improvement of an “In-Gel” digestion procedure for the micropreparation of internal protein fragments for amino acid sequencing. Anal Biochem 1995, 224, (1), 451–5. [DOI] [PubMed] [Google Scholar]
- 4.Borchers C; Peter JF; Hall MC; Kunkel TA; Tomer KB, Identification of in-gel digested proteins by complementary peptide mass fingerprinting and tandem mass spectrometry data obtained on an electrospray ionization quadrupole time-of-flight mass spectrometer. Anal Chem 2000, 72, (6), 1163–8. [DOI] [PubMed] [Google Scholar]
- 5.Gygi SP; Corthals GL; Zhang Y; Rochon Y; Aebersold R, Evaluation of two-dimensional gel electrophoresis-based proteome analysis technology. Proc Natl Acad Sci U S A 2000, 97, (17), 9390–5. [DOI] [PMC free article] [PubMed] [Google Scholar]
- 6.Shevchenko A; Tomas H; Havlis J; Olsen JV; Mann M, In-gel digestion for mass spectrometric characterization of proteins and proteomes. Nat Protoc 2006, 1, (6), 2856–60. [DOI] [PubMed] [Google Scholar]
- 7.Compton PD; Zamdborg L; Thomas PM; Kelleher NL, On the scalability and requirements of whole protein mass spectrometry. Anal Chem 2011, 83, (17), 6868–74. [DOI] [PMC free article] [PubMed] [Google Scholar]
- 8.Tolmachev AV; Robinson EW; Wu S; Pasa-Tolic L; Smith RD, FT-ICR MS optimization for the analysis of intact proteins. Int J Mass Spectrom 2009, 281, (1-3), 32–38. [DOI] [PMC free article] [PubMed] [Google Scholar]
- 9.Ahlf DR; Compton PD; Tran JC; Early BP; Thomas PM; Kelleher NL, Evaluation of the compact high-field orbitrap for top-down proteomics of human cells. J Proteome Res 2012, 11, (8), 4308–14. [DOI] [PMC free article] [PubMed] [Google Scholar]
- 10.Hu Q; Noll RJ; Li H; Makarov A; Hardman M; Graham Cooks R, The Orbitrap: a new mass spectrometer. J Mass Spectrom 2005, 40, (4), 430–43. [DOI] [PubMed] [Google Scholar]
- 11.Armirotti A; Benatti U; Damonte G, Top-down proteomics with a quadrupole time-of-flight mass spectrometer and collision-induced dissociation. Rapid Commun Mass Spectrom 2009, 23, (5), 661–6. [DOI] [PubMed] [Google Scholar]
- 12.Second TP; Blethrow JD; Schwartz JC; Merrihew GE; MacCoss MJ; Swaney DL; Russell JD; Coon JJ; Zabrouskov V, Dual-pressure linear ion trap mass spectrometer improving the analysis of complex protein mixtures. Anal Chem 2009, 81, (18), 7757–65. [DOI] [PMC free article] [PubMed] [Google Scholar]
- 13.Senko MW; Remes PM; Canterbury JD; Mathur R; Song Q; Eliuk SM; Mullen C; Earley L ; Hardman M; Blethrow JD; Bui H; Specht A; Lange O; Denisov E; Makarov A; Horning S; Zabrouskov V, Novel parallelized quadrupole/linear ion trap/Orbitrap tribrid mass spectrometer improving proteome coverage and peptide identification rates. Anal Chem 2013, 85, (24), 11710–4. [DOI] [PubMed] [Google Scholar]
- 14.Hendrickson CL; Quinn JP; Kaiser NK; Smith DF; Blakney GT; Chen T; Marshall AG; Weisbrod CR; Beu SC, 21 Tesla Fourier Transform Ion Cyclotron Resonance Mass Spectrometer: A National Resource for Ultrahigh Resolution Mass Analysis. J Am Soc Mass Spectrom 2015, 26, (9), 1626–32. [DOI] [PubMed] [Google Scholar]
- 15.Riley NM; Mullen C; Weisbrod CR; Sharma S; Senko MW; Zabrouskov V; Westphall MS; Syka JE; Coon JJ, Enhanced Dissociation of Intact Proteins with High Capacity Electron Transfer Dissociation. J Am Soc Mass Spectrom 2016, 27, (3), 520–31. [DOI] [PMC free article] [PubMed] [Google Scholar]
- 16.Earley L; Anderson LC; Bai DL; Mullen C; Syka JE; English AM; Dunyach JJ; Stafford GC Jr.; Shabanowitz J; Hunt DF; Compton PD, Front-end electron transfer dissociation: a new ionization source. Anal Chem 2013, 85, (17), 8385–90. [DOI] [PMC free article] [PubMed] [Google Scholar]
- 17.Syka JE; Coon JJ; Schroeder MJ; Shabanowitz J; Hunt DF, Peptide and protein sequence analysis by electron transfer dissociation mass spectrometry. Proc Natl Acad Sci U S A 2004, 101, (26), 9528–33. [DOI] [PMC free article] [PubMed] [Google Scholar]
- 18.Shaw JB; Li W; Holden DD; Zhang Y; Griep-Raming J; Fellers RT; Early BP; Thomas PM ; Kelleher NL; Brodbelt JS, Complete protein characterization using top-down mass spectrometry and ultraviolet photodissociation. J Am Chem Soc 2013, 135, (34), 12646–51. [DOI] [PMC free article] [PubMed] [Google Scholar]
- 19.Anderson LC; English AM; Wang W; Bai DL; Shabanowitz J; Hunt DF, Protein derivatization and sequential ion/ion reactions to enhance sequence coverage produced by electron transfer dissociation mass spectrometry. Int J Mass Spectrom 2015, 377, 617–624. [DOI] [PMC free article] [PubMed] [Google Scholar]
- 20.Riley NM; Westphall MS; Coon JJ, Activated Ion-Electron Transfer Dissociation Enables Comprehensive Top-Down Protein Fragmentation. J Proteome Res 2017, 16, (7), 2653–2659. [DOI] [PMC free article] [PubMed] [Google Scholar]
- 21.Shaw JB; Malhan N; Vasil’ev YV; Lopez NI; Makarov A; Beckman JS; Voinov VG, Sequencing Grade Tandem Mass Spectrometry for Top-Down Proteomics Using Hybrid Electron Capture Dissociation Methods in a Benchtop Orbitrap Mass Spectrometer. Anal Chem 2018, 90, (18), 10819–10827. [DOI] [PMC free article] [PubMed] [Google Scholar]
- 22.Toby TK; Fornelli L; Kelleher NL, Progress in Top-Down Proteomics and the Analysis of Proteoforms. Annu Rev Anal Chem (Palo Alto Calif) 2016, 9, (1), 499–519. [DOI] [PMC free article] [PubMed] [Google Scholar]
- 23.Chen B; Brown KA; Lin Z; Ge Y, Top-Down Proteomics: Ready for Prime Time? Anal Chem 2018, 90, (1), 110–127. [DOI] [PMC free article] [PubMed] [Google Scholar]
- 24.Schaffer LV; Millikin RJ; Miller RM; Anderson LC; Fellers RT; Ge Y; Kelleher NL; LeDuc RD; Liu X; Payne SH; Sun L; Thomas PM; Tucholski T; Wang Z; Wu S; Wu Z; Yu D; Shortreed MR; Smith LM, Identification and Quantification of Proteoforms by Mass Spectrometry. Proteomics 2019, 19, (10), el800361. [DOI] [PMC free article] [PubMed] [Google Scholar]
- 25.Tran JC; Doucette AA, Gel-eluted liquid fraction entrapment electrophoresis: an electrophoretic method for broad molecular weight range proteome separation. Anal Chem 2008, 80, (5), 1568–73. [DOI] [PubMed] [Google Scholar]
- 26.Tran JC; Doucette AA, Multiplexed size separation of intact proteins in solution phase for mass spectrometry. Anal Chem 2009, 81, (15), 6201–9. [DOI] [PubMed] [Google Scholar]
- 27.Cai W; Tucholski T; Chen B; Alpert AJ; Mcllwain S; Kohmoto T; Jin S; Ge Y, Top-Down Proteomics of Large Proteins up to 223 kDa Enabled by Serial Size Exclusion Chromatography Strategy. Anal Chem 2017, 89, (10), 5467–5475. [DOI] [PMC free article] [PubMed] [Google Scholar]
- 28.Vanfleteren JR, Sequential sodium dodecyl sulfate-polyacrylamide gel electrophoresis and reversed-phase chromatography of unfolded proteins. Anal Biochem 1989, 178, (2), 385–90. [DOI] [PubMed] [Google Scholar]
- 29.Jenö P; Horst M, Electroelution of proteins from polyacrylamide gels. In The Protein Protocols Handbook, Springer: 1996; pp 207–214. [Google Scholar]
- 30.Cohen SL; Chait BT, Mass spectrometry of whole proteins eluted from sodium dodecyl sulfate-polyacrylamide gel electrophoresis gels. Anal Biochem 1997, 247, (2), 257–67. [DOI] [PubMed] [Google Scholar]
- 31.Loo JA; Brown J; Critchley G; Mitchell C; Andrews PC; Ogorzalek Loo RR, High sensitivity mass spectrometric methods for obtaining intact molecular weights from gel-separated proteins. Electrophoresis 1999, 20, (4-5), 743–8. [DOI] [PubMed] [Google Scholar]
- 32.Galvani M; Bordini E; Piubelli C; Hamdan M, Effect of experimental conditions on the analysis of sodium dodecyl sulphate polyacrylamide gel electrophoresis separated proteins by matrix-assisted laser desorption/ionisation mass spectrometry. Rapid Commun Mass Spectrom 2000, 14, (1), 18–25. [DOI] [PubMed] [Google Scholar]
- 33.Asquith T; Takigiku R; Purdon M; Gauggel D; Keough T; Lacey M, Accurate Determination of Molecular Mass for Proteins Isolated from Polyacrylamide Gels. In Techniques in Protein Chemistry IV, Elsevier: 1993; pp 99–106. [Google Scholar]
- 34.Galvani M; Hamdan M; Righetti PG, Two-dimensional gel electrophoresis/matrix-assisted laser desorption/ionisation mass spectrometry of a milk powder. Rapid Commun Mass Spectrom 2000, 14, (20), 1889–97. [DOI] [PubMed] [Google Scholar]
- 35.Galvani M; Hamdan M, Electroelution and passive elution of gamma-globulins from sodium dodecyl sulphate polyacrylamide gel electrophoresis gels for matrix-assisted laser desorption/ionisation time-of-flight mass spectrometry. Rapid Commun Mass Spectrom 2000, 14, (8), 721–3. [DOI] [PubMed] [Google Scholar]
- 36.Jorgensen CS; Jagd M; Sorensen BK; McGuire J; Barkholt V; Hojrup P; Houen G, Efficacy and compatibility with mass spectrometry of methods for elution of proteins from sodium dodecyl sulfate-polyacrylamide gels and polyvinyldifluoride membranes. Anal Biochem 2004, 330, (1), 87–97. [DOI] [PubMed] [Google Scholar]
- 37.Seelert H; Krause F, Preparative isolation of protein complexes and other bioparticles by elution from polyacrylamide gels. Electrophoresis 2008, 29, (12), 2617–2636. [DOI] [PubMed] [Google Scholar]
- 38.Scheer JM; Ryan CA, A method for the quantitative recovery of proteins from polyacrylamide gels. Analytical biochemistry 2001, 298, (1), 130–132. [DOI] [PubMed] [Google Scholar]
- 39.Georgiou CD; Grintzalis K; Zervoudakis G; Papapostolou I, Mechanism of Coomassie brilliant blue G-250 binding to proteins: a hydrophobic assay for nanogram quantities of proteins. Anal BioanalChem 2008, 391, (1), 391–403. [DOI] [PubMed] [Google Scholar]
- 40.Lawrence AM; Besir HU, Staining of proteins in gels with Coomassie G-250 without organic solvent and acetic acid. J Vis Exp 2009, (30), 1350. [DOI] [PMC free article] [PubMed] [Google Scholar]
- 41.Takemori N; Komori N; Thompson JN Jr.; Yamamoto ΜT; Matsumoto H, Novel eye-specific calmodulin methylation characterized by protein mapping in Drosophila melanogaster. Proteomics 2007, 7, (15), 2651–8. [DOI] [PubMed] [Google Scholar]
- 42.Kaiser NK; Savory JJ; Hendrickson CL, Controlled ion ejection from an external trap for extended m/z range in FT-ICR mass spectrometry. Journal of The American Society for Mass Spectrometry 2014, 25, (6), 943–949. [DOI] [PubMed] [Google Scholar]
- 43.Afgan E; Baker D; Batut B; Van Den Beek M; Bouvier D; Čech M; Chilton J; Clements D; Coraor N; Grüning BA, The Galaxy platform for accessible, reproducible and collaborative biomedical analyses: 2018 update. Nucleic acids research 2018, 46, (W1), W537–W544. [DOI] [PMC free article] [PubMed] [Google Scholar]
- 44.Toby TK; Fornelli L; Srzentić K; DeHart CJ; Levitsky J; Friedewald J; Kelleher NL, A comprehensive pipeline for translational top-down proteomics from a single blood draw. Nature protocols 2019, 14, (1), 119–152. [DOI] [PMC free article] [PubMed] [Google Scholar]
- 45.Trachsel C; Panse C; Kockmann T; Wolski WE; Grossmann J; Schlapbach R, rawDiag: An R Package Supporting Rational LC–MS Method Optimization for Bottom-up Proteomics. Journal of proteome research 2018, 17, (8), 2908–2914. [DOI] [PubMed] [Google Scholar]
- 46.Wickham H ggplot2: Elegant Graphics for Data Analysis. Ggplot2: Elegant Graphics for Data Analysis: 1–212; doi 10.1007/978-0-387-98141-3:2009. [DOI] [Google Scholar]
- 47.Conway JR; Lex A; Gehlenborg N, UpSetR: an R package for the visualization of intersecting sets and their properties. Bioinformatics 2017, 33, (18), 2938–2940. [DOI] [PMC free article] [PubMed] [Google Scholar]
- 48.Takemori N; Takemori A; Wongkongkathep P; Nshanian M; Loo RRO; Lermyte F; Loo JA, Top-down/Bottom-up Mass Spectrometry Workflow Using Dissolvable Polyacrylamide Gels. Anal Chem 2017, 89, (16), 8244–8250. [DOI] [PMC free article] [PubMed] [Google Scholar]
- 49.Jin Y; Manabe T, High-efficiency protein extraction from polyacrylamide gels for molecular mass measurement by matrix-assisted laser desorption/ionization-time of flight-mass spectrometry. Electrophoresis 2005, 26, (6), 1019–28. [DOI] [PubMed] [Google Scholar]
- 50.Wessel D; Flugge UI, A method for the quantitative recovery of protein in dilute solution in the presence of detergents and lipids. Anal Biochem 1984, 138, (1), 141–3. [DOI] [PubMed] [Google Scholar]
- 51.Anderson LC; DeHart CJ; Kaiser NK; Fellers RT; Smith DF; Greer JB; LeDuc RD; Blakney GT; Thomas PM; Kelleher NL; Hendrickson CL, Identification and Characterization of Human Proteoforms by Top-Down LC-21 Tesla FT-ICR Mass Spectrometry. J Proteome Res 2017, 16, (2), 1087–1096. [DOI] [PMC free article] [PubMed] [Google Scholar]
- 52.Ntai I; Toby TK; LeDuc RD; Kelleher NL, A method for label-free, differential top-down proteomics. In Quantitative Proteomics by Mass Spectrometry, Springer: 2016; pp 121–133. [DOI] [PMC free article] [PubMed] [Google Scholar]
- 53.Schagger H; von Jagow G, Blue native electrophoresis for isolation of membrane protein complexes in enzymatically active form. Anal Biochem 1991, 199, (2), 223–31. [DOI] [PubMed] [Google Scholar]
- 54.Schagger H; Cramer WA; von Jagow G, Analysis of molecular masses and oligomeric states of protein complexes by blue native electrophoresis and isolation of membrane protein complexes by two-dimensional native electrophoresis. Anal Biochem 1994, 217, (2), 220–30. [DOI] [PubMed] [Google Scholar]
- 55.Camm EL; Green BR, Fractionation of Thylakoid Membranes with the Nonionic Detergent Octyl-beta-d-glucopyranoside: RESOLUTION OF CHLOROPHYLL-PROTEIN COMPLEX II INTO TWO CHLOROPHYLL-PROTEIN COMPLEXES. Plant Physiol 1980, 66, (3), 428–32. [DOI] [PMC free article] [PubMed] [Google Scholar]
- 56.Wittig I; Schagger H, Features and applications of blue-native and clear-native electrophoresis. Proteomics 2008, 8, (19), 3974–90. [DOI] [PubMed] [Google Scholar]
- 57.Loo RR; Dales N; Andrews PC, Surfactant effects on protein structure examined by electrospray ionization mass spectrometry. Protein Sci 1994, 3, (11), 1975–83. [DOI] [PMC free article] [PubMed] [Google Scholar]
- 58.Zhang J; Roth MJ; Chang AN; Plymire DA; Corbett JR; Greenberg BM; Patrie SM, Top-down mass spectrometry on tissue extracts and biofluids with isoelectric focusing and superficially porous silica liquid chromatography. Analytical chemistry 2013, 85, (21), 10377–10384. [DOI] [PubMed] [Google Scholar]
- 59.Tran JC; Zamdborg L; Ahlf DR; Lee JE; Catherman AD; Durbin KR; Tipton JD; Vellaichamy A; Kellie JF; Li M, Mapping intact protein isoforms in discovery mode using top-down proteomics. Nature 2011, 480, (7376), 254–258. [DOI] [PMC free article] [PubMed] [Google Scholar]
- 60.Wang Z; Ma H; Smith K; Wu S, Two-dimensional separation using high-pH and low-pH reversed phase liquid chromatography for top-down proteomics. International journal of mass spectrometry 2018, 427, 43–51. [DOI] [PMC free article] [PubMed] [Google Scholar]
Associated Data
This section collects any data citations, data availability statements, or supplementary materials included in this article.