

Abstract
Background
Universal health care systems seek to ensure access to care on the basis of need, rather than income, but there are concerns about preferential access to cardiovascular and specialist care for high income patients. In this study, I used population-based, individual-level health, income and utilization data to determine whether whether there is evidence for differential access to physician care in relation to household income.
Methods
I studied data for 2170 Ontario respondents to the 1995 National Population Health Survey (aged 40 to 79 years) who had approved linkage of their survey responses to the administrative databases of the Ontario Health Insurance Plan and for whom income data were available. I used linear and generalized linear regression to model the mean per capita expenditures on physician care and the probability of referral to a specialist in relation to income and self-reported health status.
Results
Residents of higher income households incurred lower per capita expenditures for physicians' services than those in lower income households; for example, the mean per capita expenditure in the upper middle income group was $220 less (95% confidence interval –$87 to –$334) than the mean per capita expenditure in the lowest income group. Expenditures were significantly related to self-reported health status; for example, the mean per capita expenditure among those reporting fair health status was $590 higher (95% confidence interval $465 to $737) than among those reporting excellent health. After adjustment for health status, there was no association between income and the expenditures on all physician services, out-of-hospital services or specialist care.
Interpretation
Utilization of physicians' services in Ontario is based on need, rather than income.
Universal health care systems seek to ensure that patients have access to care on the basis of need, rather than income. Canada's medicare system covers all medically necessary services provided by hospitals and physicians, without user fees. Therefore, low income should not be a barrier to accessing physicians' services, but research in Ontario has raised concerns about preferential access to cardiovascular and specialist care. Dunlop and colleagues1 analyzed patients' self-reports of physician visits, as collected in 1994/95 by the National Population Health Survey (NPHS). They concluded that “Canadians with lower incomes and fewer years of schooling visit specialists at a lower rate than those with moderate or high incomes and higher levels of education.” Alter and associates2 assessed the effects of neighbourhood income on access to invasive cardiac procedures 1 year after acute myocardial infarction. They reported that patients in the highest quintile of neighbourhood income had 23% higher rates of coronary angiography and 45% shorter waiting times than those in the lowest quintile. They concluded that despite universal health care, socioeconomic status had pronounced effects on access to specialized cardiac services.
The available data on access to health care according to income in Canada can be challenged on the grounds that the study designs have not controlled adequately for potential differences in health status among socioeconomic subgroups, did not use individual-level income data or relied on self-reporting of utilization of services. The objective of this study was to use individual-level data collected by the NPHS, linked to administrative data from the Ontario Health Insurance Plan (OHIP), to explore whether there is evidence for differential access to physician care in relation to household income.
Methods
The NPHS was designed to collect information about the health of Canadians every 2 years.3 The target population for the survey consists of household residents in all provinces. In 1994/95 the NPHS used a 2-stage stratified sampling design and Statistics Canada's Labour Force Survey sampling frame to identify a representative sample of 19 600 households across Canada; the overall response rate was 88%. In each household one person was randomly selected for an in-depth interview, which included a question on the self-perception of health (to be rated as poor, fair, good, very good or excellent). Demographic and socioeconomic information included age, sex, education, ethnic background and household income. Residences were classified as rural or urban. Statistics Canada derived an index of income adequacy on the basis of household income and household size. In 1994 dollars, the 4 categories of the index were as follows: lowest income, less than $10 000 for 1 to 4 people; lower middle income, $10 000 to $22 499 for 1 or 2 people; upper middle income, $22 500 to $59 999 for 1 or 2 people; and highest income, $60 000 or more for 1 or 2 people. For households with more people than indicated in these categories, the income ranges were scaled accordingly.
The OHIP providers' database contains details of each transaction, including a diagnosis code (based on the International Classification of Diseases, 9th revision), the physician's specialty and the fee for the service. The Ontario Ministry of Health has linked the NPHS file to the OHIP providers' database, using the respondent's health insurance number as the identifier for the linkage. The Ministry generated a data file containing a record of each service provided by physicians to NPHS respondents in the year before their interviews. I obtained a copy of this data file, in which the health insurance numbers had been scrambled to protect the privacy of individual respondents.
For each NPHS respondent, utilization of physicians' services was determined by the fee from the claims submitted to OHIP by physicians in the year before the interview. The expenditure data for survey respondents were highly skewed. Eight percent of respondents did not visit a physician in the year before the interview, the median expenditure was $293, the mean expenditure was $580, and 2.5% of respondents incurred expenses in excess of $3000; the largest annual expense for an individual was $20 000. All expenditures greater than $3000 were trimmed to exactly $3000, so as to limit the effect of outlying data on the estimates of the means. This manipulation of the data did not affect the substantive conclusions.
Multiple linear regression modelling was used to analyze expenditures, and generalized linear regression modelling was used to investigate factors associated with the utilization of specialists' services. To compare differences in utilization, the identity link was used in the generalized linear regression models with a binomial error term.4 All regression models were adjusted for age and sex, and an age–sex interaction term was included if the interaction term was statistically significant. The survey weight for each respondent, as provided by Statistics Canada, was used in all calculations. In skewed data, such as these, regression analysis provides unbiased estimates of the coefficients, but the residuals are not normally distributed.5 As a consequence, hypothesis tests and confidence limits based upon normality and constant variance are unreliable. I therefore computed 95% confidence limits using bootstrap resampling,6 with 2000 repetitions.
Results
The subjects of the analysis described here were respondents to the NPHS, aged 40 to 79 years, residing in Ontario. The lower limit of 40 years was selected to avoid potential difficulties in interpretation caused by inclusion of obstetric services. Approval for the linkage of NPHS responses to administrative databases was granted by 2264 (89%) of the Ontario respondents in this age range. Logistic regression analysis showed that the rate of linkage approval was independent of age, sex and household income. Income data were missing for 94 respondents, which left 2170 for income-related analysis.
Most of the respondents (86%) were urban dwellers. Table 1 shows the distribution of respondents by household income, according to age, sex and education. Lower household income was associated with older age and female sex. Household income was positively associated with education (high school graduation status).
Table 1
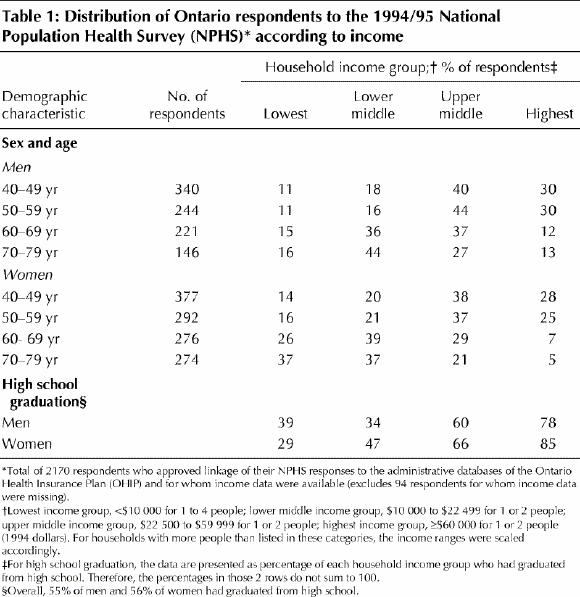
Table 2 shows the distribution of respondents by self-reported health status, according to age, sex and education. Self-reported health status was lower among older respondents, but there was no significant difference between men and women. Health status was also positively associated with education.
Table 2
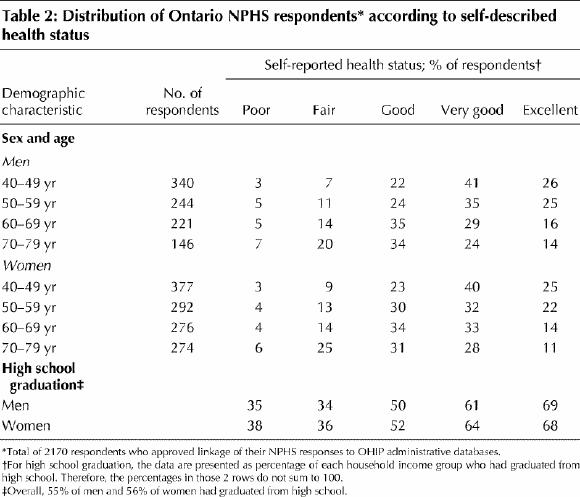
Table 3 shows the relations between household income and health status. In general, higher self-reported health status was associated with higher household income.
Table 3
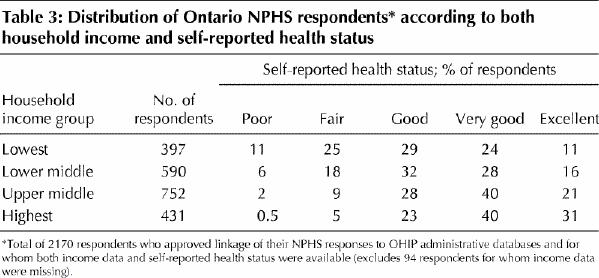
Table 4 presents the results of 2 linear regression models relating total expenditures on physician services to household income and other explanatory variables. Model 1 includes household income and rural or urban residence. In this model mean expenditures were significantly lower in higher income households and were about $200 less for those in the upper half of the income range than for those in the lowest income category.
Table 4
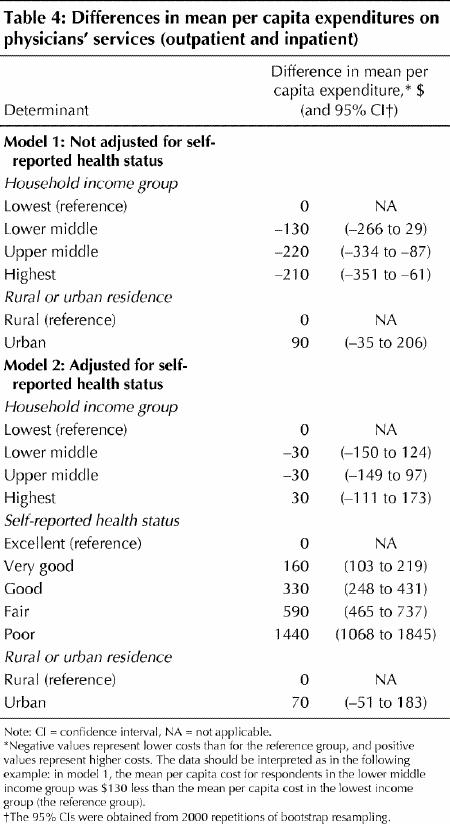
Model 2 in Table 4 includes an adjustment for self- reported health status. Here, mean expenditures were substantially higher among those with worse health status. This model demonstrates that the income-related differences in model 1 can be explained by the lower health status of residents of lower income households because, after adjustment for health status, there was no relation between household income and mean per capita expenditures on physicians' services.
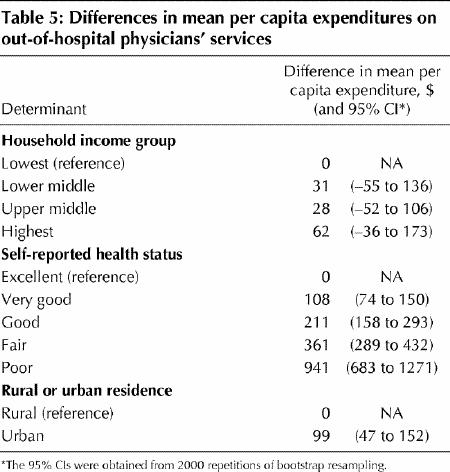
Table 5 provides the results of an analysis limited to out-of-hospital expenditures. Expenditures here were also strongly related to health status, with no significant associations between expenditures and household income. Urban dwellers had significantly higher per capita expenditures than rural residents. This finding may reflect easier access to physicians and to multiple providers in the urban setting.
Table 5
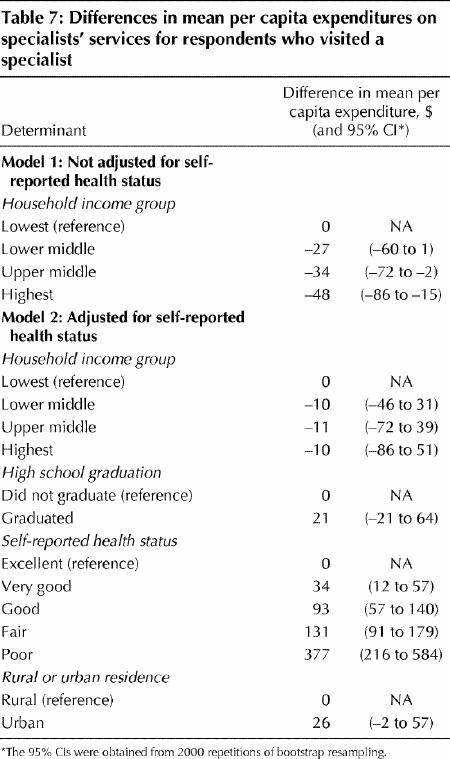
Specialists provided outpatient consultation and follow-up services to 1051 (53%) of the 1993 respondents who had seen a physician in the year before the NPHS interview. The data were analyzed with a 2-stage approach. The first step of the analysis explored factors associated with the probability of visiting a specialist (Table 6). Self-reported health status was strongly related to the probability of seeing a specialist. The proportion of respondents with fair self-reported health status who visited a specialist was 25% higher than the proportion of respondents with excellent health status who did so. After adjustment for health status, the proportion of respondents who saw a specialist was unrelated to income. However, the proportion of high school graduates visiting a specialist was significantly higher than that of respondents who had not completed high school. The second step was an analysis of factors associated with expenditures on specialist care among those who visited a specialist (Table 7). The mean expenditure on specialist care was $48 lower among those with the highest household incomes than among those with the lowest incomes. Model 2 in Table 7 shows that this difference is attributable to the poorer health status of lower income people because, after adjustment for health status, there was no relation between household income and expenditures on specialist care. The expenditures of high school graduates were higher than those of nongraduates, but the difference was not significant. The mean per capita expenditures of urban dwellers were $26 higher than those of rural respondents; this difference was of borderline significance.
Table 6
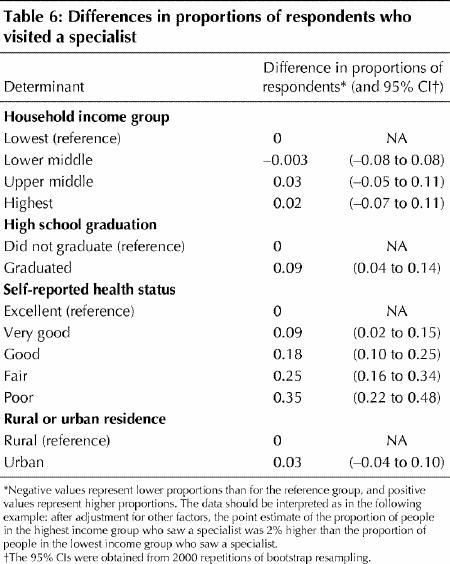
Table 7
Interpretation
The goal of a universal health insurance system is to ensure access to care on the basis of need, rather than income. My aim in this analysis was to investigate whether that goal has been achieved in Ontario. I found that expenditures on physician services were explained by health status and were unrelated to household income.
Work elsewhere has shown that self-reported health status is a predictor of death7 and health care utilization.8 Pope9 found that self-rated health status measured conditions that tended to be chronic and severe, such as heart and cerebrovascular diseases. Self-reported health status may of course measure a perception of need with which physicians might not agree. Whatever the cause of self- perceived poor health, low income is not a barrier to physician assessment and care in Ontario.
Table 4 shows that those with the lowest incomes had the highest per capita expenditures on physicians' services. There is a strong association between income and health status. The 1990 Canadian Health Promotion Survey found that Canadians with the lowest incomes were 7 times more likely than those with the highest incomes to report their health as only fair or poor (35% v. 5%),10 and this inverse relation between health status and income was also found among respondents to the NPHS (Table 3). For some of these people, poor health is the cause of low income status. For others, health may be diminished by factors associated with low income. In an analysis of the 1990 Ontario Health Survey11 measures of “unhealthy” behaviours such as smoking, high fat intake, alcohol consumption and low physical activity were inversely associated with the socioeconomic indices, which suggested that people in lower socioeconomic groups are at increased risk for health problems.
Utilization of physicians' services in the community is partially related to physicians' recall patterns but is to a large extent determined by patients' needs and desires.12 The mean per capita expenditure on out-of-hospital services was about $100 higher among urban residents than among rural residents. This difference may be due, in part, to only partially controlled confounding by other variables, but it might also be related to differences in access to physicians. Ontario, like many other jurisdictions, is reported to have a shortage of physicians in rural and remote locations. Urban residents have access to a large number of primary care physicians and specialists and to walk-in clinics. It is yet not clear, from this study or from other research, what level of utilization is appropriate.
Dunlop and colleagues,1 who also used self-reported data from the NPHS, concluded that lower income, less well educated Canadians have poorer access to specialists than higher income, better educated Canadians. However, self-reporting of physician visits may be unreliable.13,14 A strength of the study reported here is the use of administrative data on health care utilization. I found that, after adjusting for health status, there was no relation between income and the probability of referral to a specialist (Table 6) or expenditures on specialists' services after the referral (Table 7). Like Dunlop and colleagues,1 I found that high school graduates were significantly more likely to see a specialist than respondents with less education. This probably reflects the psychology of the interaction between the primary care provider and the patient. Less well educated patients may be less likely to request a referral, or physicians may be more comfortable in denying such requests. However, after referral, there were no significant differences in expenditures in relation to education (Table 7).
A weakness of this study is that a small proportion of physicians' services in Ontario, including those provided in health services organizations and the emergency departments of some teaching hospitals, are handled within global budgets. Some of these organizations have submitted “shadow billing” to the Ministry of Health, but others have not, so their services were not included in this study. However, because these services represent a small proportion of total billings, their absence should not substantially affect the conclusions. Another weakness is that the physician utilization data covered the 1-year period before the health survey. Therefore, respondents constituted a “survivor population.” Any income-related factors preferentially leading to death cannot be investigated without a follow-up linkage. Conversely, any worsening of health status causing higher expenditures in that year would be captured by the interview, so that any residual confounding of the income analysis by health status was probably less than if the data on health status had been collected prospectively.
In conclusion, this analysis, which used individual-level population-based data, has shown that the utilization of physicians' services under universal health insurance in Ontario is based on need rather than income.
Footnotes
This article has been peer reviewed.
Competing interests: None declared.
Correspondence to: Dr. Murray Finkelstein, Family Medicine Centre, Suite 413, Mount Sinai Hospital, Toronto ON M5G 1X5; fax 416 326-7761; murray.finkelstein@utoronto.ca
References
- 1.Dunlop S, Coyte PC, McIsaac W. Socio-economic status and the utilisation of physicians' services: results from the Canadian National Population Health Survey. Soc Sci Med 2000;51:123-33. [DOI] [PubMed]
- 2.Alter DA, Naylor CD, Austin P, Tu JV. Effects of socioeconomic status on access to invasive cardiac procedures and on mortality after acute myocardial infarction. N Engl J Med 1999;341(18):1359-67. [DOI] [PubMed]
- 3.Tambay JL, Catlin G. Sample design of the national population health survey. Health Rep 1995;7(1):29-38. [PubMed]
- 4.Wacholder S. Binomial regression in GLIM: estimating risk ratios and risk differences. Am J Epidemiol 1986;123(1):174-84. [DOI] [PubMed]
- 5.Diehr P, Yanez D, Ash A, Hornbrook M, Lin DY. Methods for analyzing health care utilization and costs. Annu Rev Public Health 1999;20:125-44. [DOI] [PubMed]
- 6.Efron B, Tibshirani RJ. An introduction to the bootstrap. London: Chapman and Hall; 1994.
- 7.Idler EL, Benyamini Y. Self-rated health and mortality: a review of twenty-seven community studies. J Health Soc Behav 1997;38(1):21-37. [PubMed]
- 8.Connelly JE, Philbrick JT, Smith GR, Kaiser DL, Wymer A. Health perceptions of primary care patients and the influence on health care utilization. Med Care 1989;27(3 Suppl):S99-109. [DOI] [PubMed]
- 9.Pope GC. Medical conditions, health status, and health services utilization. Health Serv Res 1988;22(6):857-77. [PMC free article] [PubMed]
- 10.Health Canada. Report on the Health of Canadians. Ottawa: Health Canada; 1996.
- 11.Pomerleau J, Pederson LL, Ostbye T, Speechley M, Speechley KN. Health behaviours and socio-economic status in Ontario, Canada. Eur J Epidemiol 1997;13(6):613-22. [DOI] [PubMed]
- 12.Finkelstein MM. Hypertension, self-perceived health status and use of primary care services. CMAJ 2000;162:45-6. Available: www.cma.ca/cmaj/vol-162/issue-1/0045.htm [PMC free article] [PubMed]
- 13.Roberts RO, Bergstralh EJ, Schmidt L, Jacobsen SJ. Comparison of self- reported and medical record health care utilization measures. J Clin Epidemiol 1996;49(9):989-95. [DOI] [PubMed]
- 14.Redelmeier DA, Tu JV, Schull MJ, Ferris LE, Hux JE. Problems for clinical judgement: 2. Obtaining a reliable past medical history. CMAJ 2001; 164(6):809-13. Available: www.cma.ca/cmaj/vol-164/issue-6/0809.asp [PMC free article] [PubMed]