Abstract
Background:
Glioblastoma (GBM) is the most common clinical intracranial malignancy worldwide, and the most common supratentorial tumor in adults. GBM mainly causes damage to the brain tissue, which can be fatal. This research explored potential gene targets for the diagnosis and treatment of GBM using bioinformatic technology.
Methods:
Public data from patients with GBM and controls were downloaded from the Gene Expression Omnibus database, and differentially expressed genes (DEGs) were identified by Gene Expression Profiling Interactive Analysis (GEPIA) and Gene Expression Omnibus 2R (GEO2R). Construction of the protein–protein interaction network and the identification of a significant module were performed. Subsequently, hub genes were identified, and their expression was examined and compared by real-time quantitative (RT-q)PCR between patients with GBM and controls.
Results:
GSE122498 (GPL570 platform), GSE104291 (GPL570 platform), GSE78703_DMSO (GPL15207 platform), and GSE78703_LXR (GPL15207 platform) datasets were obtained from the GEO. A total of 130 DEGs and 10 hub genes were identified by GEPIA and GEO2R between patients with GBM and controls. Of these, strong connections were identified in correlation analysis between CCNB1, CDC6, KIF23, and KIF20A. RT-qPCR showed that all 4 of these genes were expressed at significantly higher levels in patients with GBM compared with controls.
Conclusions:
The hub genes CCNB1, CDC6, KIF23, and KIF20A are potential biomarkers for the diagnosis and treatment of GBM.
Keywords: Glioblastoma, Gene Expression Omnibus database, Differentially expressed genes, Bioinformatics, Hub gene
Introduction
Glioblastoma (GBM) is the most common intracranial malignancy in the clinic, accounting for 15% of all intracranial tumors and 50% of gliomas; it is also the most common supratentorial tumor in adults (Alexander and Cloughesy, 2017). GBM can occur at any age although the average age of onset is 57 years. Surgery is typically advised as a treatment for GBM because it removes as much of the tumor as possible with little nerve damage; however, microinfiltrations of GBM cells can occur, and it is not possible to dissect the entire tumor, so a relapse is possible (Brown, et al., 2016). GBM mainly causes damage to brain tissue by compression, which results in a loss of neural function, and can be fatal.
Glioma is a general term for neuroepithelial tumors that involve the differentiation of cells into glial cells (Korshunov, et al., 2016), and it is the most common primary intracranial tumor. The World Health Organization divides glioma into 4 pathological grades (I-IV) with increasing disease severity; GBM belongs to grade IV which has an unfavorable prognosis. GBM has 2 subtypes in clinical diagnosis. Secondary glioblastoma, which develops from low-grade glioma, accounts for 5%-10% of all GBM, and mainly affects patients younger than 55 years. Primary glioblastoma (pGBM), which is typically diagnosed during the initial consultation, accounts for 90%-95% of all GBM, and mainly affects patients older than 55 years. GBM affects any part of the central nervous system, especially the deep white matter of the cerebral hemisphere (Jain, et al., 2014). Typically, both frontal and temporal lobes are involved at the same time, with deep infiltration and extensive invasion.
Because the prognosis of GBM is very poor, studies have investigated genetic markers to aid its prediction, diagnosis, and treatment. Exploring precise molecular targets involved in the occurrence and progression of GBM is of great importance in prolonging the survival of patients with GBM. For example, Toll-like receptor 4 (TLR4) expression in the central nervous system is closely associated with GBM (Sanson and Idbaih, 2013), and the interaction between the TLR-4 signaling pathway and micro (mi)RNA has become a target for modern GBM immunotherapy. TLR-4 activation promotes the expression of programmed death ligand-1, resulting in the autocrine induction of local immunosuppression in the GBM microenvironment. TLR-4 also promotes the Wnt/DKK-3/Claudin-5 signaling pathway, limiting GBM invasion (Litak, et al., 2020).
Recent studies have shown that micro (mi)RNAs, which account for 1%-3% of the human genome, have the potential to provide new immune checkpoints and hypotheses for the control of GBM based on genome sequencing. As an example, miR-29c inhibits O6-methylguanine-DNA methyl-transferase via specificity protein 1 to treat GBM, whereas miR-29c-induced G1 phase arrest was shown to promote apoptosis and inhibit cell migration and invasion, thus blocking glioblastoma cell proliferation. At least part of its antitumor effect is mediated by the specific down-regulation of CDK6 expression (Wang, et al., 2013). Moreover, miR-124-3p suppresses the expression of endothelin receptor type B to impede the development of GBM (Mazurek, et al., 2020).
Studies on screening and identifying GBM genetic targets by the integration and analysis of big data are still limited because of the high false positive rate of single-center studies and lack of data. Bioinformatic technology is an emerging tool of big data mining that can determine differences in gene expression between patients and healthy controls (Wilson, et al., 2018), and has been proven to be an effective means of identifying biomarkers of diseases.
Therefore, in this study, 4 gene expression datasets from patients with GBM and control individuals were downloaded and analyzed. We conducted functional enrichment analysis, survival analysis, and correlation analysis to screen differentially expressed genes (DEGs) and hub genes related to the occurrence and progression of GBM, and discuss possible molecular mechanisms involved in disease.
Materials and methods
DEG identification by Gene Expression Profiling Interactive Analysis (GEPIA)
The expression profiles of genes showing differential expression between GBM patients and control samples were observed using GEPIA (http://gepia.cancer-pku.cn/).
Public databases
The Gene Expression Omnibus (GEO, http://www.ncbi.nlm.nih.gov/geo) is an open platform to store genetic data (Edgar, et al., 2002). Four expression profiling datasets [GSE122498 (GPL570 platform), GSE104291 (GPL570 platform), GSE78703_DMSO (GPL15207 platform), and GSE78703_LXR (GPL15207 platform)] were obtained from GEO. Within these datasets, GSE122498 contained 16 GBM samples and 1 healthy brain sample; GSE104291 contained 24 and 2; GSE78703_DMSO contained 3 and 3; and GSE78703_LXR contained 3 and 3, respectively.
DEG identification by GEO2R
GEO2R (https://www.ncbi.nlm.nih.gov/geo/geo2r/) is an interactive online tool to identify DEGs from GEO series (Barrett, et al., 2013) and was used here to identify DEGs between GBM and healthy brain tissue samples. The Benjamini-Hochberg adjustment was made to the P-value (adj. P) to control the false discovery rate and maintain the balance between the possibility of false-positives and the detection of significant genes. If 1 probe set lacked a homologous gene, or if 1 gene had numerous probe sets, the data were removed. The fold-change (FC) threshold was set as ≥2 and adj. P ≤0.01 was considered statistically significant. Venn diagrams were constructed by FunRich software (www.funrich.org).
Functional annotation for DEGs using Kyoto Encyclopedia of Genes and Genomes (KEGG) and Gene Ontology (GO) analyses
The Database for Annotation, Visualization and Integrated Discovery (DAVID; https://david.ncifcrf.gov/home.jsp) (version 6.8) tool suite (Huang, et al., 2007) was used to perform GO (Ashburner, et al., 2000) and KEGG (https://www.kegg.jp/) (Kanehisa, 2002) analyses. GO analysis classified ontologies into 3 categories: biological process (BP), cellular component (CC), and molecular function (MF). P<0.05 was considered statistically significant.
Construction of the protein–protein interaction (PPI) network and identification of significant module
Search Tool for the Retrieval of Interacting Genes (STRING, http://string.embl.de/) was used to construct the DEG PPI network, which was presented by Cytoscape visualization software (version 3.6.1) (Smoot, et al., 2011) (Szklarczyk, et al., 2015). A confidence score >0.4 was set as the criterion of judgment. Next, the Molecular Complex Detection (MCODE) (version 1.5.1, a plug-in of Cytoscape) identified the most important module of the network map using the following criteria: degree cut-off = 2, MCODE scores >5, max depth = 100, node score cut-off = 0.2, and k-score = 2 (Bader and Hogue, 2003).
Analysis and identification of hub genes
Hub genes were excavated when the cut-off value for degrees ≥10. Subsequently, KEGG and GO analyses in the DAVID database were used to functionally annotate the hub genes. cBioPortal (http://www.cbioportal.org) (Cerami, et al., 2012) was used to obtain a co-expression network of hub genes and perform clustering and survival analyses of hub genes, including Kaplan–Meier analysis. Hub gene expression profiles in GBM and control samples as well as in different organs were analyzed and displayed using GEPIA. GEPIA also displayed hub gene expression profiles in different tumor types and compared these using correlation analysis.
GBM patients and controls
Twelve participants were recruited to the study from Zhejiang Cancer Hospital and The Fourth Hospital of Hebei Medical University between 1 April 2017 and 1 April 2019. These included 6 GBM patients (3 males and 3 females, average age: 60 ± 5 years old) and 6 control individuals with mesial temporal lobe epilepsy (3 males and 3 females, average age: 60 ± 5 years old). During surgery, brain samples were taken from control individuals and from GBM tumors in patients with GBM. The research conformed to the Declaration of Helsinki and was authorized by the Human Ethics and Research Ethics Committees of Zhejiang Cancer Hospital (approval no. ZJCH-2017012). Written informed consent was obtained from all participants.
Real-time quantitative (RT-q)PCR
Total RNA was extracted from brain samples using the RNAiso Plus (TRIzol) kit (Thermo Fisher Scientific, Waltham, MA, USA), and reverse-transcribed into cDNA. RT-qPCR was performed using a Light Cycler® 4800 System with specific primers for hub genes (Table 1). Relative gene expression was determined using 2−ΔΔCt, where Ct is the threshold cycle, and are presented as fold-changes in gene expression relative to the control group. Glyceraldehyde 3-phosphate dehydrogenase was used as an endogenous control.
Results
Screening of DEGs in GBM
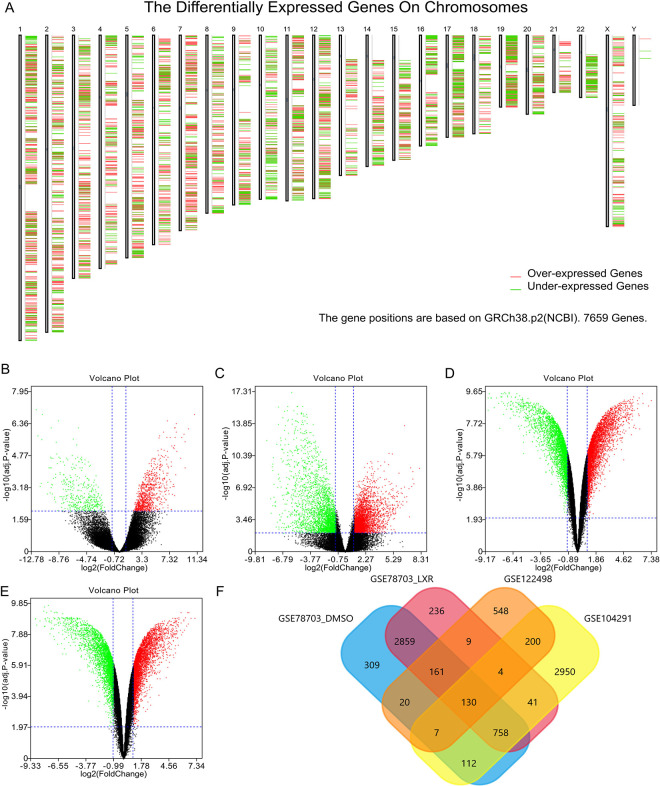
Several DEGs were identified between GBM and control samples (Figure 1A). After analysis of the GSE122498, GSE104291, GSE78703_DMSO, and GSE78703_LXR datasets with GEO2R, differences between GBM tissues and control samples were presented in volcano plots (Figure 1B–E). A total of 130 DEGs were shown to be common to all 4 datasets in a Venn diagram (Figure 1F).
Figure 1.
Identification of DEGs. (A) DEGs between GBM and control samples. Over-expressed genes are shown in red, and under-expressed genes in green. (B) Volcano plot showing the difference between GBM and control samples after GSE122498 dataset analysis with GEO2R. (C) Volcano plot showing the difference between GBM and control samples after GSE104291 dataset analysis with GEO2R. (D) Volcano plot showing the difference between GBM and control samples after GSE78703_DMSO dataset analysis with GEO2R. (E) Volcano plot showing the difference between GBM and control samples after GSE78703_LXR dataset analysis with GEO2R. (F) Venn diagram showing the 130 DEGs common to all 4 datasets DEG, differentially expressed gene; GBM, glioblastoma.
DEG functional annotation using KEGG and GO analyses
GO analysis showed that variations in the BP were mainly enriched in cell division, mitotic nuclear division, DNA replication, chromosome segregation, sister chromatid cohesion, cell proliferation, the G2/M transition of mitotic cell cycle, and the G1/S transition of mitotic cell cycle. Changes in CC were mainly enriched in the nucleoplasm, nucleus, cytoplasm, condensed chromosome kinetochore, and cytosol, whereas variations in MF were enriched in protein binding and ATP binding (Table 2). KEGG analysis showed that DEGs were mainly enriched in the cell cycle, DNA replication, and the Fanconi anemia pathway (Table 2).
Construction of the PPI network and identification of the significant module
A total of 1394 edges and 98 nodes were identified in the PPI network (Figure 2A), and 1006 edges and 47 nodes in the significant module (Figure 2B).
Figure 2.
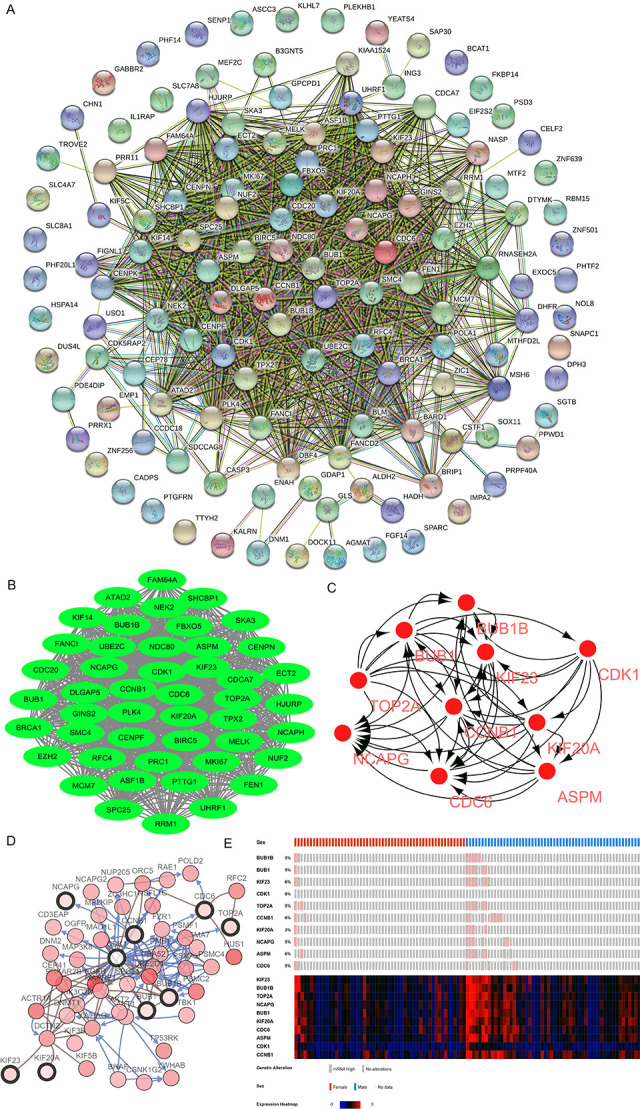
(A) PPI network of DEGs consisting of 1394 edges and 98 nodes. (B) The significant module network selected from the PPI network consisting of 1006 edges and 47 nodes. (C) Ten hub genes identified by the criterion of judgment (degrees ≥10), including CCNB1, CDC6, KIF23, KIF20A, BUB1B, BUB1, CDK1, TOP2A, NCAPG, and ASPM. (D) One co-expression network of the hub genes obtained with cBioPortal. (E) Hierarchical clustering showing the hub gene differentiation of female from male GBM samples PPI, protein-protein interaction; DEG, differentially expressed gene; GBM, glioblastoma.
Hub gene selection and analysis
Ten hub genes were identified using Cytoscape: CCNB1, CDC6, KIF23, KIF20A, BUB1B, BUB1, CDK1, TOP2A, NCAPG, and ASPM (Figure 2C). GO analysis showed that hub genes were mainly enriched in cell division, mitotic nuclear division, the midbody, nucleoplasm, ATP binding, and histone kinase activity. KEGG pathway analysis showed that they were mainly enriched in the cell cycle and progesterone-mediated oocyte maturation (Table 3).
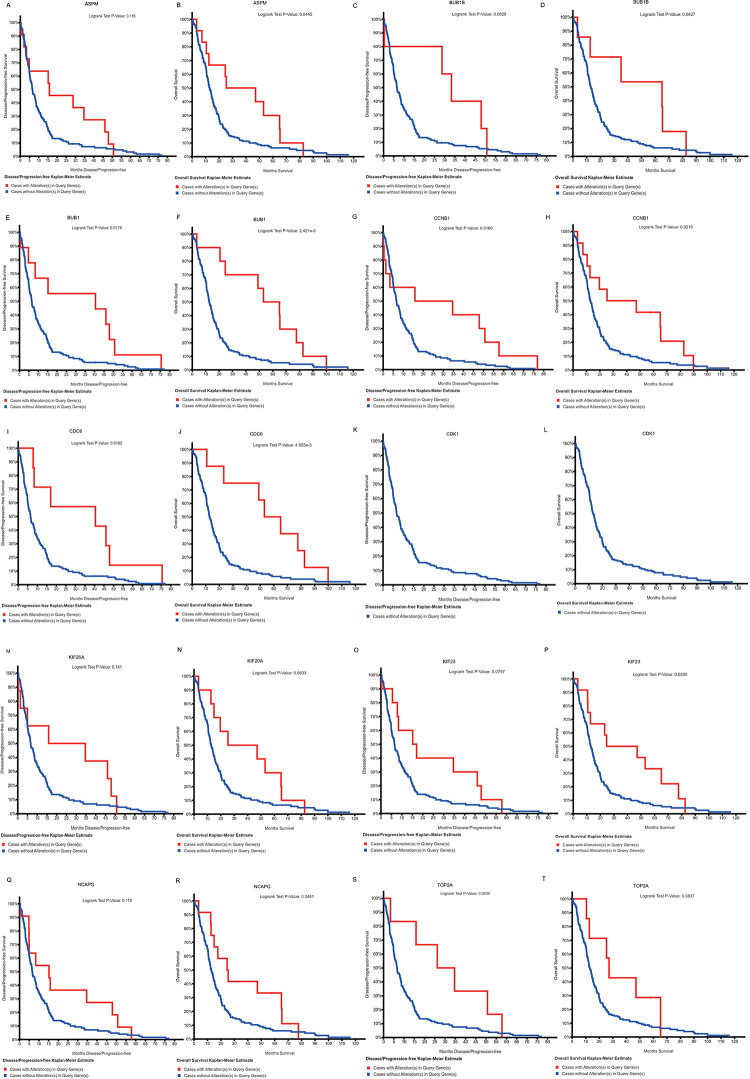
One co-expression network of these hub genes was obtained with cBioPortal (Figure 2D). Hierarchical clustering showed that hub genes could differentiate female GBM samples from male GBM ones (Figure 2E). cBioPortal was also used to perform Kaplan-Meier estimates of progression-free and overall survival. In a total of 206 GBM patients from The Cancer Genome Atlas, worse overall survival was seen when there were no mutations in any of the 10 hub genes identified in the present study (Figure 3A–T).
Figure 3.
Kaplan-Meier estimates of progression-free and overall survival by cBioPortal for ASPM (A, B), BUB1B (C, D), BUB1 (E, F), CCNB1 (G, H), CDC6 (I, J), CDK1 (K, L), KIF20A (M, N), KIF23 (O, P), NCAPG (Q, R), and TOP2A (S, T)
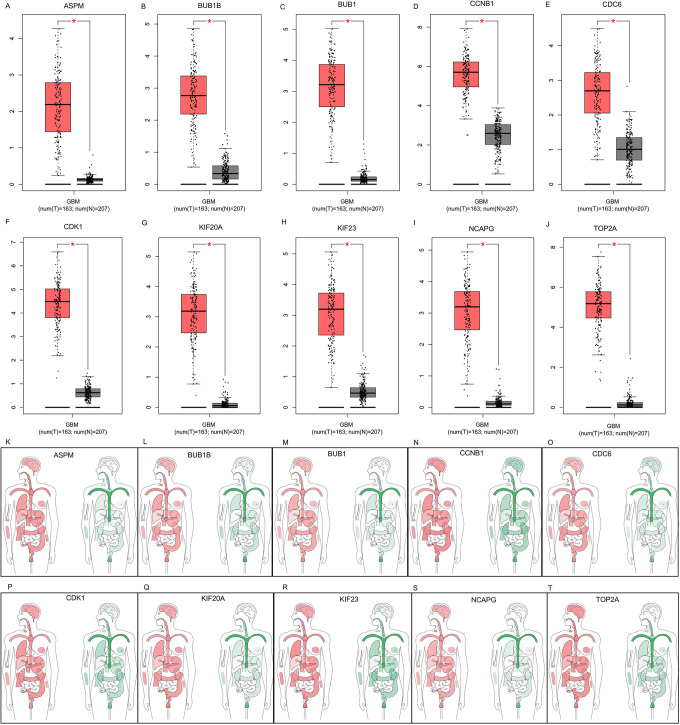
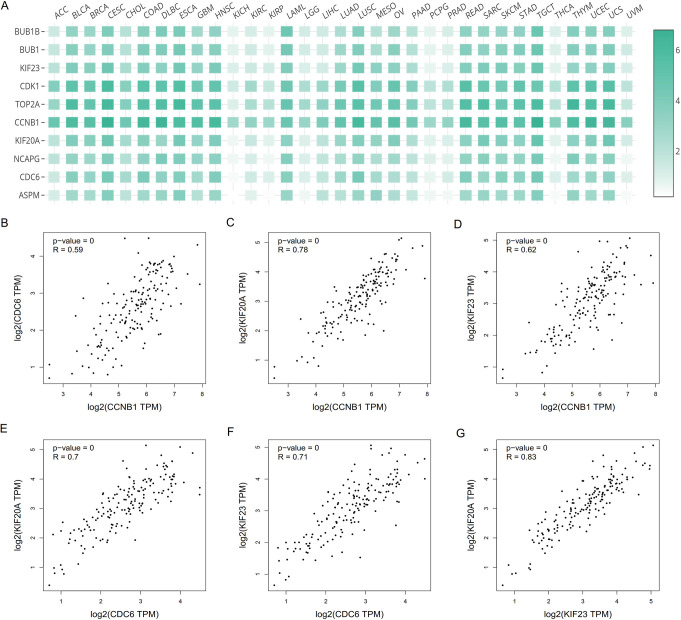
GEPIA analysis showed that the expression of all hub genes was significantly higher in GBM samples than control samples (P<0.05; Figure 4A-J). Moreover, hub genes were expressed at significantly higher levels in different organs of patients with GBM compared with those in healthy controls (P<0.05; Figure 4K-T). Comparing the expression of hub genes among various tumors, all hub genes were shown to be significantly up-regulated in GBM samples compared with other tumor samples (P<0.05; Figure 5A). Correlation analysis identified strong connections between CCNB1, CDC6, KIF23, and KIF20A (Figure 5B-G). Summaries of the functions of these genes are shown in Table 4.
Figure 4.
Comparison of hub gene expression between GBM and control samples for ASPM (A), BUB1B (B), BUB1 (C), CCNB1 (D), CDC6 (E), CDK1 (F), KIF20A (G), KIF23 (H), NCAPG (I), and TOP2A (J). Hub gene expression in different organs was higher in patients with GBM than controls for ASPM (K), BUB1B (L), BUB1 (M), CCNB1 (N), CDC6 (O), CDK1 (P), KIF20A (Q), KIF23 (R), NCAPG (S), and TOP2A (T) GBM, glioblastoma.
Figure 5.
(A) Comparison of hub gene expression among tumor types. (B) Correlation analysis between CCNB1 and CDC6. (C) Correlation analysis between CCNB1 and KIF20A. (D) Correlation analysis between CCNB1 and KIF23. (E) Correlation analysis between CDC6 and KIF20A. (F) Correlation analysis between CDC6 and KIF23. (G) Correlation analysis between KIF23 and KIF20A
RT-qPCR analysis
RT-qPCR analysis showed that relative expression levels of CCNB1, CDC6, KIF23, and KIF20A were significantly higher in GBM samples compared with controls (P<0.05, Figure 6).
Figure 6.
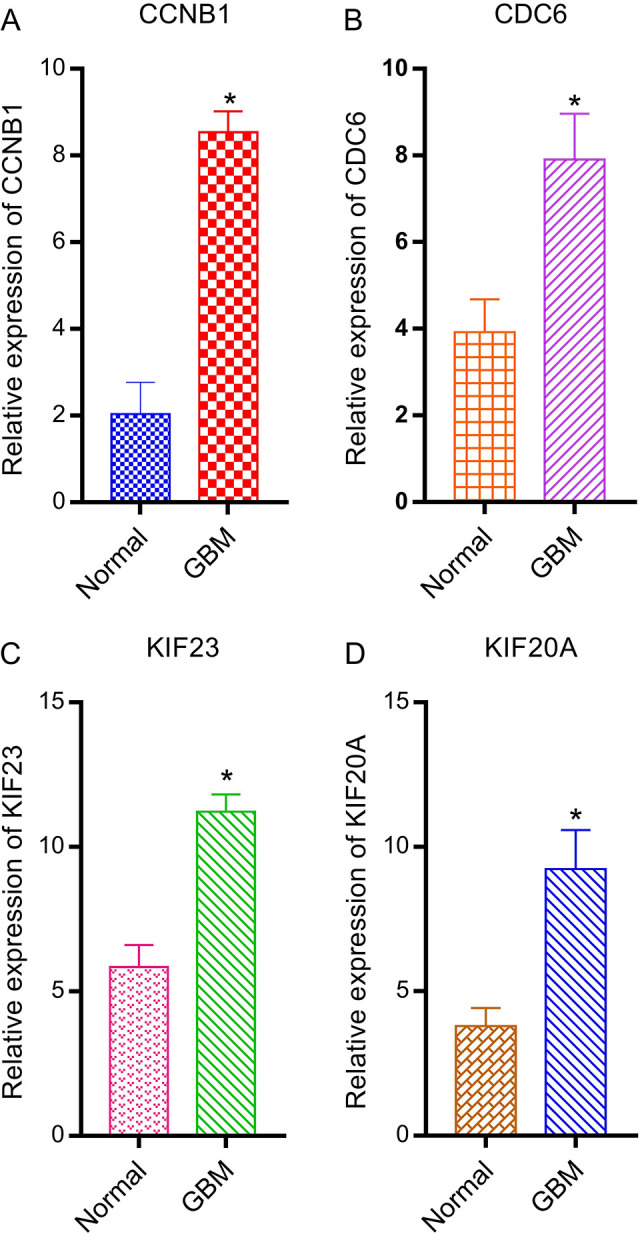
Relative expression of CCNB1, CDC6, KIF23, and KIF20A by RT-qPCR analysis. *P< 0.05, compared with controls RT-qPCR, real-time quantitative PCR.
Discussion
Recent studies have focused on screening immune-related molecular markers to predict the prognosis of patients with GBM. Overall survival was shown to differ significantly in patients with GBM whose isocitrate dehydrogenase gene mutation status varied, with those harboring mutations found to have a better prognosis (Wang, et al., 2013). Another study identified 10 miRNA molecular markers for GBM, of which 7 (miR-31, miR-222, miR-148a, miR-221, miR-146b, miR-200b, and miR-193a) were dangerous, whereas 3 (miR-20a, miR-106a, and miR-17-5P) were protective (Srinivasan, et al., 2011). Moreover, according to an mRNA expression profile, 3 genes (FPR3, IKBIP, and S100A9) showed prognostic value for patients with GBM (Wang, et al., 2016).
Blocking the malignant progression of GBM is a key aim of targeted therapy (Polivka Jr, et al., 2017), and the exploration of relevant molecular biological mechanisms of GBM through new bioinformatic techniques is an important direction in neural tumor studies. The identification of potential biomarkers for efficient GBM diagnosis and treatment is urgently needed, and herein we identified 130 DEGs and 10 hub genes from the GEO database using bioinformatic technology which are potential therapeutic targets or biomarkers of GBM. Of the 10 hub genes, 4 were identified as being strongly connected through correlation analysis (CCNB1, CDC6, KIF23, and KIF20A).
The CCNB1 gene product is a regulatory protein involved in mitosis which combines with p34 (Cdc2) to form a maturation promoting factor (German, et al., 2015). CCNB1 was shown to be involved in the occurrence and progression of tumors, and to function through a variety of transcripts, among which 1 mainly expressed in the G2/M phase and regulated by the cell cycle is the most notable (Shi, et al., 2018). Transcript diversity is thought to occur by using alternate transcriptional start points. CCNB1 is up-regulated in cell division, proliferation, and apoptosis (Schnittger and De Veylder L, 2018), and GO and KEGG analyses showed it to be downstream in the cell cycle signaling pathway. We found that CCNB1 was expressed at higher levels in patients with GBM than controls, and that its expression correlated with disease-free survival and overall survival of patients with GBM. It is conceivable that CCNB1 over-expression accelerates mitosis and promotes GBM tumor cell proliferation and invasion, suggesting it plays an important role in the occurrence and progression of GBM.
CDC6 encodes a replication-regulating enzyme that localizes in the nucleus during G1 phase of the cell cycle and transfers to the cytoplasm at the beginning of S phase, where it combines with the replication origin recognition complex and initiates replication by regulating downstream molecules to open double-stranded DNA (Warner, et al., 2017). CDC6 changes its location mainly through a phosphorylation mechanism, which transfers it to the cytoplasm in S phase (Liu, et al., 2009). CDC6 regulates mitotic signaling by translational regulation mechanisms involving the E2F protein, and CDC6 is degraded by the ubiquitin-proteasome system during mitosis. Our study showed that DEGs identified between patients with GBM and healthy controls were mainly enriched during cell cycle changes involving CDC6, and that changes in CDC6 expression were closely related to the disease-free survival and overall survival of patients with GBM. A possible mechanism is that CDC6 over-expression induces cell replication and promotes the proliferation and invasion of GBM.
The protein encoded by KIF23 belongs to the kinin-like protein family, which also includes microtubule-dependent molecular motors that transfer organelles and move chromosomes during cell division. Microtubules control cell morphology and processes such as movement, mitosis, intracellular vesicle trafficking, and organelle locations, and have long been considered major chemotherapy targets (Tripathi, et al., 2016). KIF23 was shown to drive microtubule movement in vitro (Schröder, et al., 2018), and to be a key regulator of cytokinesis (Ravindranath, et al., 2018), whereas alternative splicing of KIF23 induces multiple transcript variations. We detected higher KIF23 expression in patients with GBM compared with controls, and showed that changes in KIF23 expression were closely related to disease-free survival and overall survival in patients with GBM. We speculate that high KIF23 expression maintains the malignant proliferation of tumors through intracellular material transport and information flow, suggesting that it could be a molecular target in GBM treatment.
The product encoded by KIF20A mainly affects mitosis, and was shown to be abnormally expressed in patients with ovarian clear cell carcinoma (Kawai, et al., 2018); it is also thought to be associated with isolated restrictive cardiomyopathy (Louw, et al., 2018). Consistent with these studies, we observed higher KIF20A expression in patients with GBM than in healthy controls. It is possible that KIF20A acts downstream on protein kinases and ATPases, thus participating in the movement of microfilaments and microtubules. The downstream signaling pathway of KIF20A includes polo-like kinase 1 (Wu, et al., 2018), and it affects the reverse transport of Golgi to the endoplasmic reticulum as well as the major histocompatibility class I antigen presentation and processing pathway. It also appears to be involved in the exchange of information between cells and maintains the malignant proliferation of tumors (Zhao, et al., 2018). Therefore, KIF20A is a potential biomarker for GBM diagnosis and treatment.
A limitation of this study is that it was restricted to bioinformatics analysis, with no in vitro or in vivo experiments to verify the results. Therefore, the biological function of all hub genes in GBM should be further studied and validated.
Conclusions
The present study identified 130 DEGs and 10 hub genes between patients with GBM and control individuals, which could serve as biomarkers for the diagnosis and treatment of GBM. By achieving an early diagnosis or targeted treatment, the survival rate and quality of life of patients with GBM could be greatly improved.
List of abbreviations
- BP
biological process
- CC
cellular component
- DAVID
Database for Annotation, Visualization and Integrated Discovery
- DEGs
differentially expressed genes
- GBM
glioblastoma
- GEO
Gene Expression Omnibus
- GEO2R
Gene Expression Omnibus 2R
- GEPIA
Gene Expression Profiling Interactive Analysis
- GO
Gene Ontology
- KEGG
Kyoto Encyclopedia of Genes and Genomes
- MCODE
molecular complex detection
- MF
molecular function
- MPF
maturation promoting factor
- pGBM
primary glioblastoma
- PPI
protein-protein interaction
- sGBM
secondary glioblastoma
- STRING
Search Tool for the Retrieval of Interacting Genes
- TLR4
Toll-like receptor 4.
Availability of data and materials: The datasets used and/or analyzed during the current study are available from the corresponding author on reasonable request.
Ethics approval and consent to participate: Our study was approved by The Human Ethics and Research Ethics Committees of Zhejiang Cancer Hospital. All patients provided written informed consent prior to enrollment in the study.
Conflict of interests statement: The author(s) declared no potential conflicts of interest with respect to the research, authorship, and/or publication of this article.
Funding: The author(s) received no financial support for the research, authorship, and/or publication of this article.
ORCID iD: Caixing Sun  https://orcid.org/0000-0002-3270-5975
References
- Alexander BM, Cloughesy TF. Adult Glioblastoma. J Clin Oncol. 2017. 35(21): 2402–2409. [DOI] [PubMed] [Google Scholar]
- Ashburner M, Ball CA, Blake JA, et al. Gene ontology: tool for the unification of biology. The Gene Ontology Consortium. Nat Genet. 2000. 25(1): 25–9. [DOI] [PMC free article] [PubMed] [Google Scholar]
- Bader GD, Hogue CW. An automated method for finding molecular complexes in large protein interaction networks. BMC Bioinformatics. 2003. 4: 2. [DOI] [PMC free article] [PubMed] [Google Scholar]
- Barrett T, Wilhite SE, Ledoux P, et al. NCBI GEO: archive for functional genomics data sets--update. Nucleic Acids Res. 2013. 41(Database issue): D991–5. [DOI] [PMC free article] [PubMed] [Google Scholar]
- Brown TJ, Brennan MC, Li M, et al. Association of the Extent of Resection With Survival in Glioblastoma: A Systematic Review and Meta-analysis. JAMA Oncol. 2016. 2(11): 1460–1469. [DOI] [PMC free article] [PubMed] [Google Scholar]
- Cerami E, Gao J, Dogrusoz U, et al. The cBio cancer genomics portal: an open platform for exploring multidimensional cancer genomics data. Cancer Discov. 2012. 2(5): 401–4. [DOI] [PMC free article] [PubMed] [Google Scholar]
- Edgar R, Domrachev M, Lash AE. Gene Expression Omnibus: NCBI gene expression and hybridization array data repository. Nucleic Acids Res. 2002. 30(1): 207–10. [DOI] [PMC free article] [PubMed] [Google Scholar]
- German SD, Lee JH, Campbell KH, Sweetman D, Alberio R. Actin depolymerization is associated with meiotic acceleration in cycloheximide-treated ovine oocytes. Biol Reprod. 2015. 92(4): 103. [DOI] [PubMed] [Google Scholar]
- Huang DW, Sherman BT, Tan Q, et al. The DAVID Gene Functional Classification Tool: a novel biological module-centric algorithm to functionally analyze large gene lists. Genome Biol. 2007. 8(9): R183. [DOI] [PMC free article] [PubMed] [Google Scholar]
- Jain A, Betancur M, Patel GD, et al. Guiding intracortical brain tumour cells to an extracortical cytotoxic hydrogel using aligned polymeric nanofibres. Nat Mater. 2014. 13(3): 308–16. [DOI] [PubMed] [Google Scholar]
- Kanehisa M. The KEGG database. Novartis Found Symp. 2002. 247: 91–101; discussion 101-3, 119-28, 244-52. [PubMed] [Google Scholar]
- Kawai Y, Shibata K, Sakata J, et al. KIF20A expression as a prognostic indicator and its possible involvement in the proliferation of ovarian clearcell carcinoma cells. Oncol Rep. 2018. 40(1): 195–205. [DOI] [PMC free article] [PubMed] [Google Scholar]
- Korshunov A, Capper D, Reuss D, et al. Histologically distinct neuroepithelial tumors with histone 3 G34 mutation are molecularly similar and comprise a single nosologic entity. Acta Neuropathol. 2016. 131(1): 137–46. [DOI] [PubMed] [Google Scholar]
- Litak J, 0000-0001-7954-9263 AO, Grochowski C, et al. 2020. TLR-4 Signaling vs. Immune Checkpoints, miRNAs Molecules, Cancer Stem Cells, and Wingless-Signaling Interplay in Glioblastoma Multiforme-Future Perspectives. Int J Mol Sci. 21(9). [DOI] [PMC free article] [PubMed] [Google Scholar]
- Liu L, Choi JH, Yim H, et al. ATR (AT mutated Rad3 related) activity stabilizes Cdc6 and delays G2/M-phase entry during hydroxyurea-induced S-phase arrest of HeLa cells. Int J Biochem Cell Biol. 2009. 41(6): 1410–20. [DOI] [PubMed] [Google Scholar]
- Louw JJ, 0000-0003-4317-8629 AO, Nunes Bastos R, et al. Compound heterozygous loss-of-function mutations in KIF20A are associated with a novel lethal congenital cardiomyopathy in two siblings. PLoS Genet. 2018. 14(1): e1007138. [DOI] [PMC free article] [PubMed] [Google Scholar]
- Mazurek M, Litak J, Kamieniak P, et al. 2020. Micro RNA Molecules as Modulators of Treatment Resistance, Immune Checkpoints Controllers and Sensitive Biomarkers in Glioblastoma Multiforme. Int J Mol Sci. 21(4). [DOI] [PMC free article] [PubMed] [Google Scholar]
- Polivka J, Jr, Polivka J, Holubec L, et al. Advances in Experimental Targeted Therapy and Immunotherapy for Patients with Glioblastoma Multiforme. Anticancer Res. 2017. 37(1): 21–33. [DOI] [PubMed] [Google Scholar]
- Ravindranath Y, Johnson RM, Goyette G, Buck S, Gadgeel M, Gallagher PG. 2018. KLF1 E325K-associated Congenital Dyserythropoietic Anemia Type IV: Insights Into the Variable Clinical Severity. J Pediatr Hematol Oncol. 40(6): e405–e409. [DOI] [PMC free article] [PubMed] [Google Scholar]
- Sanson M, Idbaih A. Neuro-oncology: Novel molecular targets in treatment of glioblastoma. Nat Rev Neurol. 2013. 9(11): 612–3. [DOI] [PubMed] [Google Scholar]
- Schnittger A, De Veylder L. The Dual Face of Cyclin B1. Trends Plant Sci. 2018. 23(6): 475–478. [DOI] [PubMed] [Google Scholar]
- Schröder A, Bauer K, Spanier G, Proff P, Wolf M, Kirschneck C. 2018. Expression kinetics of human periodontal ligament fibroblasts in the early phases of orthodontic tooth movement. J Orofac Orthop. 79(5): 337–351. [DOI] [PubMed] [Google Scholar]
- Shi Y, Guo S, Wang Y, Liu X, Li Q, Li T. Lamprey Prohibitin2 Arrest G2/M Phase Transition of HeLa Cells through Down-regulating Expression and Phosphorylation Level of Cell Cycle Proteins. Sci Rep. 2018. 8(1): 3932. [DOI] [PMC free article] [PubMed] [Google Scholar]
- Smoot ME, Ono K, Ruscheinski J, Wang PL, Ideker T. Cytoscape 2.8: new features for data integration and network visualization. Bioinformatics. 2011. 27(3): 431–2. [DOI] [PMC free article] [PubMed] [Google Scholar]
- Srinivasan S, Patric IR, Somasundaram K. 2011. A ten-microRNA expression signature predicts survival in glioblastoma. PLoS One. 6(3): e17438. [DOI] [PMC free article] [PubMed] [Google Scholar]
- Szklarczyk D, Franceschini A, Wyder S, et al. STRING v10: protein-protein interaction networks, integrated over the tree of life. Nucleic Acids Res. 2015. 43(Database issue): D447–52. [DOI] [PMC free article] [PubMed] [Google Scholar]
- Tripathi S, Srivastava G, Sharma A. 2016. Molecular dynamics simulation and free energy landscape methods in probing L215H, L217R and L225M βI-tubulin mutations causing paclitaxel resistance in cancer cells. Biochem Biophys Res Commun. 476(4): 273–279. [DOI] [PubMed] [Google Scholar]
- Wang W, Zhang L, Wang Z, et al. 2016. A three-gene signature for prognosis in patients with MGMT promoter-methylated glioblastoma. Oncotarget. 7(43): 69991–69999. [DOI] [PMC free article] [PubMed] [Google Scholar]
- Wang Z, Bao Z, Yan W, et al. 2013. Isocitrate dehydrogenase 1 (IDH1) mutation-specific microRNA signature predicts favorable prognosis in glioblastoma patients with IDH1 wild type. J Exp Clin Cancer Res. 32(1): 59. [DOI] [PMC free article] [PubMed] [Google Scholar]
- Wang Y, Li Y, Sun J, et al. 2013. Tumor-suppressive effects of miR-29c on gliomas. Neuroreport. 24(12): 637–45. [DOI] [PubMed] [Google Scholar]
- Warner MD, Azmi IF, Kang S, Zhao Y, Bell SP. 0000-0002-2876-610X AO. Replication origin-flanking roadblocks reveal origin-licensing dynamics and altered sequence dependence. J Biol Chem. 2017. 292(52): 21417–21430. [DOI] [PMC free article] [PubMed] [Google Scholar]
- Wilson HE, Rhodes KK, Rodriguez D, et al. Human Breast Cancer Xenograft Model Implicates Peroxisome Proliferator-activated Receptor Signaling as Driver of Cancer-induced Muscle Fatigue. Clin Cancer Res. 2018. [DOI] [PMC free article] [PubMed] [Google Scholar]
- Wu WD, Yu KW, Zhong N, Xiao Y, She ZY. Roles and mechanisms of Kinesin-6 KIF20A in spindle organization during cell division. Eur J Cell Biol. 2018. [DOI] [PubMed] [Google Scholar]
- Zhao XAUID-Oho, Zhou LL, et al. Overexpression of KIF20A confers malignant phenotype of lung adenocarcinoma by promoting cell proliferation and inhibiting apoptosis. Cancer Med. 2018. 7(9): 4678–4689. [DOI] [PMC free article] [PubMed] [Google Scholar]


