

Abstract
Modeling of human motion is common in ergonomic analysis of industrial tasks and can help improve workplace design. We propose a method for modeling the trajectories of hand movements in the frontal plane during a sequential reach task that involves threading string through a system of pulleys. We model the motions as a combination of two consecutive phases, one where the hand is reaching between pulleys and another when the hand is engaged in threading a target pulley. Hand trajectories were modeled separately for each phase by fitting basis-splines to the observed data. Predicted trajectories were computed using task parameters as the input and compared to average trajectories from the 12 participants who completed the study.
INTRODUCTION
Sequential reach tasks are a common component of manual assembly jobs that involve handling continuous material, such as thread or wire. Sequential reaching involves reaching to multiple target locations in a particular sequence around a workplace. One example is routing thread through a system of pulleys and idlers, which occurs in textile manufacturing. The accurate prediction of worker posture and task completion time, using digital human modeling (DHM) tools, is valuable for improving the design of a workplace. However, DHM currently lack the capability of simulating tasks that require manipulating continuous material limiting the ability of engineers to design efficient processes.
Digital human modeling is a cost-effective method for improving the ergonomic aspect of workplace design (Chaffin, 2001). It is used to predict human movement and posture to assess visibility, reachability, and clearance issues across a diverse population of workers that vary in body dimensions. For example, in vehicle design, ergonomists use it to assess visibility of displays and reachability of controls from the driver’s perspective (Chaffin, 2001).
There are a variety of methods for predicting posture and human motion in dynamic tasks, some of which include inverse kinematics (Jung et al. 1995), differential inverse kinematics (Zhang & Chaffin, 2000), and optimization (Flash & Hogan, 1985). Digital human modeling software mostly uses inverse kinematics to calculate joint angles of adjacent joints given the end effector, or hand location.
In ergonomic analysis, a reach motion trajectory is important for determining pathway clearance and reachability of a target. Previous researchers have modeled arm reach postures to a target location that focus on predicting upper extremity joint angles throughout the reach movement given the initial arm posture and final hand position (Wang, 1999; Wang & Verriest, 1998). Another technique is using motion capture technology to track hand motion during a reach movement, and fitting basis-splines (b-splines) to the observed trajectories (Faraway, 2000; Faraway et al., 2007; Faraway & Reed, 2007). B-splines use control points to determine the shape of a curve. The degree of the fitted curve and number of control points determine goodness of fit to the observed trajectory. Statistical analysis is performed to make estimations on control point locations given a variety of input parameters (e.g. subject anthropometry, target location, and other task parameters).
In this paper, we applied this method for modeling hand trajectories in a sequential reach task with continuous material that involves threading string through a system of pulleys that vary in diameter, groove width, and location. Previous methods are limited to modeling trajectories in discrete reach movement tasks where the end of the reach movement has a distinct location. The sequential component of the task in this study presents a unique challenge because there are multiple phases of the task.
METHODS
The hand trajectory data used to develop the models came from a previous study that investigated the effect of pulley design characteristics on task completion time. We measured hand motion trajectories using motion capture technology in a sequential pulley threading task. Twelve right-handed participants (7 men and 5 women, 20-26 years), were enrolled in this study. They had no prior experience performing the type of activity conducted in the experiment. This experiment was approved by an Institutional Review Board at the University of Michigan.
Experiment Setup and Procedure
Haney et al. (2016) provides a detailed description of the experiment setup and procedure. The threading task was performed on a height-adjustable acrylic work surface oriented vertically so that the pulley axes were all horizontal and parallel (Figure 1). Pulleys were mounted on the perimeter of a semicircle with a radius of 46 cm at locations of 0°, 45°, 90°, 135°, and 180° relative to a constant origin pulley located at the center and normalized to the height of the participant’s elbow (Figure 2). Polyester thread (Coats & Clark, Dual Duty XP Heavy Thread) was pulled from a spool located on the right edge of the work surface. Fingertip location during the trial was estimated from the tracked 3D locations of a marker triad on the hand dorsum, relative to the global origin located at the origin pulley with the superior-inferior direction as the z-axis and the medial-lateral direction as the x-axis.
Figure 1.

Experiment apparatus and setup.
Figure 2.

Schematic depicting the location of origin and destination pulleys. Arrows depict the direction of threading for a CW condition during the experiment.
The sequential reach task consisted of threading 5 consecutive origin-destination pairs of pulleys in the sequence depicted in Figure 2, starting with θ1 = 180° and moving in a clockwise direction between origin-destination pairs until θ5 (= 0°) and returning back at the origin. Clockwise (CW) and counterclockwise (CCW) threading directions were investigated. For the CW condition, all destination pulleys were threaded in a CW direction and vice versa for the CCW condition.
Three pulley outer diameters (OD: 38-mm, 76-mm, and 152-mm) and GWs (GW: 3-mm, 6-mm, and 9-mm) were investigated. The origin pulley had a 30-mm OD and a 37-mm GW. Presentation of destination pulleys was counterbalanced to include every combination of OD x GW x target location x threading direction. Participants performed three repetitions for each task condition, and were given 6 practice trials prior to data collection.
Trajectory Modeling
The hand trajectories were segmented into a transition phase, where the hand is reaching between two consecutive pulleys, and a pulley interaction phase, where the hand is engaged in threading the target pulley (Figure 3). The start of the pulley interaction phase corresponded to the time point the trajectory first crossed a line that passes through the target pulley center and is perpendicular to the centerline between the target pulley and the previous pulley in the sequence. To determine the end of the pulley interaction phase, we calculated the derivative of the resultant distance between the trajectory and pulley edge. The end corresponded to the last instant this value changed from negative to positive within 200 mm of the pulley edge.
Figure 3.

Schematic of the b-spline curve
We used b-splines to model the 2-D hand trajectories in the frontal plane for the transition and pulley interaction phases separately. For the transition phase, trajectory coordinates were normalized to the inter-pulley distance (46 cm), and rotated about the anterior-posterior axis by the pulley location degree θ to correspond with the θ5 (= 0°) condition. For the pulley interaction phase, trajectory coordinates were normalized to the center of the target pulley, and also rotated to correspond with the θ5 condition.
B-splines were fit to the normalized 2-D observed trajectory. The fitted kth order curve C(u) is composed of a linear combination of control points P and basis functions f(u):
| (1) |
Basis functions are polynomials that are joined end-to-end by a set of interval boundaries, referred to as knots. The knot vector U consists of n + k + 1 nonperiodic knots that control the shape of the curve:
| (2) |
The repeated knots at the beginning and end of the knot vector forces the curve to pass through the endpoints of the observed data, in this case the start and end of the threading phases. The b-spline functions utilize the knot vector:
| (3) |
| (4) |
The coordinates of the fitted trajectory over time (K) are approximated by using linear least squares regression to find the set of n + 1 control points P:
| (5) |
Fourth order b-splines were fitted to each of the observed 2D trajectories. Control points were calculated across all segmented trials to obtain a set of 6 control points for the transition phase, PT, and 4 for the pulley interaction phase, PPI (Figure 3). The root mean square error (RMSE) of the resultant distance between the fitted b-splines and observed trajectory was calculated for each segmented trial.
Trajectory Prediction
A linear regression analysis was performed on PT and PPI. Twelve regression equations were constructed for the control points in the transition phase (i.e. one equation per control point dimension). The control points were regressed on the pulley OD and GW of the origin and target pulleys, the target pulley location (θ), the threading direction (0 for CW and 1 for CCW), and the two-way interaction between pulley location and threading direction. Likewise, 8 regression equations were constructed for the pulley interaction phase. These control points were regressed on the target pulley OD and GW, the target pulley location, the threading direction, and the two-way interaction between pulley location and threading direction. Statistical significance was set at an alpha level of p < 0.05.
For this conference paper, we predicted hand trajectory shape for three consecutive reach movement phases where the start corresponds to the beginning of the transition phase when reaching toward the target pulley and the end corresponds to the end of the transition phase when reaching toward the origin pulley (Figure 3). Therefore, we predicted three trajectories (transition phase, pulley interaction, and the return transition phase).
To combine the three predicted trajectories, the last control point for the first transition phase, PT1,5, was replaced with the first control point for the pulley interaction phase, PPI,0. This is necessary to assure the trajectories pass through the same point when transitioning between phases. Likewise, the first control point of the second transition phase, PT2,0, was replaced with the last control point of the pulley interaction phase, PPI,3. To assure the slopes of the trajectories at the transition points are the same, PT1,4 was moved to the nearest location that was collinear with PPI,0 and PPI,1, and PT2,1 was moved to the nearest location that was collinear with PPI,2 and PPI,3.
Trajectory predictions were compared to observed trajectories from the study participants. For this paper, the RMSE of the resultant distance between the predicted and observed data was calculated for a subset of the conditions, which included all pulley ODs and the 3-mm GW for the 0° pulley location and CW direction, and expressed as absolute distance in millimeters.
RESULTS
Figure 4 shows an example of the b-spline fitting process for a sample trajectory in the first transition phase. The open faced circles represent the control points for the fitted b-spline curve.
Figure 4.
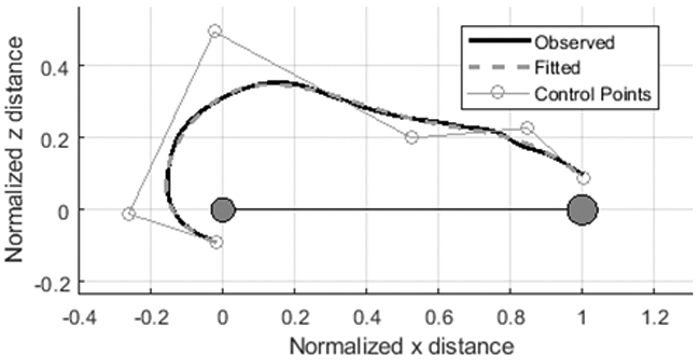
Example of a fitted b-spline curve to an observed trajectory for the first transition phase.
Table 1 presents the mean (± SD) RMSE of the fitted b-spline curves and the observed data for the three trajectory phases expressed in millimeters. In general, pulley OD and GW had a small effect on the RMSE of the fitted curves. In both the transition and pulley interaction phases, the RMSE values were less than 4 mm on average for all conditions shown.
Table 1.
Mean (±SD) RMSE of the resultant distance between the fitted b-spline curve and the observed trajectories for threading the 0° pulley in a CW direction.
| OD mm |
GW mm |
1st Transition |
Pulley Interaction |
2nd Transition |
|---|---|---|---|---|
| 38 | 3 | 2.66 ± 1.51 | 2.96 ± 3.23 | 2.69 ± 1.53 |
| 76 | 3 | 3.15 ± 2.34 | 3.43 ± 4.15 | 1.33 ± 0.71 |
| 152 | 3 | 2.75 ± 2.82 | 2.71 ± 4.93 | 1.70 ± 0.86 |
For the transition phase, the origin pulley OD and GW primarily only had a significant effect on the first 3 control points, and the target pulley OD primarily only had a significant effect on the final 3 control points. Whereas, the pulley location, threading direction, and their two-way interaction had a significant effect on all control points. In the pulley interaction phase, all predictors had a significant effect on the 4 control points, besides the main effect of threading direction which only affected the second and last control points.
Figure 5 shows the model prediction and the observed trajectories for the 0° pulley location, CW direction, 38-mm OD, and 3-mm GW from a sample participant for all three repetitions. The RMSE values for the three repetitions were 30.7 mm, 26.5 mm, and 17.7 mm, respectively. The first transition phase accounts for the majority of the error. This is mainly due to the lack of a precision requirement for the origin pulley. Participants were able to quickly thread this pulley, which led to an increase in the variability of the trajectory shape.
Figure 5.
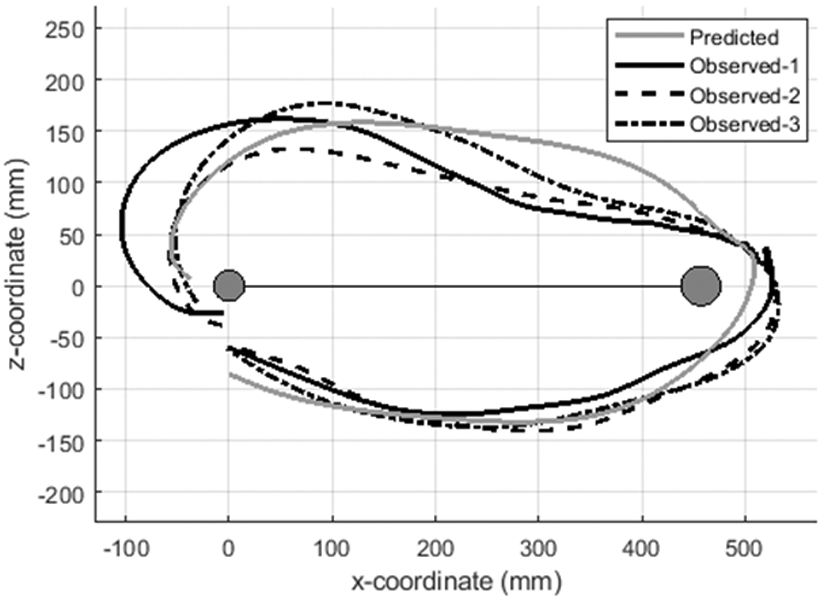
Example of a predicted trajectory vs. observed trajectories from an example participant, for the 0° pulley location, CW direction, 38-mm OD, and 3-mm GW.
Table 2 lists the mean (±SD) RMSE values (mm) of the resultant distance between the observed and predicted trajectories for a sample of the test conditions. The residual error was similar across GWs and pulley OD. The mean error was less than 50 mm for the conditions shown.
Table 2.
The mean (±SD) RMSE of the resultant distance between the predicted and observed trajectories for threading the 0° pulley in a CW direction.
| OD (mm) | GW (mm) | RMSE (mm) |
|---|---|---|
| 38 | 3 | 44.2 ± 21.1 |
| 76 | 3 | 45.4 ± 25.8 |
| 152 | 3 | 39.4 ± 29.3 |
DISCUSSION
This paper presents a method for modeling the end-effector kinematics for a sequential reach task with continuous material. The model successfully predicted trajectory shape based on the task parameters, accounting for an average of 7% of the variance in the control point locations for the transition phase and 10% for the pulley interaction phase. Though the model captured a small portion of the variance, errors between predicted and observed trajectories were relatively low. Little difference in shape error was observed between reaches to pulleys with different design parameters. The largest error in the predictions occurred at the beginning of the first transition phase, which had an increase in trajectory shape variability due to the origin pulley’s lack of precision requirement.
This work is a subset of a model we are developing to predict hand motions and upper body posture in sequential reach tasks with continuous material. One limitation of the presented model is that we are only predicting hand location, and not orientation. To make accurate and realistic simulations of these tasks, it is necessary to model adaptations in wrist posture during the threading task. For instance, in certain conditions due to line of sight availability or target precision, one might need to supinate or pronate their wrist to successfully complete the task. Additionally, this model is limited to only predicting trajectory shape and not the timing of the reach movements throughout the sequential task. Though target precision requirement has a small effect on trajectory shape, it has a large effect on speed and timing of a movement (Haney et al, 2016). Similar methodologies will be used to model the hand speed profile so we can predict the timing of the movement based on the task parameters.
The model has a number of limitations. First, in this study, the inter-pulley distance remained constant throughout the experiment. A shorter or longer inter-pulley distance could have an effect on the shape during the transition phase. Secondly, the origin pulley location and characteristics remained constant throughout the experiment (i.e. the origin pulley was always the next pulley in the sequence after threading the target destination pulley), and had a low precision requirement. This led to a high variability in trajectory shape when threading the origin pulley, which contributed to the increase in error at the start of the reach movements.
In summary, this paper presents a model of end-effector kinematics in a sequential reach movement using basis splines. This work has practical implications. Implementation in DHM software will assist in designing tasks that involve threading continuous material. Users will be able to evaluate how various pulley designs and arrangements will affect hand trajectory shapes and performance. The capability to perform accurate simulations will allow designers to make informed decisions about equipment design and placement.
ACKNOWLEDGMENTS
This work was supported by the partners of the Human Motion Simulation Laboratory at the University of Michigan, who include Fiat Chrysler Automobiles, Ford Motor Company, General Motors, and Proctor and Gamble, as well as by traineeship support (to JH) received through the training grant T42-OH008455 from the National Institute of Occupational Safety and Health.
REFERENCES
- Chaffin DB (2001). Digital human modeling for vehicle and workplace design. Warrendale, PA: Society of Automotive Engineers. [Google Scholar]
- Faraway JJ (2000). Modeling reach motions using functional regression analysis (No. 2000-01-2175). SAE Technical Paper. [Google Scholar]
- Faraway JJ & Reed MP (2007). Statistics for digital human motion modeling in ergonomics. Technometrics, 49(3), 277–290. [Google Scholar]
- Faraway JJ, Reed MP, & Wang J (2007). Modelling three-dimensional trajectories by using Bézier curves with application to hand motion. Journal of the Royal Statistical Society: Series C (Applied Statistics), 56(5), 571–585. [Google Scholar]
- Flash T, & Hogan N (1985). The coordination of arm movements: an experimentally confirmed mathematical model. Journal of neuroscience, 5(7), 1688–1703. [DOI] [PMC free article] [PubMed] [Google Scholar]
- Haney JM, Owczarczak M, D’Souza C, Jones ML, & Reed MP (2016, September). A Pilot Study of the Effects of Pulley Location and Design Parameters on Hand Movements during Pulley Threading Operations. In Proceedings of the HFES Annual Meeting (Vol. 60, No. 1, pp. 908–912). Sage CA: Los Angeles, CA: SAGE Publications. [DOI] [PMC free article] [PubMed] [Google Scholar]
- Jung ES, Kee D, & Chung MK (1995). Upper body reach posture prediction for ergonomic evaluation models. International Journal of Industrial Ergonomics, 16(2), 95–107. [Google Scholar]
- Wang X (1999). A behavior-based inverse kinematics algorithm to predict arm prehension postures for computer-aided ergonomic evaluation. Journal of biomechanics, 32(5), 453–460. [DOI] [PubMed] [Google Scholar]
- Wang X, & Verriest JP (1998). A geometric algorithm to predict the arm reach posture for computer-aided ergonomic evaluation. The journal of visualization and computer animation, 9(1), 33–47. [Google Scholar]
- Zhang X, & Chaffin D (2000). A three-dimensional dynamic posture prediction model for in-vehicle seated reaching movements: development and validation. Ergonomics, 43(9), 1314–1330. [DOI] [PubMed] [Google Scholar]