

Abstract
Ginkgo biloba has been used for many thousand years as a traditional herbal remedy and its extract has been consumed for many decades as a dietary supplement. Ginkgo biloba leaf extract is a complex mixture with many constituents, including flavonol glycosides and terpene lactones. The National Toxicology Program 2-year cancer bioassay found that G. biloba leaf extract targets the liver, thyroid gland, and nose of rodents; however, the mechanism of G. biloba leaf extract-associated carcinogenicity remains unclear. In the current study, the in vitro genotoxicity of G. biloba leaf extract and its eight constituents was evaluated using the mouse lymphoma assay (MLA) and Comet assay. The underlying mechanisms of G. biloba leaf extract-associated genotoxicity were explored. Ginkgo biloba leaf extract, quercetin, and kaempferol resulted in a dose-dependent increase in the mutant frequency and DNA double-strand breaks (DSBs). Western blot analysis confirmed that G. biloba leaf extract, quercetin, and kaempferol activated the DNA damage signaling pathway with increased expression of γ-H2AX and phosphorylated Chk2 and Chk1. In addition, G. biloba leaf extract produced reactive oxygen species and decreased glutathione levels in L5178Y cells. Loss of heterozygosity analysis of mutants indicated that G. biloba leaf extract, quercetin, and kaempferol treatments resulted in extensive chromosomal damage. These results indicate that G. biloba leaf extract and its two constituents, quercetin and kaempferol, are mutagenic to the mouse L5178Y cells and induce DSBs. Quercetin and kaempferol likely are major contributors to G. biloba leaf extract-induced genotoxicity.
Keywords: Ginkgo biloba leaf extract, genotoxicity, quercetin, kaempferol, quercetin 3-β-d-glucoside, DNA damage, oxidative stress
Ginkgo biloba (ginkgo) is one of the world’s oldest living tree species. It is a unique tree with no close living relatives. The ginkgo tree has become popular as an ornamental tree and has been cultivated around the world (Chan et al., 2007). Ginkgo seeds have been used as a source of traditional Chinese medicine for many thousand years for cough, asthma, enuresis, alcohol misuse, pyogenic skin infections, and intestinal tract worm infections (van Beek and Montoro, 2009). The seeds have been occasionally cooked in Chinese and Japanese cuisines. Ginkgo leaves have also been used to treat memory loss and cognitive disorders, arrhythmias and ischemic heart disease, cancer, diabetes, and thromboses (EGb, 2003). Extracts of ginkgo leaves in various forms can be purchased in many countries as a dietary supplement. Ginkgo biloba is one of the most widely sold products in herbal supplement sales in the United States (Lindstrom et al., 2013), with a total sales of $94 million in 2012 (NBJ, 2013).
Ginkgo biloba leaves contain numerous chemical constituents; the flavonol glycosides and terpene lactones are the two major classes of components that are purportedly associated with the reported therapeutic effects (van Beek and Montoro, 2009). Within the class of terpene lactones, ginkgolide A, ginkgolide B, ginkgolide C, bilobalide, and other ginkgolides have been identified in G. biloba leaves. The flavonol glycosides, most prevalent in G. biloba leaves and extracts, are quercetin, quercetin 3-β-d-glucoside, quercitrin, kaempferol, isorhamnetin, and rutin (Ding et al., 2006b; van Beek and Montoro, 2009). The flavonol glycosides and terpene lactones are easily released from extract products and 75% of both components are dissolved in 0.1M HCl dissolution medium within 30 min (Kressmann et al., 2002b). When humans take pills, tablets, or capsules of G. biloba leaf extract, the peak concentration of terpene lactones in plasma is about 2 h (Kressmann et al., 2002a). Ginkgolide A, ginkgolide B, and bilobalide are excreted in the urine in their original form at relatively high concentrations, whereas ginkgolide C, quercitrin, kaempferol, and isorhamnetin are metabolized to different forms and can be detected in the urine at far lower concentrations than the ingested amount (Ding et al., 2006a). Although G. biloba leaf extract and some of its components have shown anticancer activities, cardioprotective effects, and neuroprotection against neurovascular insults (Mahadevan and Park, 2008), data on the toxic effects of G. biloba including genotoxicity and carcinogenicity have also been reported.
Recently, the National Toxicology Program (NTP) Technical Report on 2-year gavage studies concluded that there was clear evidence of carcinogenic activity of G. biloba leaf extract in mice based on an increased incidence of hepatocellular carcinoma and hepatoblastoma. There was also some evidence of carcinogenic activity in rats based on an increased incidence of thyroid gland follicular cell adenoma (NTP, 2013; Rider et al., 2013). In a previous study, using the liver tissues from the NTP 2-year treated mice, we observed in a gene expression profiling study that the top network response to G. biloba treatment was the Myc-centered network, with the functions related to cell cycle, cellular movement, and cancer (Guo et al., 2010). Overexpression of Myc has been frequently observed in tumors and is an early and critical event in the pathogenesis of hepatocellular carcinoma (Pelengaris et al., 2002).
In bacterial gene mutation assays, G. biloba leaf extract at concentrations of 1–10 mg/plate was reported to be mutagenic in Salmonella typhimurium strains TA98 and TA100, and in Escherichia coli strain WP2 uvrA/pKM101 both with and without metabolic activation, indicating the induction of frame shift and base substitution mutations (NTP, 2013). So far, only a few studies have investigated the genotoxicity of G. biloba leaf extract in mammalian cells. The mutagenic and/or clastogenic activities induced by two of its constituents, quercetin and kaempferol, were previously reported using the Ames test (Resende et al., 2012), the mouse lymphoma gene mutation assay (MLA) (Meltz and MacGregor, 1981), micronucleus assay in human lymphocytes and Chinese hamster lung cells (Caria et al., 1995), and chromosomal aberration in Chinese hamster ovary cells (Carver et al., 1983). It is of great interest to investigate the potential mechanisms of genotoxicity and carcinogenicity of G. biloba leaf extract.
In the present study, we employed two in vitro genotoxicity assays, the MLA and the Comet assay using L5178Y cells, to evaluate the genotoxicity of G. biloba leaf extract and its eight components, including quercetin, quercetin-3-β-d-glucoside, kaempferol, isorhamnetin, ginkgolide A, ginkgolide B, ginkgolide C, and bilobalide. The underlying mechanism of G. biloba associated genotoxicity was explored by analyzing loss of heterozygosity (LOH) in Tk mutants using five microsatellite markers spanning mouse chromosome 11, investigating the DNA damage signaling pathways using Western blot analysis, determining the oxidative stress using measurements of intracellular reactive oxygen species (ROS) levels and the glutathione (GSH) levels.
MATERIALS AND METHODS
Chemicals and Reagents
Ginkgo biloba leaf extract (lot GBE-50-001003, a tan powdered solid) was obtained from Dr Po Chan at the National Institute of Environmental Health Sciences (Research Triangle Park, NC). The details for the characterization methodology and major components analysis are detailed in the NTP Technical Report 578 and this extract is comparable in nature to standardized extract EGB 761 that was widely distributed in commerce (NTP, 2013). The same batch of material (lot GBE-50-001003) was originally procured from Shanghai Xing Ling Science and Technology Pharmaceutical Co. (Shanghai, China), and used for the NTP study (the part of methods development) (NTP, 2013; Rider et al., 2013). The chemical characterization and quality control were conducted by the analytical chemistry laboratory at Midwest Research Institute (Kansas City, MO), and the identity of the test article of the same lot was confirmed by Battelle Columbus Operations (Columbus, OH; NTP, 2013).
Eight constituents of G. biloba leaf extract, quercetin, quercetin-3-β-d-glucoside, kaempferol, isorhamnetin, ginkgolide A, ginkgolide B, ginkgolide C, and bilobalide were purchased from Sigma (St. Louis, MO) or LKT Laboratories (St. Paul, MN). Dimethyl sulfoxide (DMSO), trifluorothymidine (TFT), benzo(a)pyrene, 4-nitroquinoline-N-oxide (4-NQO) were also obtained from Sigma. Fisher’s medium for leukemic cells of mice was purchased from Quality Biological Inc. (Gaithersburg, MD) and all other cell culture supplies were obtained from Life Technologies Corporation (Carlsbad, CA). PCR Master Mix was purchased from Promega (Madison, WI). The primers used for LOH analysis at the Tk1 locus and the D11Mit20, D11Mit36, D11Mit42, and D11Mit74 loci were synthesized by Life Technologies. The cell-permeant 2’,7’-dichlorodihydrofluorescein diacetate (H2DCF-DA) was obtained from Life Technologies.
Cell Culture and Treatments
The L5178Y/Tk+/--3.7.2C mouse lymphoma cell line was utilized for detecting mutagenicity at the Tk locus and primary DNA damage using the Comet assay. Cells were grown according to the methods described in our previous studies (Mei et al., 2005, 2010). The growth medium was Fischer’s medium for leukemic cells of mice supplemented with 10% heat-inactivated horse serum, 0.1% pluronic F-68, 1mM sodium pyruvate, penicillin (100 units/ml), streptomycin (100 μg/ml). The treatment medium (F5p) and cloning medium (F20p) were different from the growth medium (F10p) in their percentage of heat-inactivated horse serum (5 and 20%, respectively). Cultures were maintained at 37°C in a humidified incubator with 5% (vol/vol) CO2 in air.
For the treatment of L5178Y cells, a working solution (100×) of G. biloba leaf extract or the eight constituents was made by dissolving in DMSO. All test solutions were prepared just before use by a series of dilutions using DMSO. The cells (6 × 10⁶) were suspended in 50 ml centrifuge tubes containing 10 ml of treatment media (F5p). The cultures were treated with different concentrations by adding 100 μl of the working solutions of G. biloba leaf extract or the eight constituents. Treatments were conducted in the presence and/or absence of metabolic activation (S9), gassed with 5% CO2 in air, and placed on a roller drum (15 rpm) at 37°C in an incubator for 4 h. Positive controls were 0.3 μg/ml benzo(a)pyrene with S9 and 0.1 μg/ml 4-NQO without S9. After a 4-h treatment, the cells were centrifuged and washed twice with fresh medium, and then were resuspended in 20 ml growth medium. The cultures were placed on a roller drum (15 rpm) in a 37°C incubator to initiate the 2-day phenotypic expression and subsequent mutant selection.
The cultures used for the Comet assay were counted after the treatment to estimate the cell viability (cytotoxicity). Cell counts were conducted using 0.4% trypan blue (Life Technologies) and a Countess automated cell counter (Life Technologies).
S9 Mix Preparation
The S9 fraction prepared from the livers of male Sprague Dawley rats induced by Aroclor 1254 (Moltox, Boone, NC) was mixed with a nicotinamide adenine dinucleotide phosphate (NADPH)-generating system. The S9 mix was supplemented with glucose-6-phosphate (180 mg/ml), NADP+ (25 mg/ml), KCl (150mM), and rat liver S9 at the ratio 1:1:1:2. Total 250 μl of S9 mix were added to 10 ml of treatment medium. The final concentration of S9 in the treatment medium was 1% (0.38 mg S9 protein/ml).
Tk Gene Mutation Assay
Mutant selection using the microwell method was performed as described previously (Mei et al., 2005). During the 2-day expression period, all cultures were counted at 24 and 48 h post treatment. TFT (3 μg/ml) was added into cultures in cloning medium for mutant enumeration, and cells were seeded into four 96-well flat-bottom plates using 200 μl of cell culture in each well with a final density of 2000 cells/well. For measuring the plating efficiency, the cultures were adjusted to 8 cells/ml medium (without TFT) and then aliquoted in 200 μl per well into two 96-well plates. The plates were incubated at 37°C with 5% CO2 in air. Following 11 days of incubation, the colonies in all plates were counted visually, and mutant colonies in TFT-selection plates were categorized as small colony (SC) or large colony (LC). SC mutants are defined as those smaller than a 25% of the diameter of the well, whereas LC mutants are more than a quarter of the diameter of the well. Mutant frequencies (MFs) were calculated using the Poisson distribution (Mei et al., 2014). Cytotoxicity was measured using relative total growth (RTG), which includes measurements of treated cell growth relative to the negative control during the treatment (4-h), expression (2-day), and cloning (11-day) phases of the assay.
Comet Assay
The Comet assay was performed according to established methods (Ostling and Johanson, 1984; Singh et al., 1988) with slight modifications. L5178Y cells were treated with different concentrations of G. biloba leaf extract or its eight constituents for 4 h. After treatment, the cells were washed with cold PBS, then resuspensed in cold PBS to form single cell suspensions with a cell density of 1 × 10⁵/ml. Fifty-microliter of cell suspensions was mixed with 450 μl of 0.5% molten low melting point agarose (LMPA) (0.5 g in 100 ml PBS) at 37°C in a 1.5-ml microtube for each sample, and 50 μl of this mixture was rapidly transferred onto the surface of a 2-well CometSlide (Trevigin Inc., Gaithersburg, MD). The slides were placed on a microscope slide tray at 4°C. After the gel was set, the slides were immersed in a Coplin jar with prechilled lysis solution at 4°C for 30 min. The slides were gently transferred into a container with prechilled Tris-Borate-EDTA (TBE) buffer or freshly made alkaline solution (300mM NaOH, 1mM EDTA, pH > 13) for 30 min at 4°C in the dark to unwind the DNA. After the DNA unwinding, the slides were electrophoresed using CometAssay ES at 21 V. The slides were washed with dH2O or neutralizing buffer (0.4M Tris, adjusted to pH 7.5 with HCl) three times for 5 min each, then were immersed into 70% ethanol for 5 min, and dried at room temperature. Before scoring, the slides were stained with 100 μl of a SYBR Gold working solution (Life technologies) diluted 1:10,000 with TE buffer. A total of 100 cells per sample (50 cells from each duplicate slide) were scored and the data were pooled together. The slides were scored using an imaging analysis system consisting of a Nikon 501 fluorescent microscope (Nikon Instruments Inc., Melville, NY) and CometAssay IV digital analysis system (Perceptive Instruments Ltd., Bury St. Edmunds, UK). The percentage of DNA in the tail was used as the parameter for the evaluation of DNA damage.
Western Blot Analysis
After the 4-h treatment, L5178Y cells treated with G. biloba leaf extract (0.4–1.2 mg/ml), quercetin (10–100μM), or kaempferol (10–200μM) were obtained from the cultures used for the Comet assay. The cells were centrifuged and washed twice, solubilized with radio immuno precipitation assay (RIPA) lysis buffer (150mM NaCl, 1.0% NP-40, 0.5% DOC, 0.1% SDS, and 50mM Tris-HCl with pH 8.0), and boiled for 5 min at 95°C. The protein concentration of the cell lysate was determined using a Pierce BCA protein assay kit (Thermo Fisher Scientific Inc., Waltham, MA). Equal amounts of protein lysate (40 μg) were loaded and separated on in 8–20% SDS-PAGE, and then transferred onto PVDF membranes (Millipore Corporation, Billerica, MA). The primary antibodies were antiphospho-Chk1 (Ser345), antiphospho-Chk2 (Thr68), anti-phospho-ATM (Ser1981), anti-phospho-ATR (Ser428), anti-γ-H2AX (Ser139) (Cell Signaling Technology, Inc., Danvers, MA), and anti-β-actin (internal control, Santa Cruz Biotechnology, Santa Cruz, CA). All primary antibodies were used at 1:1000 dilution, except anti-β-actin which was used at a 1:10,000 dilution. The secondary antibody with a goat antimouse or antirabbit monoclonal IgG, conjugated with horseradish peroxidise (HRP), was purchased from Santa Cruz.
Measurement of ROS levels
H2DCF-DA staining was used to measure the intracellular ROS production. For each concentration of G. biloba leaf extract or its six constituents (quercetin, kaempferol, ginkgolide A, ginkgolide B, ginkgolide C, and bilobalide), 6 × 10⁵ L5178Y cells/ml were suspended in 50 ml RPMI-1640 medium (phenol free) containing 10μM H2DCF-DA and placed in a 37°C incubator with 5% CO2 in air for 30 min (in the dark). Then the cells were washed to remove unincorporated H2DCF-DA by centrifugation with fresh medium. Subsequently, the cells were treated with different concentrations of G. biloba leaf extract (0.2–1.2 mg/ml), quercetin (10–100μΜ), or kaempferol (10–200μM) in 1.5-ml microtubes. Hydrogen peroxide (H2O2) served as a positive control in the assay. The treated cells were immediately transferred into 96-well plates with a concentration of 6 × 10⁵ cells/well (eight wells per concentration). The plates were incubated at 37°C with 5% CO2 and the fluorescence intensity for each well was measured at 10 min, 0.5, 1, 2, 3, 4, 6, and 24 h using a fluorescence reader (Biotek Instrument, Winooski, VT) with wavelengths of 485 nm excitation and 530 nm emission.
Measurement of GSH levels
Cell viability and intracellular GSH levels were measured immediately after the 4-h treatments with G. biloba leaf extract (0.2–1.2 mg/ml), quercetin (10–100μM), kaempferol (10– 200μM), and four terpene lactones. Cell viability was measured using 0.4% trypan blue dye exclusion and a Countess automated cell counter. Cellular GSH and GSSG levels were measured according to the GSH/GSSG-Glo assay kit instructions (Promega). After a 4-h treatment, the cells were harvested by centrifugation and resuspended in PBS. A total of 1 × 10⁴ cells in 50 μl of PBS were dispensed into 96-well white, opaque polystyrene flat-bottom plates (four wells per concentration), and then 50 μl freshly prepared Luciferin Generation Reagent was added into each well following 25 μl/well freshly prepared Total Glutathione Lysis Reagent/or Oxidized Glutathione Lysis Reagent. After a 30-min incubation at room temperature, 100 μl of Luciferin Detection Reagent was added into each well and the plates were incubated at room temperature for another 15 min. Luminescence was read with a microplate reader (Biotek Instrument, Winooski, VT).
LOH Analysis of Tk Mutants
LOH analysis was conducted using a microsatellite maker within the Tk locus and four other microsatellite loci (D11Mit42, D11Mit36, D11Mit20, and D11Mit74) spanning the entire chromosome 11. Mutant cells were directly taken from TFT-selection plates after the 11-day incubation. Forty eight LC mutants and 48 SC mutants were isolated from TFT-selection plates from cultures treated with the highest concentration of G. biloba leaf extract (1.2 mg/ml), quercetin (100μM), or kaempferol (200μM). The mutant cells were centrifuged and washed once with PBS. Cell pellets were quickly frozen and stored at –20°C. The procedures for genomic DNA extraction, PCR analysis, and agarose gel electrophoresis were performed as previously described (Guo et al., 2011). The amplification products were evaluated for the presence of one band (indicating LOH) or two bands (retention of heterozygosity at the given locus) after 2% agarose gel electrophoresis with 1% ethidium bromide and visualization by UVA photography.
Data analysis
Data were presented as the mean ± 1 standard deviation from at least three independent experiments. For the thymidine kinase gene mutation assays, the data evaluation criteria developed by the MLA Expert Workgroup of the International Workgroup for Genotoxicity Tests (IWGT) were used to determine whether or not a response is positive or negative (Moore et al., 2006). Positive responses in the microwell version of the MLA are defined as those where the induced mutant frequency (MF) in one or more treated cultures exceeds the global evaluation factor (GEF) of 126 mutants per 106 cells and there is also a dose related increase with MF. LOH patterns of mutants were compared using the computer program described previously (Mei et al., 2005, 2006). For all other endpoints, analyses were performed using SigmaPlot 11.0 (Systat Software Inc., San Jose, CA). Statistical significance was assessed with one-way analysis of variance (ANOVA), followed by Dunnett’s tests for pairwise comparisons to the control.
RESULTS
Cytotoxicity and Mutagenicity of Ginkgo biloba Leaf Extract and its Eight Constituents in the MLA
Figure 1 shows the relative total growth (RTG) values and Tk mutant frequency (MF) from four independent MLA experiments where cells were treated with G. biloba leaf extract (0.2–1.2 mg/ml) in the absence of metabolic activation (S9). Both cytotoxicity and mutagenicity showed dose-dependent increases. The mean induced MF (by subtracting the background MF from total MF of the treated culture) at concentrations of 1.0 and 1.2 mg/ml of G. biloba leaf extract were 167 × 10−6 and 499 × 10−6, respectively. Both MFs exceeded the GEF of 126 × 10−6 (Moore et al., 2006), indicating a positive mutagenic response. We also examined eight constituents of G. biloba leaf extract in the MLA (Table 1). Under the concentration ranges that we tested, isorhamnetin, ginkgolide A, ginkgolide B, ginkgolide C, and bilobalide gave negative responses both in the absence and presence of S9. In contrast, quercetin (≥30μM), kaempferol (≥50μM), and quercetin 3-β-d-glucoside (≥400μM) increased the MF over that of the vehicle control in the absence of S9 resulting in clear positive mutagenic responses (Table 1). The RTG, Tk MF, percentage of small colonies from one representative MLA experiment with treatment of G. biloba leaf extract and eight constituents in the absence of metabolic activation are presented in Supplementary table 1.
FIG. 1.

Cytotoxicity (relative total growth) and mutagenicity (mutant frequency) of Ginkgo biloba leaf extract in L5178Y cells in the absence of metabolic activation. Data points present the mean ± 1 standard deviation from four independent experiments. * indicates the positive mutagenic response by the induced mutant frequency exceeding the global evaluation factor (GEF) of 126 × 10−6 when compared with the control.
TABLE 1.
Mutagenicity in L5178Y Cells Exposed to Eight Constituents of Ginkgo biloba Leaf Extract in the Absence or Presence of Metabolic Activation
| Chemical | Concentration (μM) | S9 | Mutagenicitya |
|---|---|---|---|
| Quercetin | 10–100 | − | Positive (≥30μM) |
| Kaempferol | 10–200 | − | Positive (≥50μM) |
| Quercetin 3-β-d-glucoside | 200–1000 | − | Positive (≥400μM) |
| Isorhamnetin | 100–1000 | − | Negative |
| 30–1000 | + | ||
| Bilobalide | 10–2000 | − | Negative |
| 50–3000 | + | ||
| Ginkgolide A | 2000–7000 | − | Negative |
| 250–3000 | + | ||
| Ginkgolide B | 500–8000 | − | Negative |
| 25–1000 | + | ||
| Ginkgolide C | 30–2000 | − | Negative |
| 30–1000 | + |
Positive mutagenic response means the induced mutant frequency exceeding the global evaluation factor (GEF) of 126×10−6 when compared with the concurrent control. Data are measured from three or four independent experiments.
DNA Double-Strand Breaks Induced by Ginkgo biloba Leaf Extract and its Eight Constituents
Assessment of double-strand breaks (DSBs) was carried out using the neutral Comet assay and the same treatment procedure as that for MLA. Prior to the performance of the Comet assay, cell viability was determined using 0.4% trypan blue dye exclusion and no significant toxicities were observed after 4-h treatments with >75% cell viability in each treatment group (data not shown). The treatments with G. biloba leaf extract, quercetin, or kaempferol resulted in a dose-dependent increase in the percentage of tail DNA intensity (Fig. 2). Significant DNA damage was observed with 1.0 mg/ml G. biloba leaf extract showing about 26% DNA in the tail (Fig. 2A), 30μM quercetin and 50μM kaempferol having about 34 and 18% tail DNA intensity, respectively (Fig. 2B), whereas only 3–4% DNA in the tail appeared with the concurrent vehicle controls. We also conducted an analysis for the other six constituents (Supplementary fig. 1). With the concentrations tested, five constituents had negative responses, Quercetin-3-β-d-glucoside at a concentration of 600μM showed a 2-fold higher DNA damage than the negative control.
FIG. 2.

DNA damage in L5178Y cells treated with Ginkgo biloba leaf extract (A), quercetin, and kaempferol (B) using the neutral Comet assay. Data points present the mean ± 1 standard deviation as the percentage of DNA in tail measured from at least three independent experiments. * indicates significant difference versus concurrent vehicle control (p < 0.05).
Activation of the DNA Damage Signaling Pathway after Ginkgo biloba Leaf Extract, Quercetin, or Kaempferol Treatments
To support the observations from the Comet assay results that G. biloba leaf extract, quercetin, and kaempferol induce DNA DSBs, we investigated the activation of DNA damage signaling pathways using Western blot analysis (Fig. 3). Ginkgo biloba leaf extract and quercetin treatments increased the level of the activated ATM and consequently activated Chk2 and Chk1 (Fig. 3). Furthermore, the level of phosphorylated H2AX (γ-H2AX) was increased in a dose-response manner. Similarly, kaempferol increased the levels of phosphorylated Chk2 and Chk1 as well as γ-H2AX, but activated ATM was not detectable (Fig. 3). Ginkgo biloba leaf extract, quercetin, or kaempferol treatments did not change the expression of the phosphorylated ATR.
FIG. 3.

Western blot analysis of protein expressions in L5178Y cells after exposure to Ginkgo biloba leaf extract (0.4—1.2 mg/ml), quercetin (10–100μM), and kaempferol (10–200μM). Total cellular protein was extracted after 4-h treatment. The levels of different proteins in response to DNA damage were detected by Western blot analysis. β-actin was used as a loading control. Similar results were obtained from at least three independent experiments.
Intracellular ROS Levels after Ginkgo biloba Leaf Extract, Quercetin, or Kaempferol Treatment
To explore whether G. biloba leaf extract-induced genotoxicity is associated with oxidative stress, the intracellular ROS production was measured in L5178Y cells exposed to G. biloba leaf extract, quercetin, or kaempferol for various length of time from 10 min to 6 and 24 h. The intracellular ROS levels with G. biloba leaf extract treatments (0.2–1.2 mg/ml) were increased starting at 0.4 mg/ml and treatments ranging from 3 to 24 h (Fig. 4A). The positive control (100μM H2O2 treatment) had an 8.5-fold increase compared with the negative control at 2 h of treatment (data not shown). Quercetin (10–100μM) treatments decreased the intracellular ROS levels at all concentrations after 30-min treatment (Fig. 4B). Kaempferol at concentrations of 50μM and above transiently increased the intracellular ROS levels but only at the 10 min treatment. Longer treatments (an additional 20 min and more) decreased the ROS level, even lower than that of the negative control (Fig. 4C). We also measured the ROS level after treatments with four terpene lactones (Supplementary fig. 2). The treatments with ginkgolide A, ginkgolide B, and ginkgolide C slightly decreased the ROS level, whereas 1 and 2mM bilobalide increased the ROS level during 2–4-h treatments.
FIG. 4.

Measurement of reactive oxygen species (ROS) in L5178Y cells treated with Ginkgo biloba leaf extract (A), quercetin (B), and kaempferol (C). L5178Y cells were treated with different concentrations of G. biloba leaf extract (0.2—1.2 mg/ml), quercetin (10–100μM), and kaempferol (10–200μM). The ROS values were measured at 10 min, 0.5–6 h, and 24 h after adding the chemicals. Data are presented as mean ± 1 standard deviation measured from at least three independent experiments with four parallel samples per concentration in each experiment.
Intracellular GSH Levels after Ginkgo biloba Leaf Extract, Quercetin, or Kaempferol Treatment
GSH is a tripeptide whose major role is to maintain the intracellular redox balance and to eliminate ROS toxicity. Intracellular GSH and GSSG production were measured in the L5178Y cells after 4-h treatment with G. biloba leaf extract, quercetin, or kaempferol (Fig. 5). The intracellular GSH/GSSG ratio at concentrations of 0.4–1.2 mg/ml G. biloba leaf extract was dramatically decreased (from 41.4 to 2.8). The GSH/GSSG ratios after quercetin and kaempferol 4-h treatments were slightly increased when compared with that of the vehicle control. In addition, we determined the intracellular GSH level after treatments with four terpene lactones (Supplementary fig. 3). Ginkgolide B (5mM) decreased the GSH level by 20% when compared with the control, whereas ginkgolide A, ginkgolide B, and bilobalide showed a little decrease (< 10%).
FIG. 5.
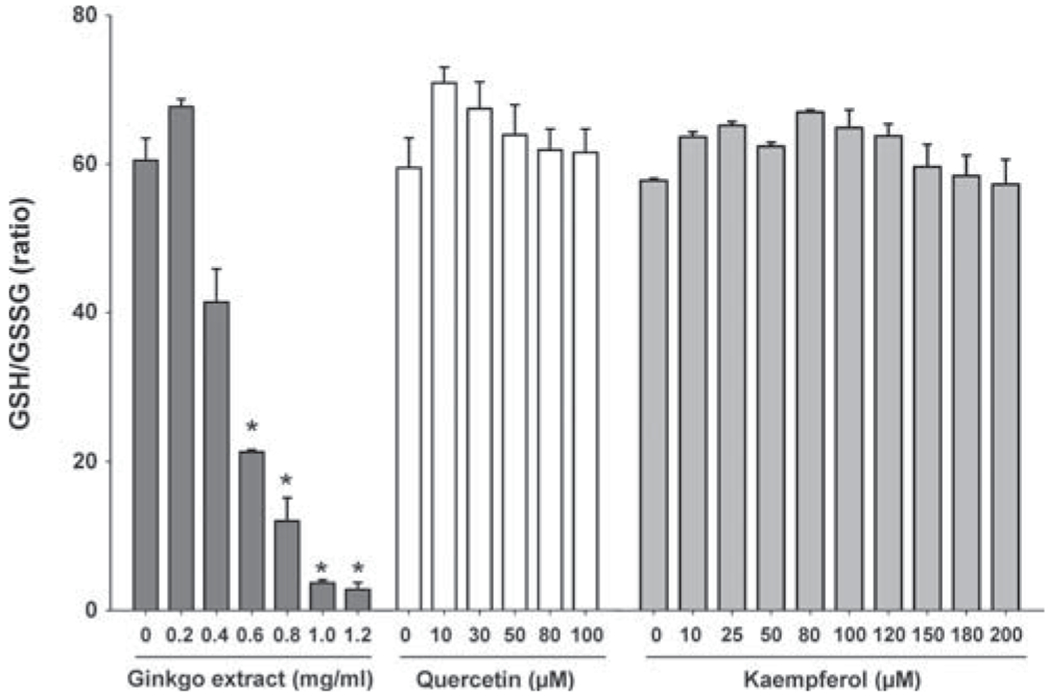
Measurement of GSH levels in L5178Y cells treated with Ginkgo biloba leaf extract, quercetin, and kaempferol. L5178Y cells were treated with different concentrations of G. biloba leaf extract (0.2—1.2 mg/ml), quercetin (10–100μM), and kaempferol (10–200μM) for 4 h. Data are presented as mean ± 1 standard deviation measured from three independent experiments with four parallel samples per concentration in each experiment.
LOH Analysis of the Tk Mutants Induced by Ginkgo biloba Leaf Extract and its Two Constituents
LOH analysis of the Tk mutants was conducted using five polymorphic microsatellite markers, including a marker within the Tk locus, D11Mit42, D11Mit36, D11Mit20, and D11Mit74. These microsatellite markers are distributed along the full length of mouse chromosome 11. DNA was isolated from 93 mutants (48 LC and 45 SC) from the 1.2 mg/ml G. biloba leaf extract treatment; 96 mutants (48 LC and 48 SC) from the 100μM quercetin treatment; and 94 mutants (48 LC and 46 SC) from the 200μM kaempferol treatment (Table 2). All of the SC mutants analyzed showed loss of heterozygosity at the Tk locus. The LC mutants from the treatment with G. biloba leaf extract, quercetin, or kaempferol showed Tk LOH in 44 of 48 (91.7%), 45 of 48 (93.8%), and 45 of 48 (93.8%), respectively. When compared with the spontaneous mutant spectrum from 36 LC and 33 SC previously reported in our lab (Wang et al., 2007), the mutational spectra induced by G. biloba leaf extract, quercetin, and kaempferol were all significantly different from those of the vehicle control (p < 0.0001). Ginkgo biloba leaf extract (1.2 mg/ml) induced primarily mutants with chromosomal damage <34 Mbp (from the Tk locus to D11Mit42). Quercetin (100μM) treatment resulted in more mutants with damage ranging from the Tk locus to D11Mit42, the Tk locus to D11Mit20, and the Tk locus to D11Mit74. Kaempferol (200μM) treatment induced more mutants from the Tk locus to D11Mit36 and D11Mit74 (Fig. 6).
TABLE 2.
Tk Mutants Analysis from L5178Y Cells Exposed to Ginkgo biloba Leaf Extract, Quercetin, and Kaempferol for the Loss of Heterozygosity (LOH) at Five Loci Along the Chromosome 11
| Microsatellites | Locationa (Mbp(cM)) | No. of large colony mutants (%) |
No. of small colony mutants (%) |
||||||
|---|---|---|---|---|---|---|---|---|---|
| Controlc | GBE | Que | Kae | Controlc | GBE | Que | Kae | ||
| Non-LOHb | 21 (58.3) | 4 (8.3) | 3 (6.3) | 3 (6.3) | 1 (3.0) | 0 (0) | 0 (0) | 0 (0) | |
| Tk | 117.8 (82.96) | 15 (41.7) | 44 (91.7) | 45 (93.8) | 45 (93.8) | 32 (97.0) | 45 (100) | 48 (100) | 46 (100) |
| D11Mit42 | 113.1 (78.7) | 12(33.3) | 32 (66.7) | 41 (85.4) | 44 (91.7) | 29 (87.9) | 38 (84.4) | 37 (77.1) | 40 (87.0) |
| D11Mit36 | 83.8 (51.23) | 11 (30.6) | 16 (33.3) | 40 (83.3) | 36 (75.0) | 16 (48.5) | 13 (28.9) | 17 (35.4) | 18 (39.1) |
| D11Mit20 | 44.7 (27.23) | 5 (13.9) | 11 (22.9) | 19 (39.6) | 36 (75.0) | 13 (39.4) | 4 (8.9) | 13 (27.1) | 11 (23.9) |
| D11Mit74 | 5.3 (3.52) | 5 (13.9) | 10 (20.8) | 18 (37.5) | 22 (45.8) | 9 (27.3) | 3 (6.7) | 12 (25.0) | 11 (23.9) |
| Mutants screened | 36 | 48 | 48 | 48 | 33 | 45 | 48 | 46 | |
Note. GBE: Ginkgo biloba leaf extract; Que: quercetin; Kae: kaempferol.
Locus locations on chromosome 11 according to the database (Jackson Laboratory, Bar Harbor, ME, http://www.informatics.jax.org).
Retain heterozygosity.
Data from the untreated control from Wang et al. (2007).
FIG. 6.

Comparison of the percentage of mutational types for all (large and small) colonies produced in L5178Y cells treated with Ginkgo biloba leaf extract, quercetin, and kaempferol. The mutants were collected from the MLA conducted with top concentrations of G. biloba extract (1.2 mg/ml), quercetin (100μM), and kaempferol (200μM). The data for vehicle control is from our previous study (Wang et al., 2007). Data points are weighted sum of mutant percentages from large and small colony mutants (the proportion of small colony mutants for G. biloba leaf extract, quercetin, and kaempferol was 50, 48, and 62%, respectively).
DISCUSSION
There are many commercial products containing G. biloba leaf extract and as with many natural products they can vary in chemical analysis depending on many factors, e.g., strain, climate, growth phase, processing, etc. Several initiatives have been made to establish standardized preparative procedures, analysis, and content of these products. Furthermore, target analysis of major components may be achieved by mixing different preparations (e.g., see van Beek and Montoro, 2009 for detailed discussions). Extract EGB 761, a standardized G. biloba leaf extract commercially available in Europe, is a well-defined product and contains about 24% flavonol glycosides, 6% terpene lactones, and other constituents including ginkgolic acids (<5 ppm), proanthocyanadins, glucose, rhamnose, organic acids, and d-glucaric (EGb, 2003). Using the traditional quality control method of high-performance liquid chromatography (HPLC) separation with ultraviolet (UV) detection, five commercial samples in the United Kingdom had 5.6–10.6% terpene lactones and 28.0–35.3% flavonoids (Ding et al., 2006b). A survey of 27 G. biloba leaf extracts in the U.S. market reported variations of 23–35% for flavonol glycosides and 3.8–11.3% for terpene lactones, and a wide range from <500 to 90,000 ppm for ginkgolic acids (Kressmann et al., 2002b). Three pharmaceutical products and eight dietary supplements in Poland have also been analyzed and reported to contain 0.17–7.26% terpene lactones, 0.53–27.98% flavonoids, and 2–8053 ppm ginkgolic acids (Gawron-Gzella et al., 2010). When compared with the declared amount, another survey with 29 products in the Netherlands indicated that the amount of terpene lactones varies between 27–358% and the amount of flavonoids is between 86–418% (Fransen et al., 2010). It should be noted that the G. biloba leaf extract used in the current study was not from commercial sources. It contained 36.93% flavonol glycosides (19.58% quercetin, 14.54% kaempferol, and 2.81% isorhamnetin), 13.09% terpene lactones (6.88% bilobalode, 2.98% ginkgolide A, 1.20% ginkgolide B, and 2.03% ginkgolide C) (NTP, 2013), which are comparable to the products in market surveys.
In the present study, we first evaluated the in vitro genotoxicity of G. biloba leaf extract and its eight constituents including quercetin, quercetin-3-β-d-glucoside, kaempferol isorhamnetin, ginkgolides A, ginkgolide B, ginkgolide C, and bilobalide in the MLA. Gingko biloba leaf extract (Fig. 1) and three of its constituents, quercetin, kaempferol, and quercetin 3-β-d-glucoside (Table 1) induced significant MFs in the absence of metabolic activation. Quercetin (at 30μM) showed a positive response at lower concentrations than kaempferol (≥50μM) or quercetin 3-β-d-glucoside (>400μM). None of the four terpene lactones tested showed a positive response without S9 metabolic activation. Therefore, we evaluated these four chemicals and isorhamnetin with S9 activation and found them to also be negative (nonmutagenic) in the presence of metabolic activation. Based on the actual percentages of terpene lactones and flavonol glycosides in G. biloba leaf extract that we used for this study, the concentration of 1 mg/ml G. biloba leaf extract would be approximately equivalent to about 647μM quercetin, 508μM kaempferol, and 20–210μM for the other six constituents tested in this study (Supplementary table 2). Therefore, the two components, quercetin and kaempferol, appear to account for the mutagenicity observed with the 1 mg/ml G. biloba leaf extract.
We further investigated if exposures to G. biloba leaf extract, quercetin, or kaempferol result in DNA damage as measured using the Comet assay. The Comet assay is a sensitive method to detect DNA damage and the in vitro Comet assay can be a useful alternative to cytogenetic assays in early genotoxicity or photogenotoxicity screening of drug candidates (Witte et al., 2007). The neutral Comet assay typically detects DNA DSBs (Ostling and Johanson, 1984), whereas the alkaline Comet assay can measure DNA single-strand breaks, DSBs, and alkalilabile sites (Singh et al., 1988). In our study, under the same treatment conditions used with the MLA, the neutral Comet assay demonstrated that G. biloba leaf extract, quercetin, and kaempferol caused DSB DNA damage (Fig. 2). We also observed DNA damage induced by G. biloba leaf extract (1.0 mg/ml), quercetin (≥30μM), and kaempferol (≥50μM) in the alkaline Comet assay (data not shown). Although quercetin-3-β-d-glucoside at concentration of 600μM induced 2-fold higher DNA damage when compared with the control (Supplementary fig. 1), this concentration is much higher than the concentration contained in 1 mg/ml G. biloba leaf extract. In addition, quercetin-3-β-d-glucoside at concentration of 200μM and other five constituents with the concentrations tested did not induce DNA damage (Supplementary fig. 1).
It was previously reported that G. biloba leaf extract was mutagenic in the Ames test with the strongest response in strain TA98 in the presence of S9 (NTP, 2013), and it also exhibited damage to human red blood cells by increasing cell fragility and changing cellular morphology (He et al., 2009). Both concentration-and exposure time-dependent cytotoxicity following treatment with G. biloba leaf extract was observed in human normal gingival HF-1 fibroblasts as well as human carcinoma SCC 1483, HSG, and HSC-2 cell lines (Babich et al., 2009). Although toxicity data on G. biloba extract are limited, the genotoxicity of some constituents of G. biloba leaf extract has been well investigated. Quercetin was first shown in 1977 to be mutagenic in the Ames test both with and without S9 (Bjeldanes and Chang, 1977). Meltz and MacGregor (1981) demonstrated that 20 μg/ml (66μM) quercetin increased (about 9-fold) the Tk mutant frequency in L5178Y cells and caused DNA single-strand breaks using the alkaline elution technique. Quercetin was shown to cause DNA damage using the alkaline Comet assay in the bone marrow of mice (da Silva et al., 2002) and normal human lymphocytes and HepG2 cells (Duthie et al., 1997). In addition, quercetin showed some evidence of carcinogenic activity in an NTP 2-year study (NTP, 1992) and it was carcinogenic to the rat intestine, bladder, and kidney (Dunnick and Hailey, 1992; Pamukcu et al., 1980). Incubation of isolated rat liver nuclei with quercetin and kaempferol resulted in a concentration-dependent decrease in the double-strand DNA content concurrent with an increase in lipid peroxidation (Sahu and Gray, 1994; Sahu and Washington, 1991). Both quercetin and kaempferol produced positive responses in human lymphocytes using the Comet assay (Anderson et al., 1997). The potency of quercetin was shown to be higher than that of kaempferol at inducing chromosomal aberrations in V79 cells (Silva et al., 1997).
DNA damage, in particular generation of DSBs, triggers phosphorylation of histone H2AX (γ-H2AX) at serine-139 by PI3-K like kinases, including ATM, ATR, and DNA-PKcs (Burma et al., 2001). γ-H2AX is often considered to be a benchmark of DNA damage, and it may be mediated by ATM or ATR (Ward and Chen, 2001). When ATM or ATR is activated, they subsequently regulate the downstream proteins via the phosphorylation, such as Chk2, Chk1, p53, or p21; all are involved in DNA repair pathway and cell cycle (Kitagawa and Kastan, 2005; McManus and Hendzel, 2005). In this study, we detected expression changes in phosphorylated ATM, γ-H2AX, Chk2, and Chk1 after exposure to G. biloba leaf extract, quercetin, or kaempferol (Fig. 3). These protein expression changes support the observation that G. biloba leaf extract, quercetin, and kaempferol indeed cause DSBs as indicated by the neutral Comet assay (Fig. 2).
It is believed that some flavonoids such as quercetin and kaempferol have both cytotoxicity/genotoxicity and cytoprotective/genoprotective effects and the balance between the protection of DNA from oxidative damage and prooxidative effects is strongly dependent on flavonoid concentration and the incubation period (Rusak et al., 2010). In this study, we also investigated whether oxidative stress is a contributor to G. biloba leaf extract, quercetin and kaempferol-induced genotoxicity in L5178Y cells. Ginkgo biloba leaf extract produced dose-dependent pro-oxidant effects after 3-h treatment, based on a time course measurement of intracellular ROS in L5178Y cells (Fig. 4A). The increase in intracellular ROS (Fig. 4A) and the parallel decrease in GSH levels (Fig. 5) are consistent with the cytotoxicity and mutagenicity of G. biloba leaf extract (Fig. 1) being mediated by oxidative stress. This finding is consistent with previous reports that G. biloba leaf extract (0.25–1 mg/ml) yielded a linear increase in peroxide (H2O2 and superoxide anion) in cell culture medium after a 2-h incubation with a dose-dependent GSH depletion (Babich et al., 2009), and the concentrations of 0.1–0.2 mg/ml decreased the cellular GSH level with a dose-dependent manner in human red blood cells (He et al., 2009), both indicating the induction of oxidative stress. In addition, G. biloba leaf extract has a dual action, both protective and disruptive, depending on whether an exogenous stress is present and depending on the condition of the assays and dose range used (He et al., 2009).
Interestingly, it seemed that the cytotoxicity and mutagenicity of quercetin and kaempferol in L5178Y cells after 4-h treatments (Table 1) did not result in oxidative stress under the experimental conditions we applied, because both treatments generally decreased the intracellular ROS, except for the ROS levels at 10 min (Fig. 4B & 4C), and only slightly increased GSH levels (Fig. 5). The reasons for this response, the opposite of G. biloba leaf extract, are not clear. These results indicated that both quercetin and kaempferol act as ROS scavengers and antioxidants in our experimental conditions, although both chemicals also have pro-oxidant activity and may be a source of the ROS (Galati and O’Brien, 2004; Galati et al., 2002; Sahu and Gray, 1996). Considering the natural flavonoids may have polyvalent target sites in the cells, more studies involving different cell lines or primary cells and using precursors are needed. It has been reported that quercetin with the concentrations <200μM increased intracellular GSH levels after 18-h treatment in HepG2 cells whereas quercetin with the concentrations >200μM decreased GSH levels (Duthie et al., 1997), and the depletion of the nuclear GSH and GST is responsible for quercetin-and kaempferol-induced lipid peroxidation and oxidative DNA damage (Sahu and Gray, 1996).
Oxidative stress could induce DNA strand breaks and deletions. This DNA damage, which could be repaired by mitotic recombination or other mechanisms in the cells, may result in the LOH (Wang et al., 2009) that we observed in the Tk mutants. LOH is a common mutational event in the etiology of human cancer (Honma et al., 2001). In our study, all small colony mutants and >92% of large colony mutants induced by G. biloba leaf extract, quercetin, and kaempferol lost heterozygosity at the Tk locus (Table 2). Ginkgo biloba leaf extract, quercetin, and kaempferol caused chromosomal effects involving different lengths of chromosome 11 (Fig. 6) and their mutational spectra were significantly different from those of the negative control. These results suggest that the mutagenicity caused by treatment with these three test materials was generated by a clastogenic mode-of-action in L5178Y cells. It is clear, however that, G. biloba leaf extract, quercetin, and kaempferol can also induce point mutations because they are positive in the Ames test (NTP, 1992, 2013; Resende et al., 2012). Previous studies in other cell lines demonstrating both the induction of micronuclei and chromosomal aberrations support our observed clastogenicity induced by quercetin, and kaempferol (Carver et al., 1983; Gaspar et al., 1994; NTP, 1992).
Few studies have investigated the mutagenicity of G. biloba leaf extract in mammalian cells. In this study using mouse lymphoma L5178Y cells, we investigated the genotoxicity of G. biloba leaf extract and its eight constituents, and explored its underlying mechanisms. Ginkgo biloba leaf extract induced mutations in the MLA and DNA damage in the Comet assay at the dose of 1 mg/ml, and had a pro-oxidative effects with increased intracellular ROS levels and decreased GSH levels when applied at the doses over 0.4 mg/ml. Considering the percentages of each constituent tested in this study, it is tempting to attribute these observations with whole leaf extracts to the two components of quercetin and kaempferol. However, it is worth noting that at least 37 components have been identified in this extract (NTP, 2013) and not all have been studied for their genotoxicity. The constituent(s) of G. biloba leaf extract which may be responsible for the mutagenicity/genotoxicity and/or carcinogenicity have not been definitively identified, and there could be effects of the complex mixture that are not accounted for by evaluation of select constituents as was done in this study.
Recently, the NTP carcinogenicity study indicated that G. biloba leaf extract induced liver tumors in rodents and also targeted thyroid and nose (NTP, 2013; Rider et al., 2013). Human clinical studies have also been conducted using standardized Gingko products against a placebo group (Biggs et al., 2010). Although overall cancer incidence was similar in both groups, statistically significant increases were observed in breast and colon cancers, whereas prostate cancer was reduced in the treatment group compared with the control group. These findings should be cautiously viewed due to the small number of cancer cases used in the study (Biggs et al., 2010). Our study provides additional support for a genotoxic mechanism for G. biloba leaf extract-induced carcinogenesis in rodents. Gingko products are widely available in commercial products as dietary supplements and top the list of the best-selling herbal products. Because they are derived from botanical products using different methods of preparation, the final product could vary considerably in its chemical composition. Therefore, more studies on the mechanism of genotoxicity and carcinogenicity of G. biloba leaf extract are warranted.
Supplementary Material
ACKNOWLEDGMENT
The authors thank Drs Peter P. Fu and Vasily N. Dobrovolsky for their helpful suggestions and comments.
FUNDING:
The Postdoctoral Research Program at the National Center for Toxicological Research (NCTR) administered by the Oak Ridge Institute for Science and Education through an interagency agreement between the U.S. Department of Energy and the U.S. Food and Drug Administration (FDA) (to H.L.); The International Scientist Exchange Program (ISEP) at the NCTR receiving funding from the Office of International Programs, FDA (to S.Z.).
Footnotes
Disclaimer: The views presented in this article do not necessarily reflect those of the U.S. FDA.
SUPPLEMENTARY DATA
Supplementary data are available online at http://toxsci.oxfordjournals.org/.
REFERENCES
- Anderson D, Basaran N, Dobrzynska MM, Basaran AA, and Yu TW (1997). Modulating effects of flavonoids on food mutagens in human blood and sperm samples in the comet assay. Teratog. Carcinog. Mutagen 17, 45–58. [PubMed] [Google Scholar]
- Babich H, Ackerman NJ, Burekhovich F, Zuckerbraun HL, and Schuck AG (2009). Gingko biloba leaf extract induces oxidative stress in carcinoma HSC-2 cells. Toxicol. In Vitro 23, 992–999. [DOI] [PubMed] [Google Scholar]
- Biggs ML, Sorkin BC, Nahin RL, Kuller LH, and Fitzpatrick AL (2010). Ginkgo biloba and risk of cancer: Secondary analysis of the Ginkgo Evaluation of Memory (GEM) Study. Pharmacoepidemiol. Drug Saf 19, 694–698. [DOI] [PMC free article] [PubMed] [Google Scholar]
- Bjeldanes LF, and Chang GW (1977). Mutagenic activity of quercetin and related compounds. Science 197, 577–578. [DOI] [PubMed] [Google Scholar]
- Burma S, Chen BP, Murphy M, Kurimasa A, and Chen DJ (2001). ATM phosphorylates histone H2AX in response to DNA double-strand breaks. J. Biol. Chem 276, 42462–42467. [DOI] [PubMed] [Google Scholar]
- Caria H, Chaveca T, Laires A, and Rueff J (1995). Genotoxicity of quercetin in the micronucleus assay in mouse bone marrow erythrocytes, human lymphocytes, V79 cell line and identification of kinetochore-containing (CREST staining) micronuclei in human lymphocytes. Mutat. Res 343, 85–94. [DOI] [PubMed] [Google Scholar]
- Carver JH, Carrano AV, and MacGregor JT (1983). Genetic effects of the flavonols quercetin, kaempferol, and galangin on Chinese hamster ovary cells in vitro. Mutat. Res 113, 45–60. [DOI] [PubMed] [Google Scholar]
- Chan PC, Xia Q, and Fu PP (2007). Ginkgo biloba leave extract: Biological, medicinal, and toxicological effects. J. Environ. Sci. Health C Environ. Carcinog. Ecotoxicol. Rev 25, 211–244. [DOI] [PubMed] [Google Scholar]
- da Silva J, Herrmann SM, Heuser V, Peres W, Possa Marroni N, Gonzalez-Gallego J, and Erdtmann B (2002). Evaluation of the genotoxic effect of rutin and quercetin by comet assay and micronucleus test. Food Chem. Toxicol 40, 941–947. [DOI] [PubMed] [Google Scholar]
- Ding S, Dudley E, Chen L, Plummer S, Tang J, Newton RP, and Brenton AG (2006a). Determination of active components of Ginkgo biloba in human urine by capillary high-performance liquid chromatography/mass spectrometry with on-line column-switching purification. Rapid Commun. Mass Spectrom 20, 3619–3624. [DOI] [PubMed] [Google Scholar]
- Ding S, Dudley E, Plummer S, Tang J, Newton RP, and Brenton AG (2006b). Quantitative determination of major active components in Ginkgo biloba dietary supplements by liquid chromatography/mass spectrometry. Rapid Commun. Mass Spectrom 20, 2753–2760. [DOI] [PubMed] [Google Scholar]
- Dunnick JK, and Hailey JR (1992). Toxicity and carcinogenicity studies of quercetin, a natural component of foods. Fundam. Appl. Toxicol 19, 423–431. [DOI] [PubMed] [Google Scholar]
- Duthie SJ, Johnson W, and Dobson VL (1997). The effect of dietary flavonoids on DNA damage (strand breaks and oxidised pyrimdines) and growth in human cells. Mutat. Res 390, 141–151. [DOI] [PubMed] [Google Scholar]
- EGb (2003). EGb 761: Ginkgo biloba extract, Ginkor. Drugs R D 4, 188–193. [DOI] [PubMed] [Google Scholar]
- Fransen HP, Pelgrom SM, Stewart-Knox B, de Kaste D, and Verhagen H (2010). Assessment of health claims, content, and safety of herbal supplements containing Ginkgo biloba. Food Nutr. Res 54, 1–33. [DOI] [PMC free article] [PubMed] [Google Scholar]
- Galati G, and O’Brien PJ (2004). Potential toxicity of flavonoids and other dietary phenolics: Significance for their chemopreventive and anticancer properties. Free Radic. Biol. Med 37, 287–303. [DOI] [PubMed] [Google Scholar]
- Galati G, Sabzevari O, Wilson JX, and O’Brien PJ (2002). Prooxidant activity and cellular effects of the phenoxyl radicals of dietary flavonoids and other polyphenolics. Toxicology 177, 91–104. [DOI] [PubMed] [Google Scholar]
- Gaspar J, Rodrigues A, Laires A, Silva F, Costa S, Monteiro MJ, Monteiro C, and Rueff J (1994). On the mechanisms of genotoxicity and metabolism of quercetin. Mutagenesis 9, 445–449. [DOI] [PubMed] [Google Scholar]
- Gawron-Gzella A, Marek P, Chanaj J, and Matlawska I (2010). Comparative analysis of pharmaceuticals and dietary supplements containing extracts from the leaves of Ginkgo biloba L. Acta Pol. Pharm 67, 335–343. [PubMed] [Google Scholar]
- Guo L, Mei N, Liao W, Chan PC, and Fu PP (2010). Ginkgo biloba extract induces gene expression changes in xenobiotics metabolism and the Myc-centered network. OMICS 14, 75–90. [DOI] [PMC free article] [PubMed] [Google Scholar]
- Guo X, Verkler TL, Chen Y, Richter PA, Polzin GM, Moore MM, and Mei N (2011). Mutagenicity of 11 cigarette smoke condensates in two versions of the mouse lymphoma assay. Mutagenesis 26, 273–281. [DOI] [PMC free article] [PubMed] [Google Scholar]
- He J, Lin J, Li J, Zhang JH, Sun XM, and Zeng CM (2009). Dual effects of Ginkgo biloba leaf extract on human red blood cells. Basic Clin. Pharmacol. Toxicol 104, 138–144. [DOI] [PubMed] [Google Scholar]
- Honma M, Momose M, Sakamoto H, Sofuni T, and Hayashi M (2001). Spindle poisons induce allelic loss in mouse lymphoma cells through mitotic non-disjunction. Mutat. Res 493, 101–114. [DOI] [PubMed] [Google Scholar]
- Kitagawa R, and Kastan MB (2005). The ATM-dependent DNA damage signaling pathway. Cold Spring Harb. Symp. Quant. Biol 70, 99–109. [DOI] [PubMed] [Google Scholar]
- Kressmann S, Biber A, Wonnemann M, Schug B, Blume HH, and Muller WE (2002a). Influence of pharmaceutical quality on the bioavailability of active components from Ginkgo biloba preparations. J. Pharm. Pharmacol 54, 1507–1514. [DOI] [PubMed] [Google Scholar]
- Kressmann S, Muller WE, and Blume HH (2002b). Pharmaceutical quality of different Ginkgo biloba brands. J. Pharm. Pharmacol 54, 661–669. [DOI] [PubMed] [Google Scholar]
- Lindstrom A, Ooyen C, Lynch ME, and Bluementhal M (2013). Herb supplement sales increase 5.5% in 2012: Herbal supplement sales rise for 9th consecutive year; turmeric sales jump 40% in natural channel. HerbalGram 99, 60–65. [Google Scholar]
- Mahadevan S, and Park Y (2008). Multifaceted therapeutic benefits of Ginkgo biloba L.: Chemistry, efficacy, safety, and uses. J. Food Sci 73, R14–19. [DOI] [PubMed] [Google Scholar]
- McManus KJ, and Hendzel MJ (2005). ATM-dependent DNA damage-independent mitotic phosphorylation of H2AX in normally growing mammalian cells. Mol. Biol. Cell 16, 5013–5025. [DOI] [PMC free article] [PubMed] [Google Scholar]
- Mei N, Guo X, and Moore MM (2014). Methods for using the mouse lymphoma assay to screen for chemical mutagenicity and photo-mutagenicity. In Optimization in Drug Discovery: In Vitro Methods (Caldwell GW and Yan Z Eds.), pp. 561–592, Humana Press, New York. [Google Scholar]
- Mei N, Hu J, Xia Q, Fu PP, Moore MM, and Chen T (2010). Cytotoxicity and mutagenicity of retinol with ultraviolet A irradiation in mouse lymphoma cells. Toxicol. In Vitro 24, 439–444. [DOI] [PMC free article] [PubMed] [Google Scholar]
- Mei N, Xia Q, Chen L, Moore MM, Chen T, and Fu PP (2006). Photomutagenicity of anhydroretinol and 5,6-epoxyretinyl palmitate in mouse lymphoma cells. Chem. Res. Toxicol 19, 1435–1440. [DOI] [PMC free article] [PubMed] [Google Scholar]
- Mei N, Xia Q, Chen L, Moore MM, Fu PP, and Chen T (2005). Photomutagenicity of retinyl palmitate by ultraviolet a irradiation in mouse lymphoma cells. Toxicol. Sci 88, 142–149. [DOI] [PMC free article] [PubMed] [Google Scholar]
- Meltz ML, and MacGregor JT (1981). Activity of the plant flavanol quercetin in the mouse lymphoma L5178Y TK+/− mutation, DNA single-strand break, and Balb/c 3T3 chemical transformation assays. Mutat. Res 88, 317–324. [DOI] [PubMed] [Google Scholar]
- Moore MM, Honma M, Clements J, Bolcsfoldi G, Burlinson B, Cifone M, Clarke J, Delongchamp R, Durward R, Fellows M, et al. (2006). Mouse lymphoma thymidine kinase gene mutation assay: Follow-up meeting of the International Workshop on Genotoxicity Testing–Aberdeen, Scotland, 2003—Assay acceptance criteria, positive controls, and data evaluation. Environ. Mol. Mutagen 47, 1–5. [DOI] [PubMed] [Google Scholar]
- NBJ. (2013). Supplement Business Report, Nutritional Business Journal. Penton Media Inc, Boulder, CO. [Google Scholar]
- NTP. (1992). Toxicology and carcinogenesis studies of quercetin in F344/N rats. http://www.ntp.niehs.nih.gov/ntp/htdocs/LT_rpts/tr409.pdf. Accessed March 1, 2014.
- NTP. (2013). Toxicology and carcinogenesis studies of Ginkgo biloba extract (CAS No. 90045–36-6) in F344/N rats and B6C3F1/N mice (Gavage studies). Natl. Toxicol. Program Tech. Rep. Ser 1–183. [PubMed] [Google Scholar]
- Ostling O, and Johanson KJ(1984). Microelectrophoretic study of radiation-induced DNA damages in individual mammalian cells. Biochem. Biophys. Res. Commun 123, 291–298. [DOI] [PubMed] [Google Scholar]
- Pamukcu AM, Yalciner S, Hatcher JF, and Bryan GT (1980). Quercetin, a rat intestinal and bladder carcinogen present in bracken fern (Pteridium aquilinum). Cancer Res. 40, 3468–3472. [PubMed] [Google Scholar]
- Pelengaris S, Khan M, and Evan G (2002). c-MYC: More than just a matter of life and death. Nat. Rev. Cancer 2, 764–776. [DOI] [PubMed] [Google Scholar]
- Resende FA, Vilegas W, Dos Santos LC, and Varanda EA (2012). Mutagenicity of flavonoids assayed by bacterial reverse mutation (Ames) test. Molecules 17, 5255–5268. [DOI] [PMC free article] [PubMed] [Google Scholar]
- Rider CV, Nyska A, Cora MC, Kissling GE, Smith C, Travlos GS, Hejtmancik MR, Fomby LM, Colleton CA, Ryan MJ, et al. (2013). Toxicity and carcinogenicity studies of Ginkgo biloba extract in rat and mouse: Liver, thyroid, and nose are targets. Toxicol. Pathol (Epub ahead of print). [DOI] [PMC free article] [PubMed] [Google Scholar]
- Rusak G, Piantanida I, Masic L, Kapuralin K, Durgo K, and Kopjar N (2010). Spectrophotometric analysis of flavonoid-DNA interactions and DNA damaging/protecting and cytotoxic potential of flavonoids in human peripheral blood lymphocytes. Chem. Biol. Interact 188, 181–189. [DOI] [PubMed] [Google Scholar]
- Sahu SC, and Gray GC(1994). Kaempferol-induced nuclear DNA damage and lipid peroxidation. Cancer Lett. 85, 159–164. [DOI] [PubMed] [Google Scholar]
- Sahu SC, and Gray GC (1996). Pro-oxidant activity of flavonoids: Effects on glutathione and glutathione S-transferase in isolated rat liver nuclei. Cancer Lett. 104, 193–196. [DOI] [PubMed] [Google Scholar]
- Sahu SC, and Washington MC (1991). Quercetin-induced lipid peroxidation and DNA damage in isolated rat-liver nuclei. Cancer Lett. 58, 75–79. [DOI] [PubMed] [Google Scholar]
- Silva ID, Rodrigues AS, Gaspar J, Maia R, Laires A, and Rueff J (1997). Involvement of rat cytochrome 1A1 in the biotransformation of kaempferol to quercetin: Relevance to the genotoxicity of kaempferol. Mutagenesis 12, 383–390. [DOI] [PubMed] [Google Scholar]
- Singh NP, McCoy MT, Tice RR, and Schneider EL (1988). A simple technique for quantitation of low levels of DNA damage in individual cells. Exp. CellRes. 175, 184–191. [DOI] [PubMed] [Google Scholar]
- van Beek TA, and Montoro P (2009). Chemical analysis and quality control of Ginkgo biloba leaves, extracts, and phytopharmaceuticals. J. Chromatogr. A 1216, 2002–2032. [DOI] [PubMed] [Google Scholar]
- Wang J, Chen T, Honma M, Chen L, and Moore MM (2007). 3′-Azido-3′-deoxythymidine induces deletions in L5178Y mouse lymphoma cells. Environ. Mol. Mutagen 48, 248–257. [DOI] [PubMed] [Google Scholar]
- Wang J, Sawyer JR, Chen L, Chen T, Honma M, Mei N, and Moore MM (2009). The mouse lymphoma assay detects recombination, deletion, and aneuploidy. Toxicol Sci 109, 96–105. [DOI] [PubMed] [Google Scholar]
- Ward IM, and Chen J (2001). Histone H2AX is phosphorylated in an ATR-dependent manner in response to replicational stress. J Biol Chem 276, 47759–47762. [DOI] [PubMed] [Google Scholar]
- Witte I, Plappert U, de Wall H, and Hartmann A (2007). Genetic toxicity assessment: Employing the best science for human safety evaluation. Part III. The comet assay as an alternative to in vitro clastogenicity tests for early drug candidate selection. Toxicol Sci 97, 21–26. [DOI] [PubMed] [Google Scholar]
Associated Data
This section collects any data citations, data availability statements, or supplementary materials included in this article.