Abstract
Medicine has many great pioneers, and in 1899, one such pioneer - Karel Frederik Wenckebach made a discovery which, even to this day, remains one of the fundamental concepts within electrophysiology.
Since the Wenckebach Phenomenon was first described, the field of electrophysiology has developed at a rapid pace, allowing us to observe this behaviour, and its complexities, in many new ways. In a similar way, this chapter will illustrate Wenckebach behaviour across a spectrum of modalities from the 12 lead ECG, through to the intra-cardiac recordings from both electrophysiological studies and implantable cardiac devices. In doing so, we continue to shed light on the phe-nomenon first identified through Wenckebach’s meticulous attention to detail some 120 years ago.
Keywords: Wenckebach, Mobitz type 1, atrioventricular block, ECG, electrophysiology, AV node
1. INTRODUCTION
Medicine has many great pioneers, their lasting legacies recalled at the mention of a name. This pioneer, his name, and the phenomenon he originally described are known across the world, simply as Wenckebach.
Born March 24th1864, Karel Frederik Wenckebach, a Dutch anatomist and cardiologist, would have had little inclination of how famous his name would later become [1]. Having studied medicine in Utrecht, the Netherlands, he went on to research the rhythmic patterns of the frog heart under Engelmann, setting the stage for his future achievements [2]. It was in 1899 however, that the young physician recorded an observation in the jugular venous pulse (JVP) of a human patient and discovered a phenomenon which would later bear his name [2].
Laying in direct contact with the right sided heart, the jugular veins allow an indirect observation of the various phases of the cardiac cycle. Wenckebach meticulously observed such changes in the relative timing of two key waveforms; the ‘a’ and ‘c’ waves, corresponding to atrial and ventricular contraction, respectively. His observations, recorded using a smoked drum kymograph, are shown below and demonstrate progressive lengthening of the interval between the two waveforms until the absence of the 4th c wave, followed by a pause. Wenckebach’s findings were later published in 1899 in what is considered the first appreciation of decremental conduction within cardiac tissues [3]. Although later re-classified by Mobitz in 1924 as type 1, second degree AV block, the phenomenon still bears the legacy of the person who first documented its presence, long before the advent of electrocardiography [4].
The numerous ways in which we observe this behaviour have increased significantly due to the rapid pace at which electrophysiology has developed. In a similar way, this chapter will demonstrate the same behaviour across a spectrum of modalities, from the 12 lead ECG through to the intra-cardiac recordings from both electrophysiological testing and implantable cardiac devices.
Wenckebach had astutely observed beat to beat, progressive lengthening of the interval between the a and c waves in the jugular vein of his patient (Fig. 1). A point was reached where an a wave was seen, but not followed by a c wave, and, following a pause, the cycle reset with the ‘ac’ interval returning to baseline. Although not immediately appreciated by Wenckebach, he had observed the mechanical result of a specific form of AV nodal behaviour. To lay the foundation on which to discuss this further, we begin with some basic concepts of the function of the cardiac electrical system, focusing on the AV node, and in particular, decremental conduction.
Fig. (1).
– Smoked drum kymograph tracing of a JVP waveform. Copy of the original smoked drum kymograph recording of the JVP waveform by Wenckebach. Close inspection demonstrates a progressive lengthening in the interval between the a and c waves resulting in an absent c wave followed by a relative pause before the cycle repeats. Reproduced and modified from original article with permission.1
In essence, the atria and ventricles are electrically isolated from one another except for a small region of highly specialized cells - the AV node. Laying anatomically at the base of the right atrium within the region known as the triangle of Koch, the AV node sits as the gatekeeper of electrical activation to the His-Purkinje system and ultimately, the ventricles. While permitting the passage of electrical activity from the atria to the ventricles, the AV node imposes a slight slowing in conduction, thereby ensuring sufficient time for optimization of cardiac filling and preservation of sequential atrial and ventricular activation.
However, the AV node does not have a binary ‘all or nothing’ response to incoming atrial stimuli. With progressive shortening of the intervals between the incoming stimuli, lengthening of the output is seen until conduction block occurs, protecting the ventricles from rapidly conducted atrial rhythms; a concept known as decremental conduction. Of note, the point at which block will occur is dynamic. The node is fully integrated into the neurohormonal milieu and is under the constant influence of competing inputs from the autonomic nervous system. Consequently, the specific conduction properties of the AV node vary – for example, under periods of increased vagal tone, the given cycle length at which the Wenckebach block will occur is increased.
Wenckebach’s observations reflected progressive prolongation in the time taken for electrical activation in the atria to travel to the ventricle, resulting in electrical depolarization. Moreover, at a critical, fixed input cycle length, the properties of the AV node are such that progressive delay in the PR interval (to be precise te AH interval) is seen before the P wave fails to be conducted to the ventricle. The resulting brief pause allows sufficient time for tissue recovery and the cycle is ultimately reset. It is this classical behaviour, first identified some 120 years ago that has gone on to bear the name of the pioneer who first documented it - Wenckebach block.
While this behaviour may be considered normal, it may also occur during disease states, at times necessitating insertion of an implantable electronic device. In this case, the resting 12 lead ECG can be particularly helpful; in general, the absence of associated distal conduction disease (manifested by prolongation of the QRS) suggests the location of the block is within the AV node. Even in cases where a broad QRS is seen (>120ms) most type 1, second degree AV blocks still remain in the AV node, with the remainder occasionally occurring within the distal conduction system, which is of prognostic significance, and usually requires pacing [5, 6].
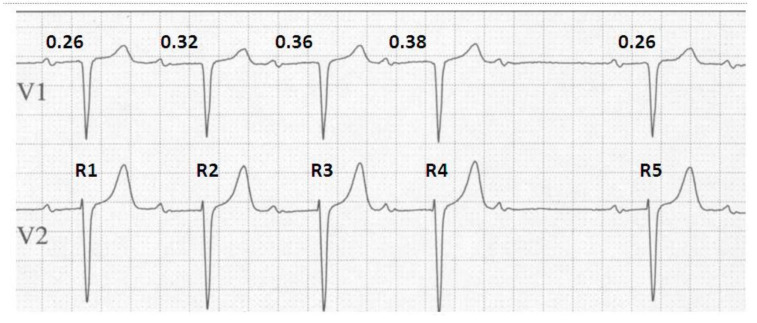
The rhythm strip seen in Fig. (2) demonstrates the classical features of the Wenckebach phenomenon and will be used to emphasize some of the key features of Wenckebach block. With a stable atrial input of 780 ms we see a progressive lengthening of the PR interval until a non-conducted atrial beat and a brief pause are seen, after which the cycle resets. Considering this concept further, it should not be of surprise that a diagnosis of Wenckebach block requires at least 2 consecutive stimuli to demonstrate progressive conduction delay prior to eventual block [7]. In the absence of this, the observer would be unable to demonstrate progressive prolongation in the PR interval and therefore unable to distinguish this from other types of heart block such as type 2, second degree AV block with periodic, non-conduction of atrial stimuli.
Fig. (2).
Typical Wenckebach behaviour. An ECG demonstrating the 4 key elements of typical Wenckebach behaviour. The duration of the ventricular pause can be calculated by deducting the difference in the longest and the shortest PR intervals from 2x the PP interval i.e. 2(PP) - (PR4-PR1) = 2(780) - (380-260) = 1560-120 = 1440ms. The change in RR interval is determined by the difference between the 2 PR intervals forming the resulting RR interval that is being assessed, such that; R1 - R2 = PP + PR2 - PR1 = PP + 0.32 - 0.26 = PP + 0.06. Repeating this approach demonstrates that with each successive prolongation in PR interval, the relative RR intervals decrease by R2-R3 = 0.04 ms and R3-R4 = 0.02 ms respectively.
On closer review we see a further classical observation during Wenckebach block. That is, the PR interval (the interval between the P wave and its conducted ventricular response) immediately preceding the non-conducted impulse shows the longest PR interval, and the one following, the shortest. If we consider that the ‘input’ to the AV node remains at a fixed cycle length, for example during stable sinus rhythm, and that by definition only a single dropped beat occurs, then given that the longest AV delay precedes the dropped beat and the shortest follows it, the duration of the ventricular pause cannot exceed twice that of the P-P interval [8].
The next, and probably subtlest of all observations, is the change in R-R intervals during Wenckebach. Contrary to the progressive lengthening of the PR intervals, the R-R intervals appear to shorten prior to the pause. Again, this seems initially confusing. However, if we recall that the atrial input remains constant, and we consider that in non-decremental conduction, in a 1:1 relationship, the atrial and ventricular rates would be equal; then, given that the largest decrement occurs between the first and second R waves, the result is the first R-R interval is the longest. Since the increase in the PR interval becomes progressively shorter for each conducted beat in a typical Wenckebach cycle, the R-R interval actually becomes progressively shorter until the blocked atrial impulse.
On this basis, and using Fig. (2) as an example, the difference in RR intervals is equal to:
R1-R2 = PP+PR2-PR1 = PP+0.32-0.26 = PP + 0.06
R2-R3 = PP+PR3-PR2 = PP+0.36-0.32 = PP + 0.04
R3-R4 = PP+ PR4-PR3 = PP+0.38-0.36 = PP + 0.02
R4-R5 = 2PP+PR5-PR4 = 2PP+0.26-0.38 = 2PP – 0.12
To recap, we have now described the 4 key elements of typical Wenckebach behaviour. In association with repetitive group beating they are:
Progressive lengthening of each successive PR interval.
The pause produced by the non-conducted P wave is equal to the increment between the last PR interval (preceding the pause) and the first PR interval following the pause (shortest) subtracted from twice the PP interval.
The RR interval between the first and second conducted beats is the largest and between the last conducted beats, the shortest.
There is progressive shortening of the RR intervals.
Early observers of this phenomenon, including Wenckebach himself, appreciated common, recurring cycles in the ratio between the number of inputs and outputs seen. Wenckebach identified patterns of the progressive prolongation in the AC interval, termed periodicity. In his published smoke drum recordings, he clearly identified a 4:3 ratio between the ‘input’ and ‘output’ waveforms. It is however recognised that both ‘typical’ and ‘atypical’ forms of Wenckebach exist [9]. However - it is important to note that the term ‘typical Wenckebach’ is not related to the ratio of P waves to QRS complexes but of the adherence to the above ‘key elements’ during this phenomenon.
During their study published in 1975, Denes and colleagues’ attempt to quantify the frequency of both typical and atypical Wenckebach periodicity and to define the atypical variations [9]. While assessing patients in whom spontaneous or pacing induced block was seen, they made some interesting observations as to patterns of behaviour seen with this phenomenon. In those patients with spontaneous Mobitz type 1 block, the only observed A:V ratios that met all the original criteria listed above was a 4:3 ratio and, even in this case, only 41% of cases met all criteria, hence being deemed ‘typical’. Therefore, 59% of patients with spontaneous 4:3 ratios had an ‘atypical’ pattern – defined as having met the general definition of Wenckebach but failing to meet all of the criteria. Looking then to patients who had pacing induced Wenckebach, 69% of the 4:3 ratios, 14% of 5:4 and 11% of 6:5 ratios were typical, moreover any induced ratio above 6:5 failed to display any typical behaviour.
The work of Denes and colleagues also highlights a classical observation of Wenckebach periodicity, in that the ratio of inputs to outputs always conforms to a (n+1)/n configuration [9]. This may not be surprising given the Wenckebach sequence ends following a single non-conducted beat – thus the numbers of inputs will always exceed the outputs by one. Overall this appears straightforward, however, as we will see later this concept becomes a little more confusing when attempting to make this pattern conform to more unusual ratios – for example 8:3. We will visit the underlying mechanism to this shortly.
Having demonstrated Wenckebach block arising within the AV node as a ‘whole’, intriguingly, this behaviour appears neither constrained to a single component of the AV node, nor indeed the AV node itself. The AV node is a complex structure and on a functional level there can be many variations. In one common scenario an individual may possess ‘dual AV node physiology’, that is, the AV node may contain both a slow and fast conducting region. The former displays slow conduction but a short refractory period, whilst the latter conducts rapidly yet has a long refractory period. Under a set of reasonably specific conditions, re-entry may occur between these two functional pathways resulting in supraventricular tachycardia. While eminently amenable to curative ablation by way of modification to the slow pathway, such that its conduction properties are altered and it is no longer able to sustain tachycardia, its ablation has given rise to some interesting features in regard to Wenckebach behaviour. Elegant work by Zhang and Masgalev [10] clearly demonstrated that while Wenckebach behaviour could be observed via the slow pathway, following slow pathway ablation in animal studies the point at which Wenckebach would occur post ablation would alter, but the phenomenon still occurred – that is, it seems to be a feature, where present, of the entire AV node and not isolated to one component.
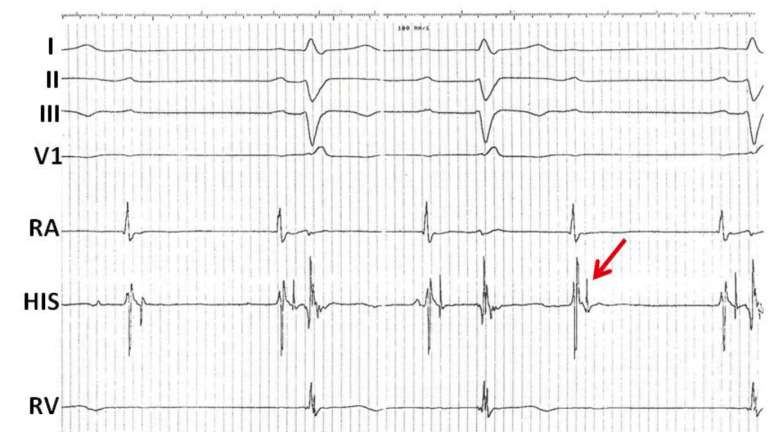
Furthermore, although much less common, the more distal components of the His-Purkinje system appear capable of demonstrating Wenckebach behaviour. In the tracing below, the first P wave is not conducted, however the second and third P waves are followed by a wide QRS with RBBB morphology and left axis deviation (Fig. 3). The PR interval of the first conducted beat demonstrates the shortest PR interval and the following PR interval appears prolonged. The next P wave in the sequence is no longer followed by a QRS. Towards the end of the recording, the final P wave is once more followed by a QRS with a similar PR interval to the first conducted P wave. On closer examination of the His electrograms we see that each atrial electrogram is followed by a His electrogram in a 1:1 relationship with a stable AH interval. However, the conducted beats demonstrate progressive prolongation in the HV interval until the third beat in the sequence is no longer conducted and blocked after the His deflection (arrow), in keeping with infra-nodal Wenckebach block.
Fig. (3).
Infra-nodal Wenckebach conduction. Intracardiac electrograms demonstrating infra-nodal Wenckebach. Shown are surface leads I, II, III, and V1 as well as intracardiac electrograms from the right atrium (RA), AV node His region (HIS) and the right ventricle (RV). There is a regular atrial rhythm. The first P wave is not conducted; however the second and third P waves are followed by a wide QRS. Each atrial electrogram is followed by a His electrogram in a 1:1 relationship with a stable AH interval. However, the conducted beats demonstrate progressive prolongation in the HV interval until the third beat in the sequence is no longer conducted and is blocked below the His (arrow). This appearance is in keeping with infra-nodal Wenckebach.
Interestingly, there are a number of similarities in cellular physiology between both the AV and sinoatrial (SA) nodes. While conceptually this may be more difficult to understand, the SA node is also capable of Wenckebach behaviour [11]. Remember, in AV nodal Wenckebach the ‘input’ to the AV node is the P wave, and this can be readily seen on the surface ECG, thereby making the phenomenon easier to observe and understand. Difficulty comes however in the case of sinoatrial Wenckebach where ‘input’ sinus node depolarization is not visible, and the only measurable electrical component is the ‘output’ i.e. the P wave.
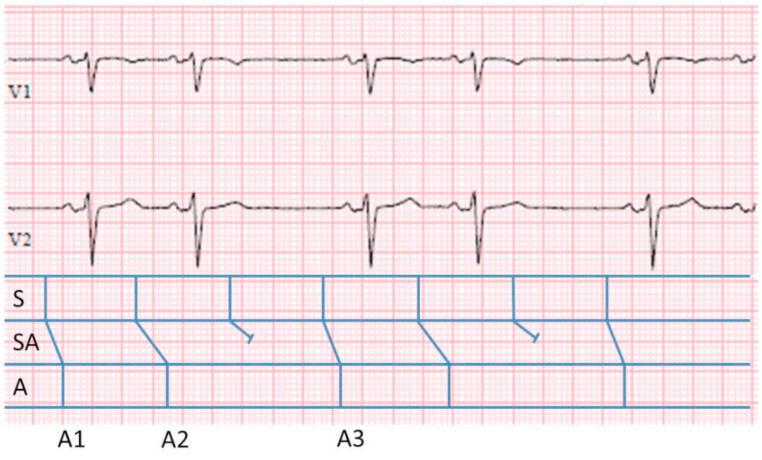
Above, in Fig. (4), is an ECG strip demonstrating sinoatrial Wenckebach. On initial inspection, a classical pattern of grouped beating is seen with pairs of P waves. In this case, as stated, the input cannot be seen, but the output can. In the ladder diagram below the ECG, the classical depiction of the A, AV and V as demonstrated above, have been replaced by S (sinus node), SA (sinoatrial junction, akin to the AV node) and the A (atrium). Although unseen, it is still possible to calculate the input within the SA node using the available atrial cycle information. As in AV nodal Wenckebach, the ratio of input to output remains (n+1)/n. Calculating the total cycle length, equal to the interval from A1 to A3 = 1880 ms. During this time there have been a total of 3 inputs from within the SA node. Therefore, given that the total S and A cycle lengths must be equal, the unseen ‘input’ cycle length is 1880/3=626ms.
Fig. (4).
3:2 S-A Wenckebach. ECG leads V1 and V2 demonstrating SA nodal Wenckebach with an associated ladder diagram. The classical depiction of the A, AV and V have been replaced by S, SA, A. To calculate the unseen input within the SA node we apply the same (n+1)/n formula. The total cycle length, equal to the interval from A1 to A3 = 1880 ms. During this time there have been a total of 2 outputs and therefore 3 inputs from within the SA node. Therefore, the overall ‘unseen’ input cycle length is 1880/3= 626ms.
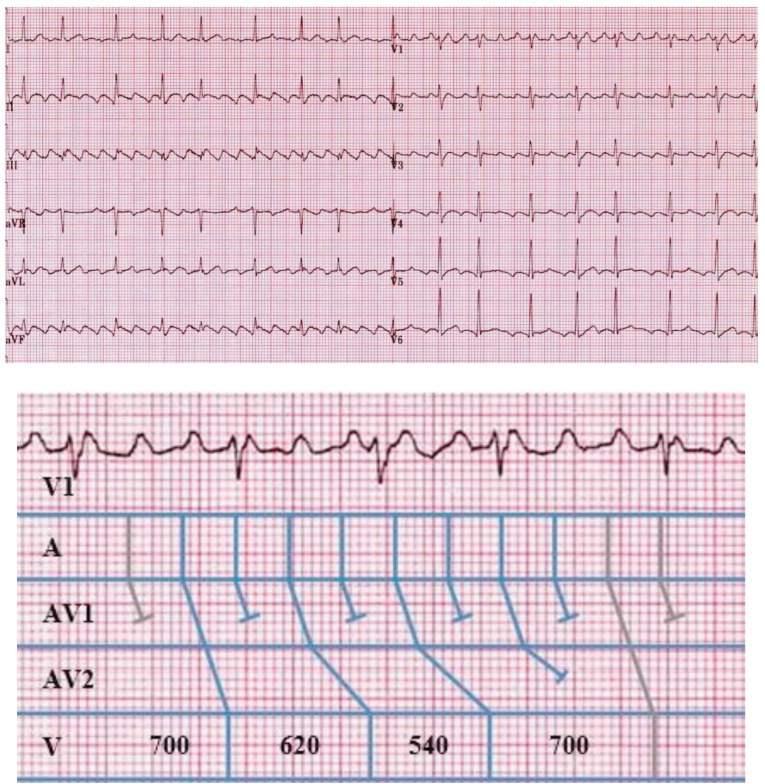
Now we return to the conundrum previously posed with regard to the concept of an 8:3 ratio of AV block. As seen earlier, Wenckebach block conforms to an (n+1)/n relationship; therefore, one might initially struggle with the concept of an 8:3 ratio. However, we have also seen that multiple regions within the AV node and distal conduction system are able to demonstrate Wenckebach behaviour. Let us consider therefore the scenario in which more than one level of block is occurring within the AV node – obtaining a ratio of 8:3 block suddenly seems reachable. On the assumption that all regions continue to conform to the (n+1)/n ratio then mathematically, for argument sake, consider that the proximal AV node displays a 2:1 block, and the more distal portion of the node displays 4:3 block; the end result, from initial input at the proximal AV node to the exit in the distal conduction system is 2:1x4:3=8:3. Multiple, more complex ratios of block can be explained in a similar fashion. Above, in Fig. (5a), is a 12 lead ECG of typical atrial flutter. On closer inspection, as shown, it is clear that for 8 ‘inputs’ there are 3 ventricular responses. Fig. (5b) demonstrates a ladder diagram displaying the multiple levels of block within the AV node (AVN1 and AVN2) and the presence of typical Wenckebach periodicity within the AVN2 region.
Fig. (5).
a) Complex Wenckebach with 8:3 conduction. b). Enlarged copy of lead V1 with associated ladder diagram. (a):12 lead ECG demonstrating typical atrial flutter. Note the underlying repetitive appearance of the QRS complexes with grouped beating and overall 8:3 Wenckebach block. (b) demonstrates an enlarged copy of surface lead V1 with the repeating sequence and associated ladder diagram demonstrating assumed multi-level block resulting in repeating 8:3 conduction. AVN1 and AVN2 denote 2 levels within the AV node (AVN). Note that at the first AVN level there is 2:1 block. The second AVN level demonstrates typical 4:3 Wenckebach periodicity.
Having observed Wenckebach behaviour via the 12 lead ECG and the intracardiac EGM, next we turn our attention toward implantable cardiac electronic devices. Although this concept may appear confusing, it is important to remember that we are still observing exactly the same behaviour shown above but displayed in a slightly different way. Conceptually, this is similar to the previous description of SA nodal Wenckebach given that the only observable information may be the output, in this case, the ventricular response. Of course, we now know that it is still possible to obtain information regarding the input cycle given that once more, the classical (n+1)/n ratio remains upheld – for now.
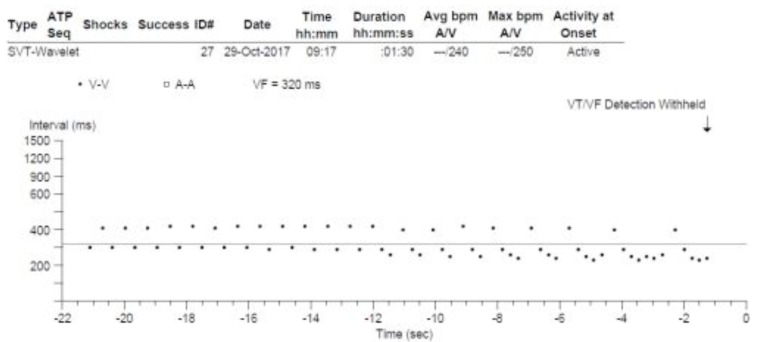
Fig. (6) demonstrates a ventricular interval dot plot illustrating the timing of ventricular activation from an implantable cardioverter defibrillator (ICD) interrogation. For those not familiar with such a tracing, each dot represents a ventricular electrogram and its associated timing, relative to the preceding beat (or dot) in milliseconds, displayed over time.
Fig. (6).
Wenckebach conduction demonstrated from the ventricular output of an implantable cardioverter defibrillator. A ventricular interval plot obtained from an implantable cardioverter defibrillator and designated initially by the device as VT/VF. Note the appearance of grouped beating and the classical reduction in the cycle length between successive ventricular beats in the sequence, therefore initially demonstrating ‘typical’ 3:2, 4:3 and 5:4 Wenckebach block. It is not until the final sequences with 6:5 and 8:7 block that the typical behaviour is lost. This Wenckebach behaviour shows that the rhythm is being driven by a regular atrial input and that the ventricular rhythm is actually due to atrial flutter with variable (Wenckebach) conduction.
From first glance, we again see the typical grouped beating appearance of output periodicity seen with Wenckebach conduction. Recall the fundamental concept that the RR interval decreases with each beat leading up to the non-conducted beat, following which the cycle resets. In this case the relative pause resulting from the non-conducted beat is a little harder to identify. Looking at the timing sequence, we see that the second and third beats are closer to one another than the third and fourth. Beginning from the second QRS at 410ms, we see the initiation of a typical Wenckebach sequence with shortening of the R-R interval with successive beats – the next being 310ms. Following, there is a slightly longer delay (during which the non-conducted beat occurs) and the cycle restarts once more at 410 ms.
Applying the (n+1)/n formula to the 2 ventricular beats seen (410ms + 310ms), by definition implies the presence of an additional input. Therefore, the ‘input’ cycle length can be calculated as (410+310)/3=240ms.
This 3:2 periodicity continues until we view the second half of the dot plot diagram. Now we observe a further change with the addition of a further ‘dot’ to the sequence. Note the relative reduction in cycle length is less than that seen between the first and second beats, thus we observe progressive R-R interval shortening with each successive beat in the sequence, in keeping with the typical Wenckebach pattern of 4:3 block. Applying the (n+1)/n formula allows us to demonstrate that, as expected, the input cycle length has not been altered. Therefore, given the cycle has now increased by 1, and given the relative timing of the third beat, the equation becomes (410+310+250)/4=242ms.
The subsequent 4 cycles continue with 4:3 block following which a further additional dot joins the sequence and continues to obey the expected ‘typical’ Wenckebach behaviour, resulting in 5:4 block. Reapplying the same formula once more confirms preservation of the input cycle length; (410+310+250+242)/5=242ms.
In the last 3 cycles, we observe an obvious and unexpected change from the earlier pattern. The additional 5th, 6th, and 7th beats joining the next two sequences are, respectively, of increased then decreased cycle length. Therefore, typical Wenckebach periodicity is no longer seen. As outlined by the work of Denes and colleagues referred to earlier, we recall that beyond a 4:3, and certainly 5:4 ratio, a typical Wenckebach pattern is not commonly seen, a point well illustrated here.
CONCLUSION
When confronted with a tracing, whether a 12 lead ECG or intracardiac recording, the signature appearance of grouped beating should demand close attention and consideration as to the underlying rhythm. Indeed, where a repetitive, albeit irregular rhythm is seen, it is likely that the input is a regular one. In such a case, Wenckebach behaviour should be strongly considered and close inspection often identifies the four key features of typical Wenckebach block. Even when the underlying ‘input’ is unclear, the ‘output’ cycle length, and application of the (n+1)/n formula will allow its calculation, of course remembering the caveat that beyond ratios of 5:4, the likelihood of typical Wenckebach behaviour is considerably less.
Despite its original description 120 years ago, the Wenckebach phenomenon remains one of the fundamental concepts within electrophysiology. Although the hallmark of progressive PR segment prolongation remains well known to many physicians, to fully appreciate its subtle complexities, it continues to demand the same meticulous attention to detail as demonstrated by Wenckebach himself.
Acknowledgements
Declared none.
Consent for Publication
Applicable.
Funding
None.
Conflict of Interest
The authors declare no conflict of interest, financial or otherwise.
REFERENCES
- 1.Upshaw C.B., Jr, Silverman M.E. The Wenckebach phenomenon: a salute and comment on the centennial of its original description. Ann. Intern. Med. 1999;130(1):58–63. doi: 10.7326/0003-4819-130-1-199901050-00011. [DOI] [PubMed] [Google Scholar]
- 2.Pérez-Riera A.R., Femenía F., McIntyre W.F., Baranchuk A. Karel Frederick Wenckebach (1864-1940): a giant of medicine. Cardiol. J. 2011;18(3):337–339. [PubMed] [Google Scholar]
- 3.Wenckebach K.F. On the analysis of irregular pulses. Z. Klin. Med. 1899;37:475–488. [Google Scholar]
- 4.Decherd G.M., Ruskin A. The mechanism of the Wenckebach type of AV block. Br. Heart J. 1946;8(1):6–16. doi: 10.1136/hrt.8.1.6. [DOI] [PMC free article] [PubMed] [Google Scholar]
- 5.Barold S.S. Lingering misconceptions about type I second-degree atrioventricular block. Am. J. Cardiol. 2001;88(9):1018–1020. doi: 10.1016/S0002-9149(01)01980-4. [DOI] [PubMed] [Google Scholar]
- 6.Brignole M., Auricchio A., Baron-Esquivias G., et al. ESC Committee for Practice Guidelines (CPG); Document Reviewers. 2013 ESC Guidelines on cardiac pacing and cardiac resynchronization therapy: the Task Force on cardiac pacing and resynchronization therapy of the European Society of Cardiology (ESC). Developed in collaboration with the European Heart Rhythm Association (EHRA). Eur. Heart J. 2013;34(29):2281–2329. doi: 10.1093/eurheartj/eht150. [DOI] [PubMed] [Google Scholar]
- 7.Denes P., Levy L., Pick A., Rosen K.M. The incidence of typical and atypical A-V Wenckebach periodicity. Am. Heart J. 1975;89(1):26–31. doi: 10.1016/0002-8703(75)90005-8. [DOI] [PubMed] [Google Scholar]
- 8.Zhang Y., Mazgalev T.N. AV nodal dual pathway electrophysiology and Wenckebach periodicity. J. Cardiovasc. Electrophysiol. 2011;22(11):1256–1262. doi: 10.1111/j.1540-8167.2011.02068.x. [DOI] [PubMed] [Google Scholar]
- 9.Schamroth L., Dove E. The Wenckebach phenomenon in sino-atrial block. Br. Heart J. 1966;28(3):350–358. doi: 10.1136/hrt.28.3.350. [DOI] [PMC free article] [PubMed] [Google Scholar]
- 10.Roberge F.A., Nadeau R.A. The nature of Wenckebach cycles. Can. J. Physiol. Pharmacol. 1969;47(8):695–704. doi: 10.1139/y69-119. [DOI] [PubMed] [Google Scholar]
- 11.Barold S.S., Type I., Type I. Wenckebach second-degree AV block: A matter of definition. Clin. Cardiol. 2018;41(3):282–284. doi: 10.1002/clc.22874. [DOI] [PMC free article] [PubMed] [Google Scholar]


