Abstract
Electrocatalytic oxidation of 5‐hydroxymethylfurfural (HMF) offers a renewable approach to produce the value‐added platform chemical 2,5‐furandicarboxylic acid (FDCA). The key for the economic viability of this approach is to develop active and selective electrocatalysts. Nevertheless, a reliable catalyst evaluation protocol is still missing, leading to elusive conclusions on criteria for a high‐performing catalyst. Herein, we demonstrate that besides the catalyst identity, secondary parameters such as materials of conductive substrates for the working electrode, concentration of the supporting electrolyte, and electrolyzer configurations have profound impact on the catalyst performance and thus need to be optimized before assessing the true activity of a catalyst. Moreover, we highlight the importance of those secondary parameters in suppressing side reactions, which has long been overlooked. The protocol is validated by evaluating the performance of free‐standing Cu‐foam, and CuCoO modified with NaPO2H2 and Ni, which were immobilized on boron‐doped diamond (BDD) electrodes. Recommended practices and figure of merits in carefully evaluating the catalyst performance are proposed.
Keywords: comparison of electrocatalysts, electrocatalysis, HMF oxidation, measurement protocol
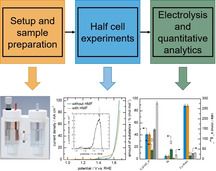
Proposal of a measurement protocol for comparison of electrocatalysts for the HMF oxidation with standard evaluation (yield, faradaic efficiency), as well as a new figure of merit (production rate) to compare catalysts independent from setup size. Additionally, the alkaline degradation of HMF is evaluated and taken into account for closing the mass balance in order to assess the true catalyst activity.
1. Introduction
The search for renewable instead of fossil resources gained attention in recent years, and sustainability and future‐oriented aspects are paramount for chemical processes to replace finite fossil resources.[ 1 , 2 ] To render chemistry more sustainable, there are two possibilities, which attract attention right now: 1) Circular economy, in which waste streams and energy leakages are minimised or even diminished by closing material and energy loops. [3] 2) Sustainable grown biomass as environmentally friendly feedstock, thus utilizing natural materials cycle. [4] Regarding production, use of bio‐based feedstock platform chemicals plays a major role, such as e. g. 5‐hydroxymethylfurfural (HMF) and its oxidation product 2,5‐furandicarboxylic acid (FDCA). [1] HMF itself can be derived from biomass (e. g. C5/C6 sugars [5] ), which is considered a sustainable feedstock. FDCA on the other hand can substitute terephthalic acid, which is produced from crude oil and is primarily used as a precursor for polyethylene terephthalate (PET) that has an annual production of over 50 million tonnes. [6] So HMF oxidation (Figure 1) features one of the most interesting synthesis routes involving a biomass based platform chemical and leading to a highly requested substitute for the polymer sector. [6] Therefore, HMF oxidation attracted a lot of attention in recent years. [7] The oxidation of HMF to FDCA has already been established through thermal catalysis routes, which however involves higher temperatures,[ 8 , 9 ] harsh conditions[ 10 , 11 , 12 ] and/or noble catalyst materials, e. g. Pt supported on carbon [13] or Ru supported on MnCo2O4. [14] These drawbacks can be overcome with an electrocatalytic approach allowing the synthesis at moderate conditions, while the key is to develop highly active and selective electrocatalysts. Nevertheless, reliable performance evaluation of electrocatalysts for the HMF oxidation is largely complicated by the influence and interplay of many secondary parameters, such as identity and concentration of different electrolytes,[ 15 , 16 , 17 , 18 ] electrolyzer configurations (divided [19] and undivided cells [20] ), conductive substrates[ 21 , 22 ] or working electrode materials.[ 20 , 23 ] For instance, a more concentrated KOH electrolyte in principle favours the reaction kinetics of HMF oxidation, [24] however at the same time promotes unwanted spontaneous degradation of HMF to form insoluble humins. [23] The formation of humins and its dependence on pH values of electrolyte significantly influence the product analytics, while these issues are poorly addressed, as reflected by non‐closed mass balance in many studies.
Figure 1.
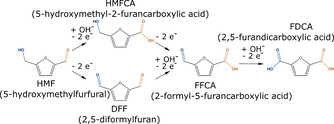
Pathways of HMF oxidation to FDCA. Upper path: Aldehyde oxidation first to 5‐hydroxymethyl‐2‐furancarboxylic acid (HMFCA) further to 2‐formyl‐5‐furancarboxylic acid (FFCA). Lower path: Alcohol oxidation first to 2,5‐diformylfuran (DFF) further to FFCA. Both paths end up with the last oxidation step from FFCA to FDCA.
Besides the influence of KOH concentration, the electrolyzer configuration (undivided vs. divided) is another influencing parameter on the HMF oxidation.
More and more recent studies employ a divided setup, in which the anodic and cathodic compartments are separated by glass frits,[ 17 , 25 ] proton (PEM)[ 19 , 26 ] or anion exchange membranes (AEM).[ 27 , 28 ] However, the rationale for using divided electrolyzers in HMF oxidation remains ambiguous.
Furthermore, if powder catalysts are studied, they are commonly immobilized onto an electrical conducting substrate, which reaches from carbon materials[ 15 , 19 , 26 , 29 ] to transparent conducting materials like FTO (fluorine‐doped tin oxide)[ 16 , 20 ] or metal substrates like nickel‐foam,[ 17 , 18 , 25 , 30 ] copper‐foil [31] or copper‐foam. [22] Nevertheless, the role of the conductive substrate in the HMF oxidation is rarely addressed.
Approaches to assess HMF oxidation catalyst performance can be categorized in two different groups. One category comprises full electrochemical study of possible electrocatalysts and suitable electrochemical conditions to suppress the competing oxygen evolution reaction (OER) in three electrode half‐cell experiments. These studies focus predominantly on electrochemical characterization.[ 19 , 22 , 25 ] The other category is more process oriented where the synthesis of sufficient amounts of products by electrolysis and the full chemical product analysis is in the focus.[ 15 , 17 , 20 , 27 , 32 ]
Nevertheless, for a full assessment of the catalyst performance both approaches need to be combined. All these above aspects need to be comprehensively considered to enable a reliable comparison of electrocatalytic performance.
In this work, a measurement protocol is established and proposed, which accounts for the above‐mentioned influences and can be the basis for proper comparison of different catalytic materials for HMF oxidation. The first part of the study focuses on the suppression of unwanted side reactions, which are not induced intrinsically by the catalyst, but through reaction conditions, electrochemical equipment and materials besides the catalyst employed. The second part develops a two‐step procedure for catalytic testing. While in the first step a suitable potential for testing at optimal selectivity is deduced, electrolysis at constant potential is carried out in a second step and combined with quantitative chemical analytics to derive suitable figure of merits for catalyst comparison.
2. Suppression of Side Reactions not Induced by the Catalyst
First, the non‐electrochemical loss of HMF in KOH electrolyte at varying concentration (0.01, 0.1, 1 and 3 M KOH) without applied potential was studied. All compounds, which do not belong to the reaction network (Figure 1), are defined as losses, as no suitable product will form from these compounds even at longer reaction times. The losses are further divided into “non‐electrochemical losses” (without applied potential) or “electrochemically induced losses” (with applied potential). It needs to be noted, that some losses are polymerized species, which cannot be detected via high performance liquid chromatography (HPLC). As all compounds from the reaction network in Figure 1 are detectable by HPLC, the unknown compounds are assessed by closing the mass balance to the starting amount of HMF to all detected products.
Typical reaction times when applying a potential are up to 120 minutes, thus non‐electrochemical loss was studied in a similar timeframe. Figure 2 (a) shows the change of concentration with time for all KOH concentrations. The study shows that without potential after 1 h already more than 30 %, 10 % and 2.5 % of HMF is degraded in 3, 1 and 0.1 M KOH, respectively. In 0.01 M KOH, no loss is detectable even after 2 h. This observation of higher non‐electrochemical induced losses with higher pH is in accordance to literature. [23] Furthermore, HMFCA can be detected after 120 minutes in 1 M KOH (0.6 %) and 3 M KOH (5 %). Nevertheless, to identify an optimal pH for the catalytic study the rate of non‐electrochemical side product formation compared to the rate of the electrocatalytic main reaction is of interest, as this will determine selectivity. Therefore, an electrochemical HMF oxidation using copper‐foam (Cu‐foam) as anode and platinum (Pt) as cathode was carried out.
Figure 2.
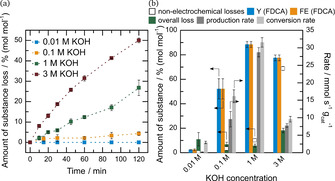
(a) Non‐electrochemical losses of 5 mM HMF in 0.01 (blue), 0.1 (orange), 1 (green) and 3 M KOH (red) at 30 °C. No non‐electrochemical loss was detected for 0.01 M KOH. (b) Yield and faradaic efficiency towards FDCA (Y (FDCA) and FE (FDCA), respectively) are shown in blue and orange with overall loss (green), non‐electrochemical loss for comparison (blank squares), as well as production and conversion rate (dark and light grey, respectively) for complete HMF electrolysis in 0.01, 0.1, 1 and 3 M KOH at 30 °C. A divided setup with a glass frit as separator was used as well as Cu‐foam as anode and platinum as cathode.
The results are given in Figure 2 (b) where chemical yield, faradaic efficiency (FE) for the main product FDCA as well as the overall losses (electrochemical and non‐electrochemical) of HMF to unwanted side products are given for 0.01, 0.1, 1 and 3 M KOH. As additional figure of merit, the conversion rate as well as the production rate of FDCA is given. To account for the strongly differing product reaction rates and to enable a fair comparison of by‐products formed, all experiments were carried out until the amount of charge for ideal full conversion of HMF to FDCA was applied. For 0.01, 0.1, 1 and 3 M KOH this is 250, 90, 45 and 150 minutes, respectively. Figure 2 (b) shows, that the yield, faradaic efficiency and production rate show a clear maximum for 1 M KOH. Thus, from 0.01 to 1 M KOH the prior observed higher rate of non‐electrochemical losses at higher pH are counterbalanced by an even higher rate of the main reaction. When comparing the overall loss, it can be seen that up to 1 M KOH, the losses decrease, but at 3 M KOH strongly increased losses are observed again. This seems to be the reason for the decrease in yield and production rate and for the observed optimum pH. It needs to be noted, that finding the proper pH could be catalyst dependent and it is necessary to identify the optimal pH for every new catalytic system.
Next, it is studied if losses can also stem from electrochemical side reactions at the counter electrode and catalyst support material and if they can be suppressed. First of all, side reactions taking place at the cathode side were studied in 0.1 and 1 M KOH, through removing the glass frit separator of the employed electrochemical cell (undivided cell), and again employing Cu‐foam as anode and Pt as cathode (see Figures S1 and S4 in Supporting Information). The reaction time was slightly shorter when removing the frit (70 vs. 35 minutes in 0.1 and 1 M KOH, respectively). Removing the separator increases the HMF overall loss strongly from 7 % to 44 % for 0.1 M KOH and from 6 % to 25 % for 1 M KOH. Using the separator, the HMF overall loss comprise only the non‐electrochemical losses, which can be seen as minimum losses for these conditions. E.g. for 1 M KOH, the experiment ends after 42 minutes and a loss of 6 % results, which is the same amount observed in Figure 2 (a) for the non‐electrochemical loss. In conclusion, catalyst studies should only be carried out in a divided cell to minimize the cathode induced losses in order to assess the true catalyst activity.
If powder catalysts are studied, they are mostly immobilized onto a substrate with high electrical conductivity, which is also supposed to be chemically inert towards the reaction to avoid any interference when assessing the true performance of a catalyst. The reactivity of different conductive substrates was studied to choose a suitable support for (powder) catalyst and three commonly employed materials were chosen. These are boron‐ doped diamond (BDD), graphite foil and copper‐sheet (Cu‐sheet). The study was carried out in 1 M KOH using a divided cell. First of all, only the bare substrate material without catalyst was studied by recording cyclic voltammograms (CVs) with and without HMF. To better distinguish the HMF oxidation current from the capacitance current and the oxygen evolution reaction (OER) current, the as‐measured voltammetry curves for the HMF oxidation were corrected by subtracting the corresponding voltammetry curves without HMF in the electrolyte (Figure 3 (a)).
Figure 3.
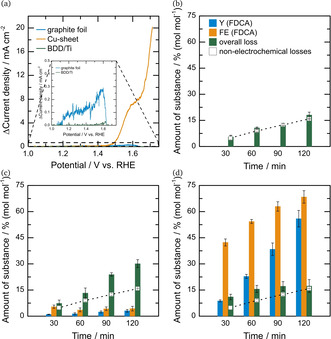
(a) ΔCVs of anode materials by subtracting the CV without HMF from the CV with 5 mM HMF present. (b)–(d) electrolysis results using BDD (b), graphite foil (c) and Cu‐sheet (d) as working electrode vs. Pt in 1 M KOH in a divided cell at 1.6 V vs. RHE after 30, 60, 90 and 120 minutes. Yield and faradaic efficiency towards FDCA (Y (FDCA) and FE (FDCA), respectively) are shown in blue and orange with overall loss (green) and non‐electrochemical losses (blank squares) for comparison reasons. Note, that no additional catalyst was immobilized on the “inert” electrode materials.
It can be clearly seen, that Cu‐sheet is not an innocent support material as a significant HMF oxidation current can be observed. In contrast, BDD was confirmed to be an excellent innocent support in the studied potential regime. For graphite foil, an onset for the HMF oxidation current can be observed, which is however 100 times lower than that for Cu‐sheet.
These observations are affirmed in the electrolysis results of the different electrode materials shown in Figure 3 (b)–(d). Typical reaction times under these conditions are 120 minutes. Besides yield and faradaic efficiency towards FDCA the data for non‐electrochemical losses of HMF in 1 M KOH is given to discuss additional electrochemically induced losses by the supporting material for better understanding. BDD indeed does not contribute to the reaction with no yield or FE towards FDCA, while electrochemically induced losses of HMF are within the measurement error, which is the same as without an applied current (non‐electrochemical losses), as shown in Figure 3 (b). On the contrary, employing graphite foil results in some FDCA formation and a 3 % yield and 4 % faradaic efficiency towards FDCA is observed after 120 minutes. Moreover, a strong increase in electrochemically induced losses is observed (Figure 3 (c)). Compared to the non‐electrochemical losses of HMF (without current applied), the rate of losses towards undetectable species is doubled. Interestingly, for the Cu‐sheet losses after 120 minutes are in the range of non‐electrochemical degradation and thus acceptably low. Furthermore, copper is catalytically active for HMF oxidation and a yield and faradaic efficiency of 56 % and 68 % can be achieved after 120 minutes, respectively. Thus, Cu‐sheet, meshes and foams are potentially promising catalysts toward HMF oxidation but cannot be employed as an inert support.
Summarizing these results, a proper pH value with maximum selectivity needs to be determined for each catalyst. Furthermore, divided cells with a separator need to be employed to suppress undesired side reactions occurring at the cathode. Powder catalysts need to be immobilized on an inert material like BDD, which is inert toward both the main and the side reactions. Subsequent measurements reported in this study were carried out in 1 M KOH, using a divided cell and BDD as conductive substrate material for immobilized catalysts.
3. Assessing Catalytic Activity and Selectivity
After suppressing the side reactions not induced by the catalyst, the above‐mentioned prerequisites are applied and a two‐step measurement protocol for assessing catalyst activity and selectivity is presented. In the first step, three electrode half‐cell experiments are carried out to deduce the potential for optimal selectivity, which differs for different catalysts. The methodology applied and recommended within this study follows the approach presented in literature.[ 33 , 34 ] Therefore, cyclic voltammograms (CV) with 5 mM and without HMF added to the electrolyte are recorded. Using the CV of the experiment without HMF addition as “background” and subtracting it from the CV with HMF addition indicates the regime, where HMF oxidation without parallel OER is taking place. This is shown exemplarily for the powder catalyst CuCoO_P (CuCoO was treated with sodium hypophosphite (NaPO2H2) at 300 °C to obtain CuCoO_P) on BDD as anode and Pt as cathode in Figure 4 (a), showing both CVs and the background subtracted CV in the inset. A clear HMF oxidation peak is observable, where the potential at the maximum of this peak can be deduced as suitable potential for further constant potential electrolysis in the second step (Figure 4 (a), inset, grey arrow). While this methodology assumes, that both reactions are independent from each other, and thus can also be a source of error, it is employed and recommended within this study to quickly identify a suitable potential. A more accurate way would be carrying out several constant potential electrolyses within the region of the HMF oxidation peak with full product analysis, which would slow down catalyst screening tremendously.
Figure 4.
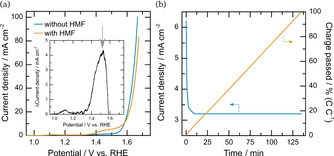
(a) CVs of the powder catalyst CuCoO_P on BDD without (blue) and with HMF (orange), as well as the difference of both (inset) with later electrolysis potential indicated by a grey arrow. (b) Current density (blue) and charge (orange) per time for electrolysis at 1.52 V vs Hg/HgO with Pt cathode electrode in a divided cell.
In a second step, an HMF electrolysis is carried out at the same concentrations and temperatures with the catalytic material, while constant potential electrolysis at the determined potential of optimal selectivity will then be performed until the charge equals 100 % HMF to FDCA conversion. Sometimes, no reference electrode is available in existing electrolysis cells. In this case, the solution resistance, which mostly gives the main contribution to potential losses, should be determined prior and after the experiment and used to correct the applied potential during electrolysis. Figure 4 (b) shows the recorded current density and accumulated charges for the electrolysis experiment for CuCoO_P on BDD with Pt as cathode electrode and operated at 1.52 V vs. RHE (grey arrow). For these electrolysis experiments, the starting as well as final product distribution need to be quantified to calculate yields, losses and faradaic efficiencies.
4. Applying the Proposed Protocol
As an example of the proposed protocol, CuCoO_P, electrodeposited Ni and a Cu‐foam are compared to each other. While CuCoO itself is a well investigated material for the OER, [35] it was shown that treating metal oxides with a phosphorous compound and thus changing its chemical composition led to (higher) activity towards HMF oxidation.[ 17 , 22 , 30 ] Therefore, CuCoO was treated with sodium hypophosphite (NaPO2H2) at 300 °C to obtain CuCoO_P. Further characterization by STEM EDX and Raman can be found in the Supporting Information, Figure S2 and S3. Ni is used in various electrocatalysts as active component for HMF oxidation,[ 19 , 20 , 26 ] therefore it was electrodeposited onto BDD using NiSO4 ⋅ 6 H2O as precursor. Further details for both catalysts can be found in the supporting information. CuCoO_P and Ni are both immobilized on BDD and afterwards compared using divided cells, 1 M KOH electrolyte and a Pt counter electrode. Cu‐foam is also studied as a well‐researched high surface catalyst material to benchmark the HMF oxidation activity. [31]
In step 1, the potential for optimal selectivity is determined in a three‐electrode setup. Figure 4 (a), Figure 5 (a) and (b) reveal, that HMF oxidation takes place prior to the OER in all three catalysts. As optimal potential, 1.52, 1.46 and 1.6 V vs. RHE were deduced for CuCoO_P on BDD (Figure 4 (a), inset, grey arrow), Ni on BDD (Figure 5 (a), inset, grey arrow) and Cu‐foam (Figure 5 (b), inset, grey arrow), respectively. In the second step, electrolysis at these potentials and product quantification were carried out.
Figure 5.
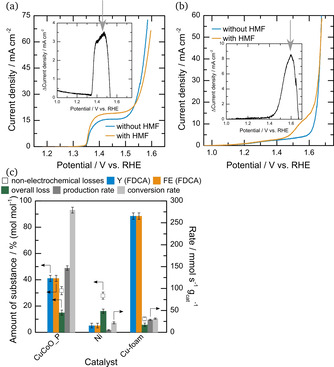
(a) CVs of Ni on BDD without (blue) and with 5 mM HMF (orange), as well as the difference of both (inset) with later electrolysis potential indicated by a grey arrow. (b) CVs of Cu‐foam without (blue) and with 5 mM HMF (orange), as well as the difference of both (inset) with later electrolysis potential indicated by a grey arrow. (c) Yield and faradaic efficiency towards FDCA (Y (FDCA) and FE (FDCA), respectively) are shown in blue and orange with overall loss (green), non electrochemical loss for comparison (blank squares), as well as production and conversion rate (dark and light grey, respectively) for electrolysis of CuCoO_P (left) and Ni (middle) on BDD and Cu‐foam at 1.52, 1.46 and 1.6 V vs. RHE, respectively, with Pt as cathode in a divided cell.
Figure 5 (c) compares the production rate, overall loss as also yields and faradaic efficiencies towards FDCA for these three catalysts. For both catalysts on BDD electrode, CuCoO_P shows the better overall catalytic performance. It reaches a yield and faradaic efficiency towards FDCA of up to 41 %, while in comparison only 5 % yield and faradaic efficiency towards FDCA are obtained on electrodeposited Ni. These results are also in line with the production rate, which is 30 times higher for CuCoO_P (147 mmolFDCA s−1 gcat −1) in comparison to Ni (5 mmolFDCA s−1 gcat −1). Furthermore, the conversion rate shows the same trend with 279 mmolHMF s−1 gcat −1 converted for CuCoO_P and 22 mmolHMF s−1 gcat −1 for Ni. Both catalyst systems needed around 120 minutes to finish electrolysis and also show the same amount of overall loss (15 %), which is in the margin of error for non‐electrochemical losses after 120 minutes (Figure 2 (a)). This result indicates that electro‐chemically induced side reactions play a negligible role during the electrolysis of both catalyst systems.
Comparing both catalysts with Cu‐foam reveals the difference of reaction time for HMF oxidation: Cu‐foam shows an overall loss of just 6 %, which is in the range of non‐electrochemical loss after reaction time (42 minutes) and thus, 88 % selectivity and faradaic efficiency results. The lower production rate of 29 mmolFDCA s−1 gcat −1 compared to CuCoO_P most likely stems from the high specific surface area of the nanoporous CuCoO_P.
5. Conclusions
This work proposes a protocol for objectively evaluating the performance of electrocatalysts toward HMF oxidation. The protocol is validated by comparing the performance of CuCoO_P, and Ni, which were immobilized on BDD electrodes, and free‐standing Cu‐foam, based on which several important observations can be made. First, several secondary parameters including the electrolyte concentration, nature of the conductive substrate for working electrode and electrolyzer configuration (with or without separator) have to be optimized to suppress the spontaneous degradation of HMF through non‐electrochemical side reactions, which hinders a fair comparison of catalysts. It is also disclosed that the degradation of HMF is promoted at the counter electrode (cathode), and therefore an electrolyzer with divided configuration is recommended for the electrolysis experiments (Figure S1). Furthermore, the electrode material, on which the (powder) catalyst is immobilized, has to be catalytically inert toward both the main and/or side reactions, in order to evaluate the intrinsic activity of the catalysts. For this purpose, BDD shows good conductivity as well as little activity (for up to 120 min reaction time) and is therefore suggested as a suitable conductive substrate. Second, half‐cell experiments using three‐electrode configuration should be performed to determine the potential of optimal selectivity. Afterwards, electrolysis is carried out at the potential revealed by half‐cell experiments. Reaction time is limited by the amount of charge that is necessary to theoretically convert 100 % of HMF to FDCA. Third, quantitative product analyses are implemented by collecting samples of the reaction mixture before and after electrolysis. The yield and faradaic efficiency towards the main product FDCA can be determined. Furthermore, overall loss is calculated by closing the mass balance to the starting amount of HMF to all detected products to evaluate the influence of the catalyst system on non‐intended side reactions. An additional figure of merit is introduced by including the production rate, which calculates the catalyst activity regarding reaction time and catalyst mass that is used to compare different catalysts through differently sized setups.
Experimental section
Details on the electrochemical setup, manufacturers and used chemicals can be found in the Supporting Information.
Cyclic voltammograms (CV) were recorded from 0 to 0.8 V vs. Hg/HgO with a scan rate of 20 mV s−1 in 1 M KOH in the presence (5 mM) or absence of HMF, while working and counter electrode area was 0.5 cm2 in 4.5 mL electrolyte. After every CV, electrochemical impedance spectroscopy (EIS) is performed with the frequency rate set from 10 kHz to 1 Hz at 0.6 V vs. Hg/HgO. All CVs have been potential corrected since the current flow through the electrolyte between working and reference electrode results in a potential drop. Compensation has been done using Equation 1. [36]
| (1) |
with as the corrected potential, the potential at which the measurement is performed at and the uncompensated potential with as the current flowing through the electrode and as the uncompensated resistance assessed by EIS. [36]
After detecting the potential of optimal selectivity (U corr.), an electrolysis, which theoretically converts 100 % HMF to FDCA, is executed with working and counter electrode area still kept constant at 0.5 cm2 in 4.5 mL electrolyte. The amount of charge needed is calculated in Equation (2), where is the amount of substance of HMF present at the start of electrolysis (c=5 mM), the number of electrons transferred to oxidize one HMF molecule to one FDCA molecule (for HMF oxidation: =6, Figure 1) and the Faraday constant (96485 C mol−1).
| (2) |
Before and after electrolysis, samples are taken from the reaction mixture, diluted with water and analysed by HPLC (Shimadzu LC‐20 AD) with a Waters ® Symmetry C18 column with 5 μm particle size, 100 Å pore size, 4.6 mm internal diameter and 250 mm length and a UV‐Vis detector (D2 lamp). The used eluent is a 20 : 80 volume ratio mixture consisting of methanol (Acros Organics, 99.8 %) and an aqueous solution of 5 mM ammonium formate (Acros Organics, 97 %), respectively. An extracted chromatogram is shown in Figure S5, where all intended reactants from Figure 1 are detected (retention time in brackets): HMF (17.5 min), DFF (21 min), HMFCA (8.5 min), FFCA (10 min), FDCA (7 min).
Yield and faradaic efficiency towards FDCA (Y (FDCA) and FE (FDCA), respectively) are standard evaluation methods that are already used and can be calculated by Equations (3) and (4), where is the conversion of HMF, the selectivity to FDCA, the amount of FDCA after electrolysis, the number of electrons transferred to oxidize one molecule of HMF to FDCA and the Faraday constant. The term “electrochemically induced losses” comprises all compounds that do not belong to the reaction network (Figure 1) which cannot be detected by HPLC. It can be calculated by the sum of all detected reactants ( ; reactants=HMF, DFF, HMFCA, FFCA, FDCA) subtracted from the initial amount of HMF ( ), Equation (5). Thus, the mass balance is closed. In Equation (6), production rate is introduced as a new figure of merit that includes the amount of FDCA after electrolysis ( ) regarding reaction time ( ) in seconds and catalyst mass ( ) in gram, which is especially useful for comparison of catalysts between differently sized setups. The conversion rate (Equation (7)) is calculated by dividing the difference of and the amount of HMF after reaction ( ) by and again, similar to the production rate.
| (3) |
| (4) |
| (5) |
| (6) |
| (7) |
Cu‐foam is prepared by using a Cu‐sheet as cathode and stainless‐steel mesh (Beisser Metall ®) as anode in a CuSO4 containing aqueous deposition solution. As a standard procedure, a current density of 3 A cm−2 is applied until a charge of 10 C passed, while standard geometric area of the foam is about 0.5 cm2. Ni is prepared similarly by a deposition solution containing NiSO4 and stainless‐steel mesh as anode material again. The main difference to Cu‐foam is the deposition onto BDD with just 5 C passed at a current density of 3 A cm−2. CuCoO_P is synthesized in a two‐step synthesis following two literature protocols. LIKAT in Rostock provided the CuCoO precursor by following their published synthesis route. [37] Afterwards, the sample was thoroughly ground with NaPO2H2 before placing it in a tubular furnace at 300 °C for 2 hours under N2 gas flow. [38] The sample was then washed with water, centrifuged and dried in a vacuum furnace at 80 °C to get the phosphor treated bimetallic system CuCoO_P. [38] Further details to all materials and catalysts can be found in the supporting information.
Conflict of interest
The authors declare no conflict of interest.
Supporting information
As a service to our authors and readers, this journal provides supporting information supplied by the authors. Such materials are peer reviewed and may be re‐organized for online delivery, but are not copy‐edited or typeset. Technical support issues arising from supporting information (other than missing files) should be addressed to the authors.
Supplementary
Acknowledgements
The authors acknowledge the funding from the European Research Council (ERC) under the European Union's Horizon 2020 research and innovation program (grant agreement No. 681719).
S. Wöllner, T. Nowak, G.-R. Zhang, N. Rockstroh, H. Ghanem, S. Rosiwal, A. Brückner, B. J. M. Etzold, ChemistryOpen 2021, 10, 600.
References
- 1. Bozell J. J., Petersen G. R., Green Chem. 2010, 12, 539–554. [Google Scholar]
- 2. Anastas P. T., Warner J. C., Green Chemistry: Theory and Practice, Oxford University Press, 1998. [Google Scholar]
- 3. Geissdoerfer M., Savaget P., Bocken N. M. P., Hultink E. J., J. Cleaner Prod. 2017, 143, 757–768. [Google Scholar]
- 4. Sheldon R. A., Catal. Today 2011, 167, 3–13. [Google Scholar]
- 5. Imhof P., van der Waal J. C., Catalytic process development for renewable materials, John Wiley & Sons, 2013. [Google Scholar]
- 6. Sheldon R. A., Green Chem. 2014, 16, 950–963. [Google Scholar]
- 7. Kwon Y., Schouten K. J. P., van der Waal J. C., de Jong E., Koper M. T. M., ACS Catal. 2016, 6, 6704–6717. [Google Scholar]
- 8. Wan X., Zhou C., Chen J., Deng W., Zhang Q., Yang Y., Wang Y., ACS Catal. 2014, 4, 2175–2185. [Google Scholar]
- 9. Yi G., Teong S. P., Zhang Y., Green Chem. 2016, 18, 979–983. [Google Scholar]
- 10. Rosatella A. A., Simeonov S. P., Frade R. F. M., Afonso C. A. M., Green Chem. 2011, 13, 754–793. [Google Scholar]
- 11. Yu I. K. M., Tsang D. C. W., Chen S. S., Wang L., Hunt A. J., Sherwood J., De Oliveira Vigier K., Jerome F., Ok Y. S., Poon C. S., Bioresour. Technol. 2017, 245, 456–462. [DOI] [PubMed] [Google Scholar]
- 12. Hansen T. S., Sádaba I., García-Suárez E. J., Riisager A., Appl. Catal. A: General 2013, 456, 44–50. [Google Scholar]
- 13. Ait Rass H., Essayem N., Besson M., Green Chem. 2013, 15, 2240–2251. [Google Scholar]
- 14. Mishra D. K., Lee H. J., Kim J., Lee H.-S., Cho J. K., Suh Y.-W., Yi Y., Kim Y. J., Green Chem. 2017, 19, 1619–1623. [Google Scholar]
- 15. Chen H., Wang J., Yao Y., Zhang Z., Yang Z., Li J., Chen K., Lu X., Ouyang P., Fu J., ChemElectroChem 2019, 6, 5797–5801. [Google Scholar]
- 16. Kubota S. R., Choi K. S., ChemSusChem 2018, 11, 2138–2145. [DOI] [PubMed] [Google Scholar]
- 17. Gao L., Bao Y., Gan S., Sun Z., Song Z., Han D., Li F., Niu L., ChemSusChem 2018, 11, 2547–2553. [DOI] [PubMed] [Google Scholar]
- 18. You B., Liu X., Jiang N., Sun Y., J. Am. Chem. Soc. 2016, 138, 13639–13646. [DOI] [PubMed] [Google Scholar]
- 19. Zhang N., Zou Y., Tao L., Chen W., Zhou L., Liu Z., Zhou B., Huang G., Lin H., Wang S., Angew. Chem. Int. Ed. Engl. 2019, 58, 15895–15903. [DOI] [PubMed] [Google Scholar]
- 20. Taitt B. J., Nam D.-H., Choi K.-S., ACS Catal. 2019, 9, 660–670. [Google Scholar]
- 21. Chadderdon D. J., Xin L., Qi J., Qiu Y., Krishna P., More K. L., Li W., Green Chem. 2014, 16, 3778–3786. [Google Scholar]
- 22. Jiang N., You B., Boonstra R., Terrero Rodriguez I. M., Sun Y., ACS Energy Lett. 2016, 1, 386–390. [Google Scholar]
- 23. Vuyyuru K. R., Strasser P., Catal. Today 2012, 195, 144–154. [Google Scholar]
- 24. Davis S. E., Houk L. R., Tamargo E. C., Datye A. K., Davis R. J., Catal. Today 2011, 160, 55–60. [Google Scholar]
- 25. Kang M. J., Park H., Jegal J., Hwang S. Y., Kang Y. S., Cha H. G., Appl. Catal. B: Environmental 2019, 242, 85–91. [Google Scholar]
- 26. Liu W.-J., Dang L., Xu Z., Yu H.-Q., Jin S., Huber G. W., ACS Catal. 2018, 8, 5533–5541. [Google Scholar]
- 27. Latsuzbaia R., Bisselink R., Anastasopol A., van der Meer H., van Heck R., Yagüe M. S., Zijlstra M., Roelands M., Crockatt M., Goetheer E., Giling E., J. Appl. Electrochem. 2018, 48, 611–626. [Google Scholar]
- 28. Liu X., Chi J., Dong B., Sun Y., ChemElectroChem 2019, 6, 2157–2166. [Google Scholar]
- 29. Heidary N., Kornienko N., Chem. Commun. 2019, 55, 11996–11999. [DOI] [PubMed] [Google Scholar]
- 30. You B., Jiang N., Liu X., Sun Y., Angew. Chem. Int. Ed. Engl. 2016, 55, 9913–9917. [DOI] [PubMed] [Google Scholar]
- 31. Nam D.-H., Taitt B. J., Choi K.-S., ACS Catal. 2018, 8, 1197–1206. [Google Scholar]
- 32. You B., Liu X., Liu X., Sun Y., ACS Catal. 2017, 7, 4564–4570. [Google Scholar]
- 33. Brown E. R., McCord T. G., Smith D. E., DeFord D. D., Anal. Chem. 1966, 38, 1119–1129. [Google Scholar]
- 34. Howell J. O., Kuhr W. G., Ensman R. E., Wightman R. M., J. Electroanal. Chem. 1986, 209, 77–90. [Google Scholar]
- 35. Hollmann D., Rockstroh N., Grabow K., Bentrup U., Rabeah J., Polyakov M., Surkus A.-E., Schuhmann W., Hoch S., Brückner A., ChemElectroChem 2017, 4, 2117–2122. [Google Scholar]
- 36. Stevens M. B., Enman L. J., Batchellor A. S., Cosby M. R., Vise A. E., Trang C. D. M., Boettcher S. W., Chem. Mater. 2017, 29, 120–140. [Google Scholar]
- 37. Polyakov M., Surkus A.-E., Maljusch A., Hoch S., Martin A., ChemElectroChem 2017, 4, 2109–2116. [Google Scholar]
- 38. You B., Jiang N., Sheng M., Gul S., Yano J., Sun Y., Chem. Mater. 2015, 27, 7636–7642. [Google Scholar]
Associated Data
This section collects any data citations, data availability statements, or supplementary materials included in this article.
Supplementary Materials
As a service to our authors and readers, this journal provides supporting information supplied by the authors. Such materials are peer reviewed and may be re‐organized for online delivery, but are not copy‐edited or typeset. Technical support issues arising from supporting information (other than missing files) should be addressed to the authors.
Supplementary


