
Figure 1.
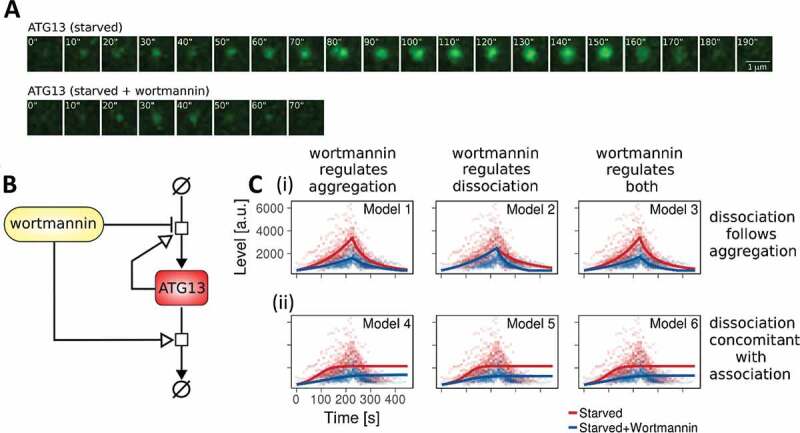
A mathematical model for nonselective autophagy. (A) Representative time-course images of one autophagy event involving the formation and disappearance of a GFP-ATG13 punctum. In the first row, cells are starved. In the second row, cells are starved and treated with wortmannin. (B) Schematic diagram of the mathematical model for nonselective autophagy. Please see the text for details. (C) Parameter fitting for the 6 model variants. (I) The switch between ATG13 accumulation and removal is regulated by events in Models 1–3. (ii) Models 4–6 are eventless. Wortmannin downregulates ATG13 accumulation (Models 1 and 4), ATG13 removal (Models 2 and 5), and both of the reactions (Models 3 and 6). Dots are experimental time points, whereas lines indicate model simulation after parameter estimation. Red indicates starvation; blue indicates starvation plus wortmannin