

ABSTRACT
Energy deprivation activates the cellular energy sensor AMP-activated protein kinase (AMPK), which in turn induces macroautophagy/autophagy. The mitochondrial-associated ER membrane (MAM) plays a key role in mitochondrial division and autophagy, and the mitochondrial fusion protein MFN2 (mitofusin 2) tethers the MAM, but the mechanism by which AMPK and MFN2 regulate autophagy in response to energy stress remains unclear. Here, we found that energy stress not only triggers mitochondrial fission and autophagy, but more importantly increases the number of MAMs, a process that requires AMPK. Interestingly, under energy stress, considerable amounts of AMPK translocate from cytosol to the MAM and the mitochondrion as mitochondrial fission occurs. Unexpectedly, AMPK interacts directly with MFN2. The autophagic ability of mouse embryonic fibroblasts (MEFs) lacking MFN2 (mfn2−/-) is significantly attenuated in response to energy stress as compared to wild-type MEFs (WT MEFs), while re-expression of MFN2 in mfn2−/- cells rescues the autophagy defects of these cells. The abundance of MAMs is also greatly reduced in MFN2-deficient cells. Functional experiments show that the oxygen consumption rate and the glycolytic function of cells lacking MFN2 but not MFN1 are obviously attenuated, and MFN2 is important for cell survival under energy stress. In conclusion, our study establishes the molecular link between the energy sensor AMPK and the MAM tether MFN2, and reveals the important role of AMPK and MFN2 in energy stress-induced autophagy and MAM dynamics.
Abbreviations: ACTB, actin beta; AMPK, AMP-activated protein kinase; BECN1, beclin 1; CANX, calnexin; ER, endoplasmic reticulum; HRP, horseradish peroxidase; EM, electron microscopy; FL, full-length; KD, kinase dead, KO, knockout; MAb, monoclonal antibody; MAMs, mitochondria-associated membranes; MAP1LC3/LC3B, microtubule associated protein 1 light chain 3; MFN2, mitofusin 2; OPA1, OPA1 mitochondrial dynamin like GTPase; PAb, polyclonal antibody; PtdIns3K, class III phosphatidylinositol 3-kinase; PtdIns3P, phosphatidylinositol 3-phosphate; SD, standard deviation; TEM, transmission electron microscopy; TOMM20, translocase of outer mitochondrial membrane 20; ULK1, unc-51 like autophagy activating kinase 1; MEF, mouse embryonic fibroblast; WT, wildtype
KEYWORDS: AMPK, autophagy, MAM, metformin, MFN2, mitochondrial fission
Introduction
AMPK is an energy sensor that controls turnover of cellular materials and metabolism in eukaryotic cells [1,2]. Its holoenzyme is composed of one catalytic subunit, PRKAA/AMPKα, and two regulatory subunits, PRKAB/AMPKβ and PRKAG/AMPKγ [2]. Dysregulation of AMPK is involved in a number of cellular pathophysiological processes, such as diabetes, cancer, obesity, cardiovascular disease, etc [3–5]. In general, AMPK can be activated in two cases: an increased AMP:ATP ratio [6], and glucose deprivation [7]. In the early stage of autophagy, AMPK either activates ULK1 [8] and BECN1 via direct phosphorylation [9–11], or represses MTOR signaling via phosphorylating Raptor [12]. Under energy-deprivation conditions, AMPK regulates mitochondrial fission and mitophagy by phosphorylating the mitochondrial fission receptor MFF [13].
Mitochondria form a dynamic network in which fission, fusion, aggregation, and mitophagy occur. Mitochondria are in a constant balance of division and fusion, which is essential to maintain the quality and quantity of mitochondria [14,15]. Outer mitochondrial membrane fusion is mediated by MFN1/2 [16,17], and inner mitochondrial membrane fusion is mediated by OPA1 [18,19]. The proteins that mediate mitochondrial division are MFF [20,21], DNM1 L/DRP1 [22], MIEF1/Mid51-MIEF2/MiD49 [23], and possibly FIS1 [24]. MFN1 and MFN2 form homodimers or heterodimers on two closely adjacent mitochondria to complete the fusion of the outer mitochondrial membrane [17]. In MFN2 knockout cells, however, mitochondria swell and fragment. In addition to being associated with each other, mitochondria also contact a variety of other organelles, one of which is the endoplasmic reticulum (ER) [25]. The MAM is a specialized membrane region consisting of both mitochondria and ER, which are very close to each other. There is a certain spatial distance between the two organelles, and the distance and dynamic changes influence the physiological functions of the MAM, such as calcium ion exchange, lipid transfer and metabolism [26,27].
Recent studies show that the MAM marks both the initiation site of autophagosome formation and the location of mitochondrial division [28,29]. In addition to being an essential mitochondrial fusion protein, MFN2 is also a MAM protein and is responsible for tethering the ER and mitochondria [30]. Some studies have shown that MFN2 is required for MAM formation, while others propose that it is a negative regulator of the MAM [31,32]. Therefore, the functional role of MFN2 in formation and structural maintenance of the MAM is still controversial. Since the MAM is the point where autophagy occurs, it is possible that MFN2 may be involved in the regulation of autophagy. Previous studies have reported that MFN2 participates in autophagy in cardiomyocytes, and the authors observed the accumulation of autophagosomes in MFN2 KO cardiomyocytes, which appears to be caused by impaired fusion of autophagosomes with lysosomes in the absence of MFN2 [33]. MFN2 is also engaged in the aging process of skeletal muscle by regulating mitochondrial autophagy [34]. However, it is still unclear exactly how MFN2 is involved in the autophagy process and whether it is regulated by the upstream signals in the autophagy pathway. As mentioned above, AMPK is responsible for both autophagy induction and mitochondrial fission in energy-deprived cells, and the MAM is involved in both these processes, but it is largely unknown how AMPK regulates the MAM.
Here, we found that a considerable amount of AMPK associates with the MAM and the divided mitochondria under energy stress. We also found that AMPK binds directly to the MAM tether MFN2 and they are both involved in MAM formation. We systematically explored the effects of the AMPK-MFN2 signaling axis on dynamic changes of mitochondria, autophagy and MAMs in response to energy stresses.
Results
Energy stress promotes MAM formation, autophagy and mitochondrial fission
We first systematically observed the changes of the number of MAMs, the autophagy level and the mitochondrial morphology in cells under energy deprivation conditions induced by either metformin or rotenone (both of which inhibit complex I of the electron transport chain) [35–37]. As a control, cells were also subjected to the nutrient-starvation condition. Tong et al. successfully established a fluorescence-based assay to mark the MAM [38]. They constructed a luminescent split protein system with one part residing in the ER and the other part residing in the mitochondria. Only when mitochondria and the ER are close enough will these two parts form a complete and functional protein, spGFP. The GFP puncta therefore mark the MAMs within the cell [38].
A significant increase in the number of MAMs and mitochondrial fragmentation was observed after treatment of U2OS and HeLa cells with metformin (0.2 mM), rotenone (100 ng/ml), which indicated that energy stress increased the contact sites between mitochondria and ER within the cell (Figure 1 A–D). Of note, the abundance of MAMs also increased when cells were subjected to starvation condition (in EBSS medium). However, mitochondria were still elongated under this condition (Figure 1 A–D). Next, we examined the influence of energy stresses on autophagy in rfp-gfp-LC3-expressed HeLa or U2OS cells. This dual-color fluorescence plasmid enabled us to measure the autophagy flux in cells because the GFP-LC3 signal will be quenched in lysosomes in normal conditions. Starvation, metformin or rotenone clearly induced a dramatic increase of red LC3 puncta and a much less of green LC3 dots, indicating the increase of the autophagy flux (Figure 1 E–H). Consistent with these results, western blots have shown that in HeLa cells treated with either drug, the autophagy substrate SQSTM1/p62 decreased after 8 h, and the LC3-II:LC3-I ratio gradually increased while the total level of LC3 gradually decreased after 2 h (Figure 1 I–J). The degradation of both SQSTM1 and LC3 was blocked by bafilomycin A1 (Baf-A1, 100 nM), the lysosome V-ATPase inhibitor, which indicated that both drugs increased the autophagy flux (Figure 1 I–J). Of note, the cellular degradation of LC3 and SQSTM1 induced by metformin lagged behind that induced by rotenone (Figure 1 I–J).
Figure 1.
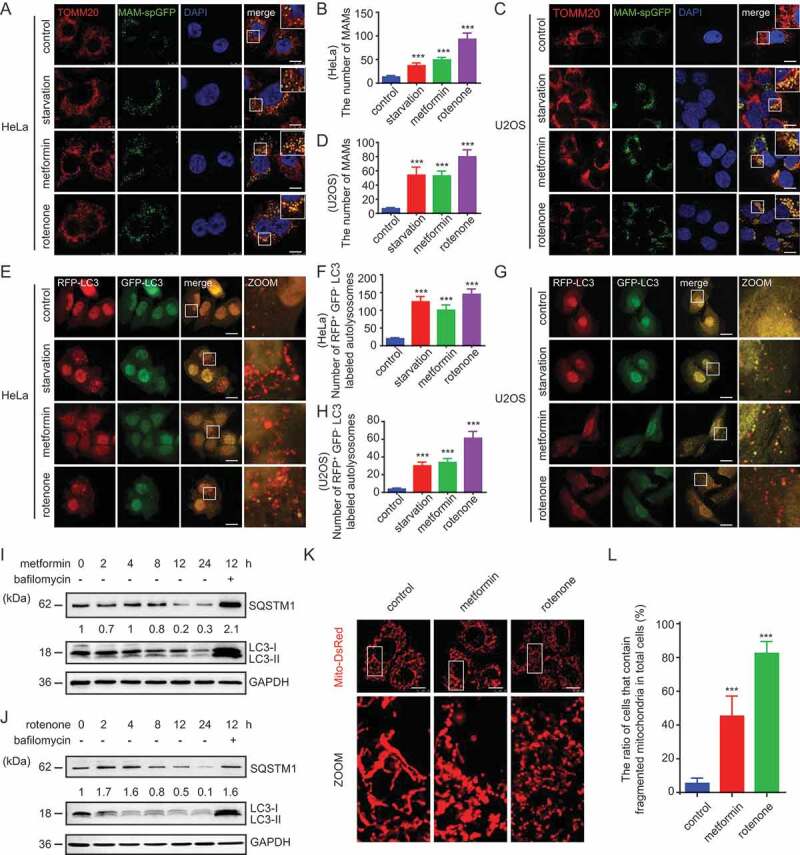
Energy stress promotes MAM formation, autophagy and mitochondrial fission. (A and C) HeLa (A) or U2OS (C) cells expressing the split-GFP MAM reporter were treated with EBSS (starvation), 0.2 mM metformin or 100 ng/ml rotenone for 6 h. Cells were fixed and subjected to immunofluorescence (IF) analysis to detect the mitochondria (anti-TOMM20 antibody, red) or MAM dots (green). White boxed regions in the panels are enlarged. Scale bar: 10 μm. (B and D) Quantification of (A and C). The MAMs were counted and quantified in at least 30 randomly picked cells. *** p < 0.001 vs. control. (E and G) HeLa (E) or U2OS (G) cells expressing rfp-gfp-LC3 were treated with EBSS, 0.2 mM metformin or 100 ng/ml rotenone for 6 h. Cells were fixed and subjected to immunofluorescence (IF) analysis to detect autophagosomes. White boxed regions in the panels are enlarged. Scale bar: 10 μm. (F and H) Quantification of (E and G). The rfp-positive and gfp-negative LC3-labeled autolysosomes were counted and quantified in at least 30 randomly picked cells. *** p < 0.001. (I and J) HeLa cells were treated with (I) 0.2 mM metformin or (J) 100 ng/ml rotenone for 0, 2, 4, 8, 12, or 24 h with or without 100 nM Baf-A1 as indicated. Cells were then harvested and examined by western blot (WB) analysis with anti-LC3, anti-SQSTM1, or anti-GAPDH. The SQSTM1 and GAPDH bands were analyzed by densitometry using ImageJ software. The ratio of SQSTM1:GAPDH was relative quantified. (K) HeLa cells expressing Mito-DsRed were treated with the indicated combinations of 0.2 mM metformin or 100 ng/ml rotenone for 6 h. Cells were fixed and subjected to IF analysis to detect mitochondria. White boxed regions in the panels are enlarged. Scale bar: 10 μm. (L) Quantification of (K). The ratio of cells that contain fragmented mitochondria in total cells were quantified. At least 100 cells were counted for each treatment. *** p < 0.001
We then observed the changes of mitochondrial morphology in HeLa cells under energy stress. Similar to Figure 1 A,C, mitochondrial fission occurred after treatment with both drugs, but rotenone induced mitochondrial fission to a greater extent than metformin (Figure 1 K,L).
Altogether, these results showed that energy stress can increase the number of MAMs, induce autophagy, and promote mitochondrial division.
The induction of autophagy and MAMs by energy stress depends on AMPKα1
Previous studies have shown that mitochondria accumulate in AMPK knockout cells, suggesting that AMPK regulates the autophagic removal of mitochondria [8,39]. Because the MAM is the autophagosome initiation site, we wanted to know whether AMPK modulates MAMs and autophagy. In HeLa cells with stable knockdown of PRKAA1/AMPKα1 (sh-AMPKα1), we failed to see prominent LC3 puncta and MAM-spGFP dots under normal conditions even when WT or kinase-dead PRKAA1/AMPKα1 was re-expressed (Figure 2 A,B,Figure 2E). However, when WT HA-PRKAA1/AMPKα1 was re-introduced into sh-PRKAA1/AMPKα1 cells treated with metformin or rotenone, MAMs were significantly induced (Figure 2 A,B,Figure 2E). This increase of MAMs did not occur in sh-AMPKα1 cells re-expressing the AMPKα1 kinase-dead mutant (Figure 2 A,B,Figure 2E).
Figure 2.
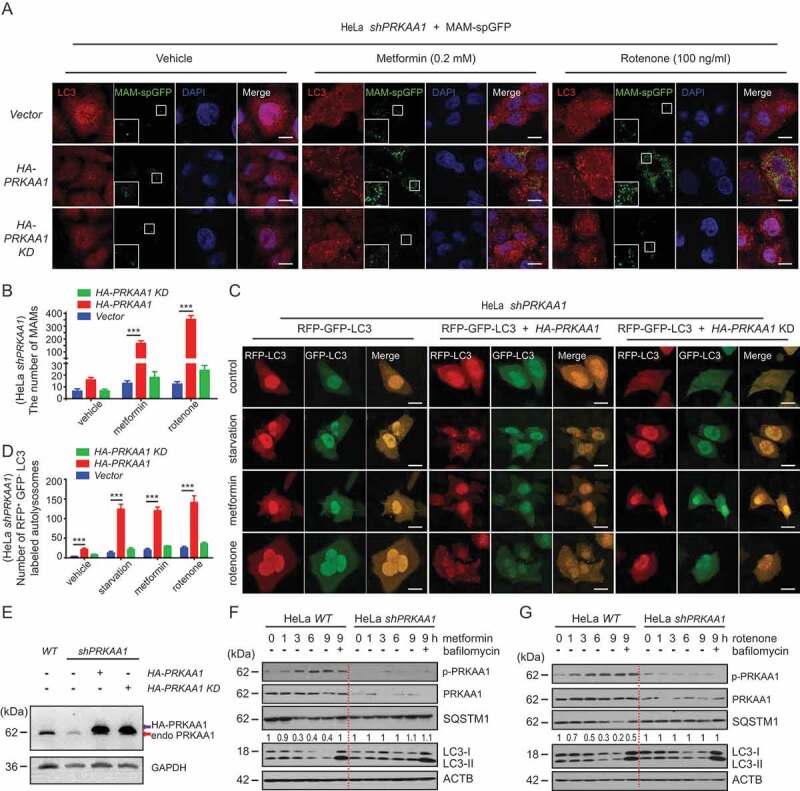
AMPK is important for MAM formation and autophagy induction under energy stress. (A) sh-AMPKα1 HeLa cells were transfected with MAM-spGFP, MAM-spGFP + HA-AMPKα1, or MAM-spGFP + HA-AMPKα1 kinase dead mutant. Cells were subsequently cultured under normal conditions, incubated with 0.2 mM metformin or incubated with 100 ng/ml rotenone. After 6 h, cells on coverslips were fixed and subjected to IF analysis to detect LC3 (anti-LC3 antibody, red) or MAM-spGFP dots (green). White boxed regions in the panels are enlarged. Scale bar, 10 μm. (B) Quantification of (A). The number of MAMs were counted and quantified in at least 30 randomly picked cells for each treatment. All data are from three independent experiments (mean ±S.D.). *** p < 0.001. (C) Sh-AMPKα1 HeLa cells were transfected with rfp-gfp-LC3, rfp-gfp-LC3 + HA-AMPKα1, or rfp-gfp-LC3 + HA-AMPKα1 kinase dead mutant. Cells were subsequently cultured under normal conditions, incubated with 0.2 mM metformin or incubated with 100 ng/ml rotenone, or cultured in EBSS medium. After 6 h, cells on coverslips were fixed and subjected to IF analysis to detect autophagy flux. Scale bar: 10 μm. (D) Quantification of (C). The number of rfp-positive and gfp-negtive LC3-labeled autolysosomes were counted and quantified in at least 30 randomly picked cells for each treatment. All data are from three independent experiments (mean ±S.D.). *** p < 0.001. (E) Knockdown of AMPKα1 and expression of HA-AMPKα1 or the HA-AMPKα1 kinase dead mutant in (A and C) were confirmed by WB. Endo AMPKα1 (red arrow) is endogenous AMPKα1. HA-AMPKα1 (black arrow) is HA-AMPKα1 or HA-AMPKα1 kinase dead. (F and G) Metformin (0.2 mM, F) or rotenone (100 ng/ml, G) was used to treat sh-control or sh-AMPKα1 stable knockdown HeLa cells for 0, 1, 3, 6, or 9 h with or without Baf-A1 (100 nM) as indicated. Cells were harvested and subsequently examined by WB with anti-phospho-AMPK (S172), AMPK, SQSTM1, LC3, or ACTB antibodies. The SQSTM1 and ACTB bands were analyzed by densitometry using ImageJ software. The ratio of SQSTM1/ACTB was relative quantified
In response to starvation, metformin or rotenone, the autophagy flux was inhibited in sh-AMPKα1 cells (Figure 2 C–E). The autophagy flux could be rescued in cells re-expressing HA-AMPKα1 plasmid but not the kinase-dead form of AMPKα1 (Figure 2 C–E). Similar results were also observed in immunoblotting, where the degradation of SQSTM1 was blocked in sh-AMPKα1 cells but not in cells stably expressing a scrambled sh-AMPKα1 (Figure 2 F,G).
These data suggest that AMPK plays an important role in regulating autophagy and MAM formation.
A considerable amount of AMPKα1 translocates from cytosol to MAMs and mitochondria in response to energy stress
We showed above that AMPKα1 is required for the increase of the number of MAMs under energy stress, so we further studied the relationship between AMPKα1 and the MAM under energy stress conditions. Ten T72 cm flasks of cells were treated with or without metformin (0.2 mM) or rotenone (100 ng/ml) for 6 h and then harvested. The MAM fraction, the mitochondrial fraction, the ER fraction and the post-nuclear supernatant (PNS) were purified according to established protocols [40,41] and analyzed by immunoblotting. In un-treated cells, AMPKα1 appeared in the cytosolic fraction, the MAM fraction, and the mitochondrial fraction, while after metformin or rotenone treatment, a considerable amount of AMPKα1 was re-distributed from the cytosol to the MAM and the mitochondrial fraction (Figure 3 A,B). In the PNS fraction from metformin- or rotenone- treated cells, there was an increased level of AMPKα1 phosphorylated at serine 172, which suggests that metformin or rotenone successfully activated AMPKα1 (Figure 3 A,B). Of note, the cytoskeleton protein ACTB was not present in the MAM fraction, mitochondrial fraction, or the ER fraction, whereas the previously reported MAM marker proteins MFN2 [30] and ASCL-4 were enriched in not only the MAM fraction but also in mitochondrial fraction [28,40,41]. In addition, we only detected the traces of mitochondrial inner-membrane protein TIM23 in the MAM fraction, but it strongly appeared in the mitochondrial fraction. Moreover, the ER marker, CANX (calnexin), was enriched in the ER fraction but barely presented in the MAM fraction or mitochondrial fraction, further indicating the high purity of the MAMs, the ER and the integrity of the isolated mitochondria (Figure 3 A,B).
Figure 3.
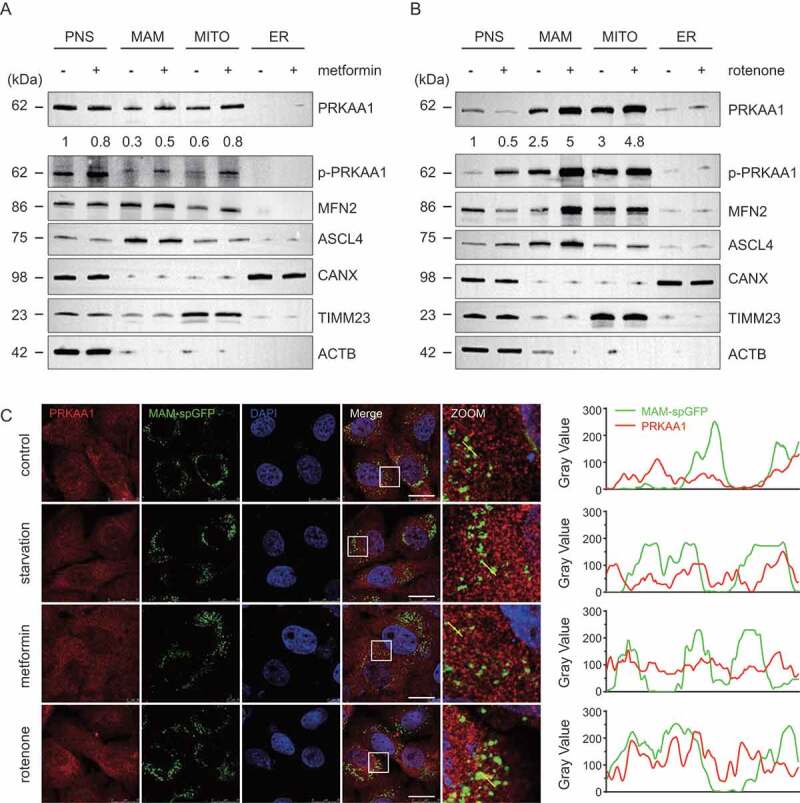
Considerable amounts of AMPK translocate from cytosol to MAMs and mitochondria in response to energy stress. (A and B) Metformin (0.5 mM, A) or rotenone (100 ng/ml, B) was used to treat ten T72 cm bottles of HeLa cells for 6 h and then cells were harvested, homogenized and dounced. The PNS, MAMs, ER and mitochondria were separated and purified according to previously established protocols. After purification, samples were analyzed by WB using antibodies against phospho-AMPK (S172), AMPK, MFN2, ASCL-4, CANX, TIM23 and ACTB. The AMPK bands relative quantification were analyzed by densitometry using ImageJ software. (C) HeLa cells expressing the split-GFP MAM reporter were treated with EBSS, 0.2 mM metformin or 100 ng/ml rotenone for 6 h and subsequently were fixed and subjected to IF analysis to detect the AMPK (anti-AMPK antibody, red) or MAM dots (green). White boxed regions in the panels are enlarged. Scale bar: 10 μm. Yellow line were analyzed by line profile using Image-Pro Plus software
Consistent with the fractionation results, immuno-fluorescence showed that there was a certain amount of AMPKα1 re-distributed to the MAM after starvation, metformin, or rotenone treatment (Figure 3C).
AMPKα1 interacts with and phosphorylates MFN2
Since AMPKα1 appeared in the MAM, and is important for autophagy induction and MAM formation, we next tested whether AMPK is bound to the MAM tether MFN2. AMPK is composed of AMPKα, β, and γ subunits. In cells expressing Myc-MFN2, co-immunoprecipitation experiments showed that endogenous AMPKα1, rather than β1 or γ1, is present in the MYC-MFN2 complex precipitated using an anti-Myc antibody (Figure 4A). Conversely, endogenous MFN2 was co-precipitated by an anti-HA antibody in cells are expressing HA-AMPKα1 (Figure 4B). We then tested the interaction of MFN2 and AMPKα1 in the presence or absence of metformin. As shown in Figure 4C, anti-AMPKα1 was capable of pulling down the endogenous MFN2 in the presence or absence of metformin (Figure 4C). Less MFN2 was precipitated in the presence of metformin (Figure 4C).
Figure 4.
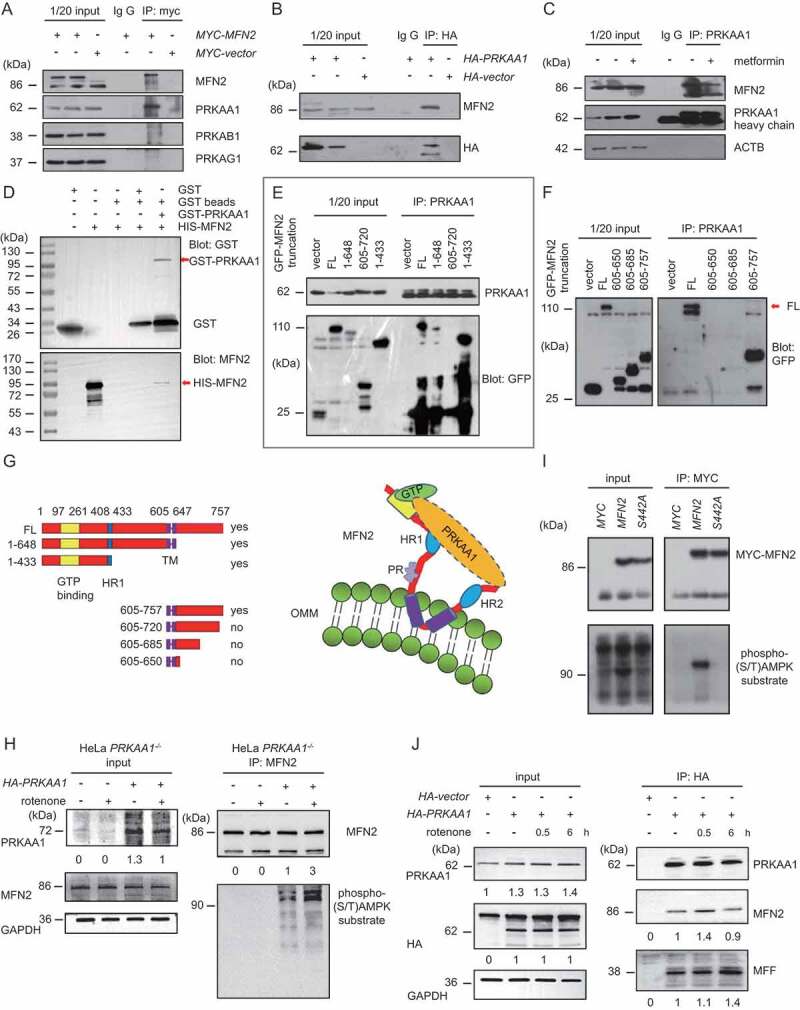
AMPKɑ1 interacts with MFN2. (A) HeLa cells were transfected with Myc-MFN2 or Vector control. After 24 h, cells were harvested, lysed and centrifuged. The supernatant was immunoprecipitated by IgG or anti-Myc antibody. Samples were subsequently separated by SDS-PAGE and subjected to WB analysis using antibodies against MFN2, AMPKα1, β1, or γ1. (B) HeLa cells were transfected with HA-AMPKα1 or Vector control. After 24 h, cells were harvested, lysed and centrifuged. The supernatant was immunoprecipitated by IgG or anti-HA antibody. Samples were subsequently separated by SDS-PAGE and subjected to WB analysis using antibodies against MFN2, AMPKα1. (C) HeLa cells were treated with metformin (0.2 mM) for 6 h, and then harvested, lysed, and centrifuged. The supernatant was immunoprecipitated by IgG or anti-AMPK antibody. Samples were subsequently separated by SDS-PAGE and subjected to WB analysis using antibodies against MFN2, AMPKα1, p-AMPKα1, and ACTB. (D) GST, GST-AMPK, or His-MFN2 was expressed in E. coli. BL21 and purified. Samples were subjected to GST-pulldown assay and probed with anti-GST or anti-MFN2 antibody. (E and F) HeLa cells were transfected with GFP Vector or constructs expressing GFP-tagged full-length MFN2 or indicated truncations of MFN2. Immunoprecipitation was performed using anti-AMPKα1 antibody. Samples were analyzed by western blotting using anti-AMPKα1 or anti-GFP antibody. FL, full length. (G) Cartoon showing the different GFP-MFN2 constructs and the interaction of MFN2 with AMPKα1. (H) AMPK−/- MEFs were transfected with or without HA-AMPK. After 24 h, cells were treated with or without rotenone (100 ng/ml) for another 6 h, and then harvested, lysed and centrifuged. The supernatant was immunoprecipitated by anti-MFN2 antibody. Samples were subsequently separated by SDS-PAGE and subjected to western blot analysis using antibodies against MFN2, AMPKα1, Phosphorylated (S/T) AMPK substrate and GAPDH. The AMPKα1, Phosphorylated (S/T) AMPK substrate, GAPDH, and immunoprecipitated MFN2 bands were analyzed by densitometry using ImageJ software. The ratio of AMPKα1:GAPDH and Phosphorylated (S/T) AMPK substrate:MFN2 were relatively quantified. (I) HeLa cells were transfected with vector control, MYC-MFN2 or MYC-MFN2S442A, respectively. After 24 h, cells were harvested, lysed and centrifuged. The supernatant was immunoprecipitated by anti-MYC antibody. Samples were subsequently separated by SDS-PAGE and subjected to western blot analysis using antibodies against MYC, Phosphorylated (S/T) AMPK substrate. (J) HeLa cells were transfected with HA-AMPK or HA Vector. After 24 h, cells were treated with/without rotenone (100 ng/ml) for 0.5 h or 6 h, and then harvested, lysed and centrifuged. The supernatant was immunoprecipitated by anti-HA antibody. Samples were subsequently separated by SDS-PAGE and subjected to western blot analysis using antibodies against MFN2, AMPKα1, HA, MFF and GAPDH. The AMPKα1, HA-AMPK, GAPDH, MFN2 and MFF bands were analyzed by densitometry using ImageJ software. The ratio of AMPKα1:GAPDH, HA-AMPKα1:GAPDH, MFN2, as well as MFF were relatively quantified
In order to further verify whether the interaction between AMPK and MFN2 is direct or not, we constructed GST-AMPKα1 and His-MFN2 plasmids, expressed them in Escherichia coli and purified the proteins. Pulldown experiments confirmed that AMPKα1 and MFN2 directly interact (Figure 4D). Finally, we used deletion mapping to identify the positions within MFN2 that bind to AMPKα1. We constructed GFP fusion proteins of full-length MFN2 and the deletions 1–648, 1–433, 605–650, 605–685, 605–720, and 605–757. In addition to the full-length MFN2, AMPKα1 bound to MFN2 (1–648) and (1–433) (Figure 4E). C-terminal MFN2 (605–720) failed to interact with AMPKα1 (Figure 4E). However, MFN2 (605–757), with a completely intact C-terminal region, had a strong interaction with AMPKα1 (Figure 4 E–F). The different MFN2 constructs and the AMPK-MFN2 interaction are shown in Figure 4G.
Next, we wanted to know whether AMPKα1 is capable of phosphorylating MFN2. MFN2 was immunoprecipitated from vehicle- or rotenone-treated AMPKα1−/- MEFs, which were re-transfected with HA Vector or HA-AMPKα1 respectively. The MFN2 phosphorylation was then examined by Phospho-AMPK Substrate Motif [LXRXX(pS/pT)] MultiMabTM Rabbit mono-clonal antibody, allowing the specific recognition of substrates of AMPK. As shown in Figure 4H, in HA-transfected cells, no phosphorylation could be detected, yet in HA-AMPKα1-transfected cells, a weak MFN2-specific phosphorylation band appeared, which became much stronger upon rotenone-treatment (Figure 4H). In addition, we have analyzed the protein sequence of Mfn2 and found that it contains a non-classic phospho-AMPK substrate motif, IRRLSVL (amino acid sequence 438–444). We then generated S442A mutation plasmid and compared its phosphorylation with WT MFN2 by using Phospho-AMPK Substrate Motif [LXRXX(pS/pT)] MultiMabTM Rabbit mAb. Compared with WT myc-mfn2, myc-mfn2S442A abolished the phosphorylation of immunoprecipitated Myc-MFN2, strongly suggesting that AMPK phosphorylates MFN2 (Figure 4I).
We also performed a time-course experiment in PRKAA1/AMPKα1-KO cells with or without re-transducing HA-PRKAA1/AMPKα1, demonstrating that PRKAA1/AMPKα1 initially had a strong interaction with MFN2 in a shorter time of treatment with rotenone (0.5 h). However, less interaction with MFN2 but a stronger binding to MFF was observed upon a prolonged treatment with rotenone (6 h), suggesting that in the later phase of energy stress condition, more AMPKα1 tended to bind to fission factor MFF to mediate mitochondrial fission. So, the pool of MFN2-associated AMPKα1 became less than that in the later stage of treatment (Figure 4J).
Taken together, the data demonstrates that AMPKα1 not only interacts with MFN2, but also phosphorylates it, and both the N-terminal (1–433) and C-terminal (605–757 regions of MFN2 can bind to AMPKα1.
Impairment of both autophagy and formation of MAMs in Mfn2-depleted cells under energy stress
In view of the importance of AMPK to autophagy, the presence of AMPKα1 and MFN2 in the MAM, and the direct interaction between MFN2 and AMPKα1, we next examined the role of MFN2 in autophagy and MAM formation under energy-deprivation conditions. When MFN2 control MEFs were treated with rotenone or metformin, the level of SQSTM1 gradually reduced with time and reached a minimum at 6 h (Figure 5 A,B). In contrast, in mfn2−/- MEFs, the total amount of SQSTM1 did not decrease during the experiment. Overall, the levels of LC3-I, LC3-II, and SQSTM1 are much higher in mfn2−/- cells than in WT mfn2cells (Figure 5 A,B). The results were further verified by immunofluorescence microscopy. We found that the ratio of rfp positive and gfp negative LC3-labeled autolysosomes in energy-depleted MFN2 control MEFs increased significantly compared to the mfn2−/- MEFs (Figure 5 C,D). This suggests that cellular autophagy is active and the autophagy flux is normal in MFN2 control cells (Figure 5 C,D). There was no significant increase of LC3 dots after metformin or rotenone stimulation in mfn2−/- cells, which suggests that energy stress failed to induce autophagy in mfn2−/- cells (Figure 5 C,D). Electron microscopy demonstrated that some enlarged lysosomes appeared in mfn2−/- cells, but not in control cells, under normal conditions (Figure 5E). Under energy deprivation conditions, abnormally enlarged lysosome-like structures accumulated in mfn2−/- cells (Figure 5E). These results suggest that MFN2 deficiency lowered the autophagy activity in energy-stressed cells.
Figure 5.
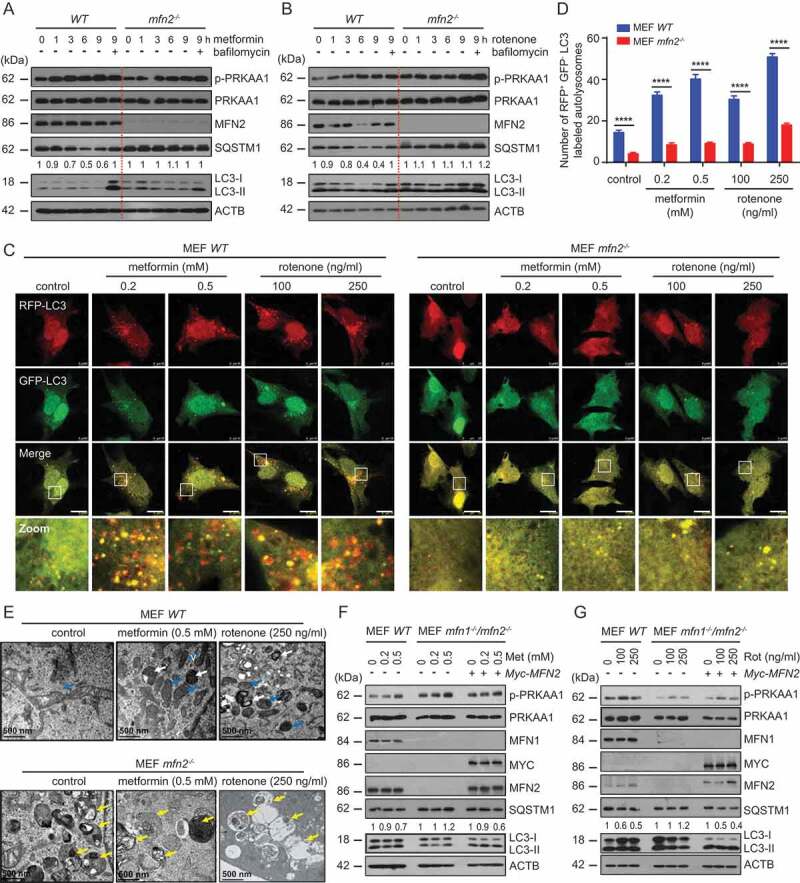
Impairment of autophagy in mfn2−/- MEFs under energy stress. (A and B) metformin (0.2 mM, A) or rotenone (100 ng/mL, B) was used to treat WT Mfn2 or mfn2−/- MEFs for 0, 1, 3, 6, or 9 h with or without BafA1 (100 ng/mL) as indicated. Cells were harvested and subsequently examined by WB with antibodies against phospho-AMPK (S172), AMPK, SQSTM1, LC3, or ACTB antibodies. The SQSTM1 and ACTB bands were analyzed by densitometry using ImageJ software. The ratio of SQSTM1:ACTB was relative quantified. (C) WT or mfn2−/- MEFs were transfected with rfg-gfp-LC3. After 24 h, they were treated with vehicle (control), metformin (0.2, 0.5 mM) or rotenone (100, 250 ng/ml) for 6 h. Subsequently, cells on coverslips were fixed and subjected to IF analysis to detect autophagosomes. White boxed regions in the panels are enlarged. Scale bar: 10 μm. (D) The number of rfp-positive and gfp-negative LC3 autolysosomes were counted and quantified in at least 30 randomly picked cells for each treatment. *** p < 0.001. (E) WT or mfn2-/- MEFs were left untreated or treated with 0.5 mM metformin or 250 ng/ml rotenone. Samples were subsequently examined by EM. White arrows indicate lysosomes. Blue arrows indicate mitochondria. Yellow arrows indicate enlarged lysosomes. (F and G) WT or mfn1−/-/2−/- MEFs were treated with or without metformin (0.2, 0.5 mM, F) or rotenone (100, 250 ng/ml, G). Subsequently, the samples were harvested and examined by WB analysis with the indicated antibodies
In order to further dissect the specific role of MFN2 in autophagy, mfn1−/-/2−/- MEFs were transfected with a plasmid expressing myc-mfn2 or a control plasmid, and autophagy activity was evaluated. As shown in Figure 5 F,G, rotenone or metformin induced SQSTM1 degradation and the LC3-I to LC3-II transition only in the cells expressing MYC-MFN2.
Next, we wanted to evaluate the role of MFN2 in MAMs formation. Because U2OS cells stably express MAM-spGFP, MFN2 has been knocked down in these cells (Figure 6C), which enabled us to measure the abundance of MAMs more easily. The formation of MAMs was significantly suppressed in sh-mfn2 U2OS cells compared to sh-control cells (Figure 6 A,B).
Figure 6.
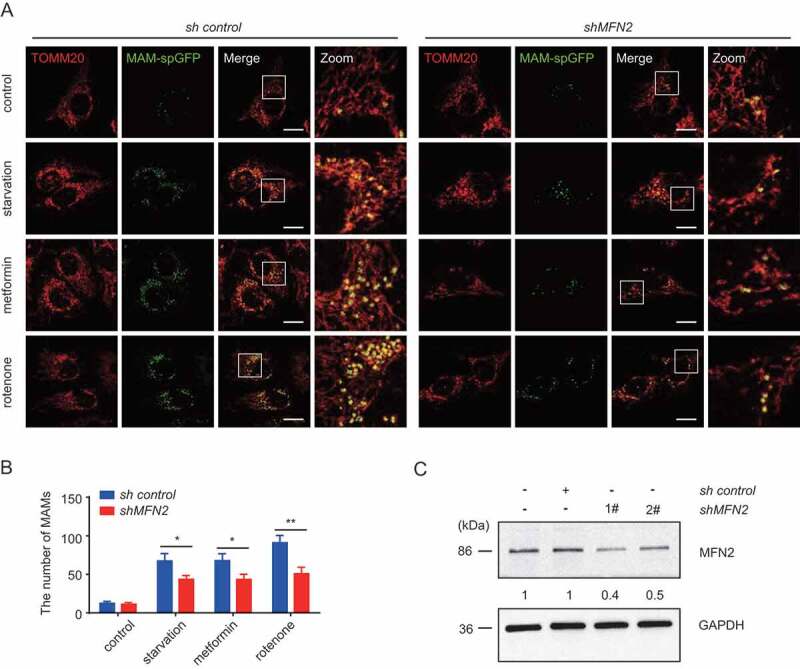
Impairment of MAMs in MFN2-depleted cells under energy stress. (A)U2OS cells stably expressing the split-GFP MAM reporter were transfected with sh control or shMFN2. After 24 h, they were treated with EBSS, 0.2 mM metformin or 100 ng/ml rotenone for 6 h. Cells were fixed and subjected to IF analysis to detect the mitochondria (anti-TOM20 antibody, red) or MAM dots (green). White boxed regions in the panels are enlarged. Scale bar: 10 μm. (B)Quantification of (A). The MAMs were counted and quantified in at least 30 randomly picked cells. *** p < 0.001 vs. control. (C) U2OS cells stably expressing the split-GFP MAM reporter were transfected with or without sh control or shMFN2 1# or 2#. Subsequently, the samples were harvested and examined by WB analysis with antibodies against MFN2 and GAPDH antibodies. The MFN2 and GAPDH bands were analyzed by densitometry using ImageJ software. The ratio of MFN2:GAPDH was relative quantified
The role of MFN2 in glycolysis, mitochondrial respiration, and cell survival in response to energy stress
We next asked if MFN2 is important for mitochondrial respiration, glycolysis, and cell survival under energy deprivation conditions. Indeed, loss of MFN2 reduced the basal oxygen consumption rate and reserve respiratory capacity of mitochondria, increased the proton leak, and decreased the ATP production rate as evidenced by Seahorse assay (Figure 7 A–C). Glycolysis and glycolytic capacity were also significantly impaired in mfn2−/- cells (Figure 7 D–E).
Figure 7.
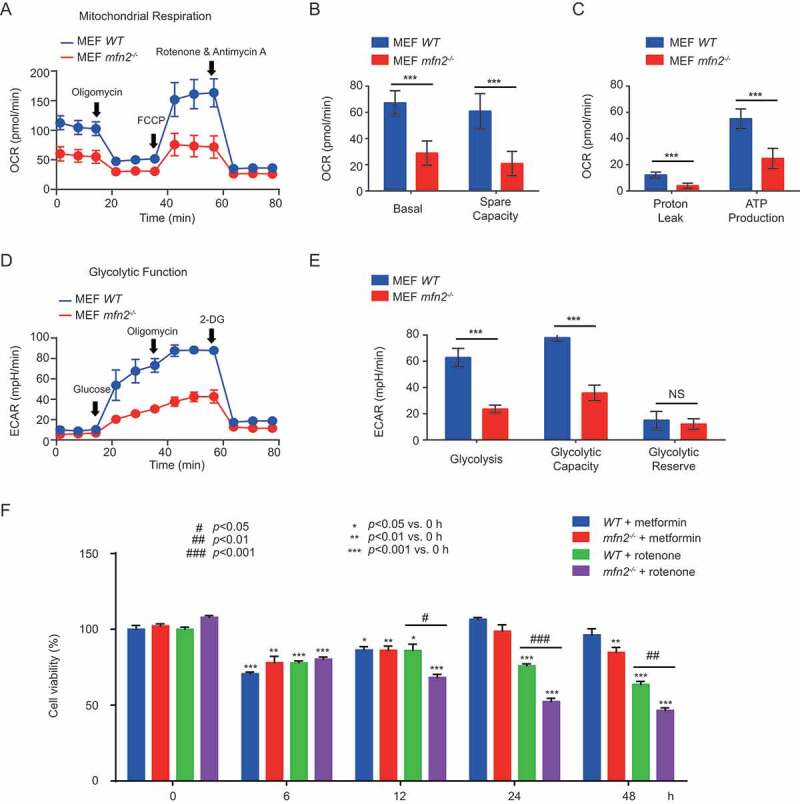
The role of MFN2 in glycolysis, mitochondrial respiration, and cell survival in response to energy stress. (A-E) WT or mfn2−/- MEFs were seeded in XFe96 cell culture microplates (12,000 cells/80 µl per well), then allowed to grow overnight in a cell culture incubator. In the meantime, seahorse XFe96 sensor cartridges were hydrated and placed in a non-CO2 37°C incubator overnight. Cells were washed twice with appropriate assay medium, either XF cell mito stress test assay medium (XF base medium supplemented with 5.5 mM glucose, 1.0 mM pyruvate, 2 mM L-glutamine, pH adjusted to 7.4 at 37°C, and filtered with a 0.2 µm filter) or XF glycolysis stress test assay medium (XF base medium supplemented with 2 mM L-glutamine, pH adjusted to 7.4 at 37°C, and filtered with a 0.2 µm filter). After the cells and Seahorse machine were prepared, the Seahorse Cell Mito Stress Test and Glycolysis Stress Test Assays were performed to test mitochondrial respiration capacity and glycolysis capacity, respectively. Data are from three independent experiments (mean ±S.D.). *** p < 0.001; NS, Not significant. (F) WT or mfn2−/- MEFs were treated with 0.5 mM metformin or 250 ng/ml rotenone for the indicated times. Subsequently, cell viability assays were performed using the Cell Counting Kit-8. Data are from three independent experiments (mean ±S.D.)
In addition, loss of mfn2 reduced the ability of cells to survive energy deficiency induced by 12 or more hours of rotenone treatment (Figure 7F). In contrast, after 24 h or 48 h of metformin treatment, the viability of mfn2−/- cells is almost fully recovered back to the original level, as measured by CCK8 assays (Figure 7F).
As a control, mfn1−/- cells were also used to examine the mitochondrial function. Loss of mfn1 reduced the basal oxygen consumption rate and reserve respiratory capacity of mitochondria to some extent, but did not influence the proton leak and ATP production rate as evidenced by Seahorse assay (Figure S1A). Glycolytic function were not prominently impaired in mfn1−/- cells (Figure S1B). The expression of MFN2 or mitochondrial fission was confirmed by immuno-blotting or immuno-fluorescence, respectively (Figure S1C-1E).
These results suggest that MFN2 is important not only for mitochondrial function but also supports cell survival during energy crisis.
Discussion
Mitochondria are in a balance of constant fission and fusion, which is essential to cellular homeostasis [15,42]. There are two ways by which mitochondrial fission occurs: one is when there is a dominant positive factor for division, and the other is when mitochondrial fusion proteins are lost or their functions are suppressed. Mitochondrial dynamics includes fragmentation, aggregation, and elongation [43,44]. The different processes allow mitochondria to adapt and respond to various stressful circumstances [42]. If mitochondrial fusion is blocked, mitochondrial fission occurs. So, mitochondrial fusion-fission is a fine-tuned counter-balanced process [15]. MFN2 is a well-established fusion factor which works with MFN1 as a hetero-dimer to control mitochondrial outer membrane fusion [17]. As reported previously, ubiquitination of MFN2 by Parkin (PRKN), for example, promotes mitochondrial fusion [45]; deubiquitination by USP30 inhibits mitochondrial fusion [46]. PINK1 could phosphorylate MFN2 and promote its Parkin-mediated ubiquitination when mitochondria lost its membrane potential. Therefore, MFN2 activity may be modulated by post-translational modifications. Here we found that AMPK interacts with and phosphorylates MFN2 during mitochondrial energy crisis. This may be very important in physiological settings because it allows them to adjust shapes to face the harsh environments such as ischemia/reperfusion injury in heart or brain [15]. Previous reports have shown that mitochondria divide under energy stress [13]. One possible mechanism for this is that energy stress will activate AMPK, and the latter may phosphorylate the mitochondrial fission factor MFF, resulting in mitochondrial translocation of DRP1 to facilitate mitochondrial fission [13]. In this study, we found a new mechanism by which AMPK also directly associates with the mitochondrial fusion factor MFN2. As shown in Figure 4C, under normal conditions, some AMPK already binds to MFN2; under energy stress conditions, however, their binding is attenuated. This is interesting because some activated AMPK may be free and in turn phosphorylates MFF to regulate mitochondrial division or phosphorylates ULK1 to regulate autophagy. Indeed, in the present study, more AMPK associates with MFF after a prolonged mitochondrial stress (Figure 4J). Therefore, the mechanism might be as follows: some AMPK has already interacted with the fusion factor MFN2 in normal condition. However, upon an acute stress, more activated AMPK firstly associates with MFN2; then, after a sustained stress, a considerable amount of AMPK associates with MFF and activates the mitochondrial fission factor MFF, consequently coordinating mitochondrial fission (Figure 4J). Our findings thus enhance our understanding of the mechanistic role of AMPK in mitochondrial division induced by energy stress.
AMPK is the master regulator of energy homeostasis [1,4]. To date, a large number of AMPK substrates have been identified, including ACC1/2, ULK1, GAPDH, P300, Beclin1, and PFKFB3, which account for different subcellular events [8–11,39,47,48]. It was originally thought that AMPK only senses the cellular AMP/ATP ratio and mainly functions in the cytosol [1,4,49]. However, recent progress shows that it can be directly activated and senses sugar availability in the absence of fructose-1,6-bisphosphate under glucose starvation conditions [50,51]. AMPK may catalyze the phosphorylation of compartmentalized pools of substrates, depending on the severity of nutrient or energy stress [52].
The activation of AMPK under energy stress not only promotes mitochondrial division [13], but also regulates autophagy through phosphorylation of ULK1 [8,10]. It is unclear how AMPK, as an energy sensor, coordinates the two processes. Our findings revealed for the first time that a proportion of AMPK is distributed in the MAM and interacts with MFN2 under normal conditions. Under energy stress conditions, a large amount of AMPK is translocated to the fragmented mitochondria. We further found that silencing AMPK interferes with MAM formation in response to energy-deprivation conditions. This is important because, on the one hand, it validates the important role of the MAM which is involved in both the division of mitochondria and marks the initiation sites of autophagosomes. On the other hand, MFN2 is not only an outer mitochondrial membrane fusion protein, the absence of which can cause the division of mitochondria [16], but it was also reported to be the tether of the MAM [30]. Whether MFN2 is a positive or negative regulator of the MAM remains unclear and is in rigorously debate. In our study, we found that less MAMs are formed in MFN2 deficient cells, indicating MFN2 plays a positive role in tethering MAMs. MFN2 was also reported to be involved in the aging of skeletal muscle [34], and loss of MFN2 in cardiomyocytes leads to autophagy abnormalities [33], but the specific mechanism of MFN2 in autophagy is not clear.
Our findings establish a novel link between the MAM tether MFN2 and the energy sensor AMPK, which provides direct evidence of the association between MFN2 and autophagy induced by energy stress. Given the critical role of MAMs in both autophagy and mitochondrial fission, it will be helpful to reveal the functional relationship between AMPK and MAMs in order to understand how energy stress affects mitochondrial division and autophagy.
Materials and Methods
Cell culture and transfections
U2OS cells stably expressing MERC reporter were obtained from Dr. Chao Tong’s lab, Zhejiang University. HeLa, 293 T, U2OS, WT mfn2 and mfn2−/- MEFs were cultured in Dulbecco’s Modified Eagle Medium (DMEM; Thermo Fisher, 12800–017) supplemented with 10% (v:v) fetal bovine serum (PAN, P30-3302), 100 U/ml penicillin (Gibco, 15140–122) and 100 mg/ml streptomycin (Gibco, 15140–122) at 37°C with 5% (v:v) CO2. Sh-PRKAA1/AMPKα1 or scrambled sequences were cloned to lenti-viral PLKO.1-puro plasmid, packed in 293 T cells with helper vectors, collected and infected HeLa cells according to the manufacturer’s protocol. Mono-cloned cells were selected and mantained by Puromycin (Sigma-Aldrich, P8833; 2 μg/ml).
Antibodies
Antibodies for western blot and immunofluorescence were as follows: anti-MFN2 (1:1000; Santa Cruz Blotechnology, sc-100560), anti-MFN2 (1:1000; Proteintech, 12186-1-AP), anti-MFN1 (1:1000; Proteintech, 13798-1-AP), anti-AMPKα1(1:1000; Proteintech, 10929-2-AP), anti-PRKAA1/AMPKα1 monoclonal (1:1000; Thermo, 9Q34), anti-P-AMPKα1 (1:1000; Cell Signaling Technology, 2535 S), anti-LC3 (1:1000; Proteintech, 14600-1-AP), anti-SQSTM1 (1:1000; Abcam, ab51416), anti-TOM20 (1:1000; BD Biosciences, 612278), ASCL-4 (1:1000; Santa Cruz Blotechnology, sc-365230), anti-ACTB/beta actin (1:1000; Cell Signaling Technology, 3700 S), anti-GAPDH (1:2000; TRANS, K21103); anti-His (1:1000; Sigma-Aldrich, SAB1306085); anti-GST (1:1000; ZSGB-BIO, TA-03); anti-MYC (1:1000; TRANS, K21213); anti-HA (1:1000; Cell Signaling Technology, 3724 S); anti-GFP (1:1000; Proteintech, 66002-1-Ig); anti-CYCS/cytochrome c (1:1000; Cell Signaling Technology, 4272); HRP-conjugated Affinipure Goat Anti-Mouse IgG (H + L) (1:5000; Proteintech, SA00001-1); HRP-conjugated Affinipure Goat Anti-Rabbit IgG (H + L) (1:5000; Proteintech, SA00001-2); Goat anti-Mouse IgG (H + L) Highly Cross-Adsorbed Secondary Antibody, Alexa Fluor 488 (1:1000; ThermoFisher Scientific, A-11029); Goat anti-Mouse IgG (H + L) Highly Cross-Adsorbed Secondary Antibody, Alexa Fluor 594 (1:1000; ThermoFisher Scientific, A-11032); Donkey anti-Rabbit IgG (H + L) Highly Cross-Adsorbed Secondary Antibody, Alexa Fluor 488 (1:1000; ThermoFisher Scientific, A-21206); Donkey anti-Rabbit IgG (H + L) Highly Cross-Adsorbed Secondary Antibody, Alexa Fluor 594 (1:1000; ThermoFisher Scientific, A-21207).
Plasmids
MYC-MFN2 was a gift from Dr. Quan Chen’s lab (College of Life Sciences, Nankai University). HA-AMPK was a gift from Dr. Kunliang Guan’s lab (University of California, San Diego). Rfp-gfp-LC3 was a kind gift from Dr. Hong Zhang’s lab (Institute of Biophysics, Chinese Academy of Sciences). For protein expression, AMPKα1 cDNA was cloned into expression vector with GST tag by double enzyme digestion method, and pGEX-AMPK protein expression plasmid was constructed. MFN2 cDNA was cloned into expression vector with His tag, and pET28a-MFN2 protein expression plasmid was constructed. Full-length or truncated form of MFN2 (1–648, 1–433, 605–650, 605–685, 605–720, and 605–757) were constructed were constructed into pEGFP-N1 vector as GFP fusion proteins.
shRNA and plasmid transfection
Mfn2 shRNAs, Ampk shRNAs, and nonsense control shRNAs, which were inserted to plasmid vector GV248, were purchased from Shanghai GeneChem Co.,Ltd. shRNA as well as plasmid transfection was performed using Lipofectamine 3000 (ThermoFisher Scientific, L3000015) for 24 h. Cells were then harvested for immunofluorescence staining or immunoblotting. The shRNA target sequences used in this study are:
non-sense, 5‘-TTCTCCGAACGTGTCACGT-3′;
Mfn2, 5′-ACTTTGTCACTGCCAAGAA-3′;
Ampk, 5′-GTTGCCTACCATCTCATAATA-3′.
And the cDNA sequence mutated for AMPK rescuing experiment is corresponding to the AMPK shRNA target sequence listed in the above (the mutated sites are wrote in lower case): Ampk, 5′-GTTgcaTACcacCTCATAATA-3′.
Immunofluorescence and confocal microscopy
For immunostaining, cells were cultured in 12-well plates, which had placed round glass coverslips in advance, subjected to normal, metformin (Sigma-Aldrich, PHR1084), rotenone (Sigma-Aldrich, R8875) or bafilomycin A1 (Sigma-Aldrich, 196000) treatments, fixed with 4% paraformaldehyde (Solarbio, CF189021) for 10 min, and permeabilized in Immunostaining Permeabilization Buffer with Triton X-100 (Beyotime, P0096-100 ml) for 10 min at room temperature. After blocking with QuickBlock™ Blocking Buffer (Beyotime, P0260) for 60 min at room temperature, cells were incubated with indicated primary antibodies (diluted in QuickBlock™ Primary Antibody Dilution Buffer (Beyotime, P0262) overnight at 4°C. After washed with 1 × Immunofluorescence Washing Buffer (diluted from 10 × Washing Buffer (Beyotime, P0106 C), cells were stained with fluorescently labeled secondary antibodies for 1 h at room temperature. Coverslips were mounted with Antifade Mounting Medium with/without DAPI (SouthernBiothern, 0100–01). Imaging was performed with a confocal laser scanning microscopy (Leica SP8).
Western blotting
Total protein was extracted by RIPA (Beyotime, P0013 K), and the protein concentration of each sample was detected using a bicinchoninic acid (BCA) kit (ThermoFisher Scientific, 23227). Deionized water was added to generate 10 µg protein samples for each lane. A 10% – 15% sodium dodecyl sulfate (SDS) separation gel and a concentration gel were prepared. The following diluted primary antibodies were added to the membrane and incubated overnight at 4°C. The membranes were washed five times with TBST (8 min each time), supplemented with horseradish peroxidase-marked second antibody (1:5000; Proteintech, SA00001-1, or SA00001-2), oscillated and then incubated at room temperature for 1 h. After incubation, each membrane was washed five times with TBST (8 min each time) and reacted with enhanced chemiluminescence solution (Tanon, 180–5001) at room temperature for 1 min, and the relative expression of each target protein was measured using ACTB/β‐actin or GAPDH as the reference.
MAMs and mitochondria purification
Detailed isolation protocols were described in our previous work with referring to others with some minor modifications [40,41]. Extraction of crude mitochondria: We used HeLa cells to purify mitochondria and extract MAMs, and subjected them into energy-deprivation or normal growth condition. Each group requires ten T-72 cm cell culture bottles. Firstly, crude mitochondria were extracted from HeLa cells. The corresponding steps are as follows: (i) Wash cells with PBS (without Ca2+ and Mg2+), and add 3 ml of trypsin solution per T-72 cm cell culture bottle, centrifuge cells at 600 × g for 5 min at 4°C. (ii) Discard the supernatant and resuspend cell pellet in 10 ml of ice-cold IBcells-1 (225 mM mannitol, 75 mM sucrose, 0.1 mM EGTA and 30 mM Tris–HCl pH 7.4), and then homogenize cells (at 4,000 rpm.) using a Teflon pestle. Every 25 strokes, control cell integrity under the microscope. Finish homogenization when 80–90% of cell damage has been attained. The integrity of homogenized cell can be checked under a light microscope. (iii) Centrifuge at 600 × g for 5 min at 4°C; collect supernatant and discard the pellet (containing unbroken cells and nuclei), centrifuge again at 600 × g for 5 min at 4°C. (iv) Collect supernatant, discard the pellet (if present) and centrifuge at 7,000 × g for 10 min at 4°C; Discard the supernatant (this is a cytosolic fraction containing lysosomes and microsomes) and gently resuspend the pellet containing mitochondria in 10 ml of ice-cold IBcells-2 (225 mM mannitol, 75 mM sucrose and 30 mM Tris–HCl, pH 7.4),and then centrifuge mitochondrial suspension at 7,000 × g for 10 min at 4°C. (v) Discard the supernatant, resuspend the mitochondrial pellet as before, in 10 ml of ice-cold IBcells-2 and centrifuge mitochondrial suspension at 10,000 × g for 10 min at 4°C; Discard the supernatant and resuspend gently the crude mitochondrial pellet in 2 ml of ice-cold MRB buffer (250 mM mannitol, 5 mM HEPES, pH 7.4, 0.5 mM EGTA).
Purification of crude mitochondria and Extraction of MAMs:
Add 8 ml of Percoll medium (Sigma-Aldrich, P1644) to the 14 ml thin-wall, Polyallomer ultracentrifuge tubes.
Layer suspension of mitochondria collected in ice-cold MRB buffer on top of 8 ml of Percoll medium (225 mM mannitol, 25 mM HEPES, pH 7.4, 1 mM EGTA, 30% Percoll [Sigma-Aldrich, P1644]) in the ultracentrifuge tube. Afterward, layer the MRB solution (about 3.5 ml) gently on top of the mitochondrial suspension to fill up the centrifuge tube (the suspension should remain 4–5 mm below the top of the tubes), and then centrifuge at 95,000 × g for 30 min at 4°C in a Beckman Coulter Optima L-100 XP Ultracentrifuge (SW40 rotor, Beckman, Fullerton, CA, USA). A dense band containing purified mitochondria is localized approximately at the bottom of the ultracentrifuge tube. MAM is visible as the diffused white band located above the mitochondria.
Respectively to collect the MAM fraction and pure mitochondria with a Pasteur pipette and dilute ten times with MRB, and then centrifuge MAM and mitochondrial suspension at 6,300 × g for 10 min at 4°C, Discard supernatant and resuspend the pellet of pure mitochondria in a small volume of MRB (300–500 μl).
Transfer the MAM supernatant to a polycarbonate tubes with cap assembly discard the pellet (containing mitochondrial contamination) and centrifuge at 100,000 × g for 1 h at 4°C, discard the supernatant and resuspend the pellet of MAM in a small volume of MRB (100–200 µl).
Electron microscopy
Electron microscopy was performed according to the protocol in the lab [41,53]. Cells were first fixed with 2% paraformaldehyde and 0.2% glutaraldehyde in sodium cacodylate buffer (pH 7.4) at 37°C for 1 h, and then dehydrated in a graded ethanol series and embedded. Approximately 75 nm ultrathin sections were mounted on nickel grids. The samples were then stained and visualized using a 120 kV Jeol electron microscope (JEM-1400) at 80 kV. Images were captured using a Gatan-832 digital camera.
Immune-precipitation
All cell lines were introduced into two 10 cm cell culture dishes at the density of 106/plate, and then they were attached to the wall and grew to a confluent degree of 80-90%. Cells were collected directly for endogenous IP or transfected with corresponding plasmids, centrifuged at 1,500 × g for 5 min, supernatant was removed, washed with PBS for 1 time, and then centrifuged at 1,500 × g for 5 min again, supernatant was removed. Put the cells on ice, add cell lysis buffer (RIPA + 1% COCKTAIL + 1% PMSF), and let the lysate stand on ice for 30 min until the lysate is fully clear. the supernatant was centrifuged at 12,000 × g at 4 °C for 15 min, and kept at −80 °C for later use. Take 100 μl as the Input, add 20 μl 6 × loading buffer, boil for 10 min, cool to room temperature, and store at −80 °C for later use. For all remaining supernatant, 1.5 ~ 3 μl primary antibody was added directly, and then put the Ferris wheel at 4 °C at 7 rpm for 4 ~ 6 h. 30 μl magnetic beads were washed 5 times with 1 ml IP buffer on the magnetic rack to retain magnetic beads. The treated magnetic beads were mixed with the samples obtained in the previous step, and the ferris wheel was incubated overnight at 4 °C at 7 rpm. Retain magnetic beads, discard supernatant, and wash with 1 ml IP lysis buffer for 10 times. Keep the magnetic beads, discard the supernatant, and boil the beads in 100 μl buffer (formula: 400 μl IP lysate + 200 μl 6 × loading buffer) for 15 min, cool to room temperature, and store at −80 °C or used to perform WB.
Protein expression and purification
pET28a-MFN2, pGEX-AMPK and pGEX plasmids were transformed with Escherichia coli BL21, and the monoclonal clones were coated and amplified for culture. 0.2 mM IPTG was added at OD600 = 0.6–0.8. After induction at 18°C for 15 h, the bacteria were collected. His-tagged protein was resuspended with 20 mM Tris (pH = 8.0), 0.5 M NaCl buffer, while Gst-tagged protein was resuspended with 20 mM Tris (pH = 7.3), 0.5 M NaCl buffer, sonicated and lysed bacteria. The lysate was centrifuged at 20,000 × g, 4°C for 30 min. His-MFN2 protein was purified by Ni affinity column and eluted by imidazole gradient. GST protein and GST-AMPK protein were purified by Gst column and eluted by 10 mM GSH.
GST pull down
The GST pull down experiment was performed with the purified proteins above, which confirmed that AMPK and MFN2 directly interact with each other in vitro. Specific operation is as follows:
After mixing, the new GST column packing stored at 4°C is taken 50 μl with a pipette gun, with buffer (20 mM Tris, pH 7.3, 150 mM NaCl, 10% glycerol, 1 mM PMSF, 1 mM DTT, 1% Triton X-100), 1 ml each time, mixing, centrifuge at 4°C, 3000 × g, 5 min, discard the supernatant carefully, retain the packing Beads, and repeat at least 3 times for cleaning.
The washed Beads were mixed with about 50 μg Gst-AMPK protein solution and incubated in a shaker at 4°C for 30 min.
Centrifuge at 4°C, 3000 × g, 5 min, discard the supernatant carefully, retain the filler Beads, and repeat the cleaning method in (ⅰ) for 5 times.
Mix the cleaned Beads in (ⅲ) with about 50 μg His-MFN2 protein and incubate in a shaker at 4°C for 1 h .
Centrifuge at 4°C, 3000 × g, 5 min, discard the supernatant carefully, leave the filler Beads, and repeat the cleaning method in (ⅰ) for 5 times. Then add 50 μl SDS-PAGE 5 × Loading buffer to the retained Beads, boiling water for 10 min, centrifuge at maximum speed for 5 min, take 10 μl running SDS-PAGE gel, and test it through Coomassie blue method and western blot.
Seahorse cell mitochondrial/glycolysis stress test assay
Seahorse Cell Mito/Glycolysis Stress Test Assay were used to test mitochondrial respiration capacity and glycolysis capacity of MEF cell with/without Mfn2. WT Mfn2 MEFs and Mfn2−/- MEFs were seeded in XFe96 Cell Culture Microplates (Seahorse Bioscience,102,601–100) with concentration of 12,000 cells/80 μl per well, then allowed to grow overnight in a cell culture incubator. In the meantime, Seahorse XFe96 Sensor Cartridge were hydrated and placed in a non-CO2 37°C incubator overnight. Cells were washed twice with assay medium based on the type of XF assay were runned, used XF Cell Mito Stress Test Assay Medium (XF Base Medium [Seahorse Bioscience, 102353–100] added 5.5 mM glucose [Sigma, G7528], 1.0 mM pyruvate [Sigma, P5280], 2 mM L-glutamine [Life Technologies, 25030–081], adjusted pH to 7.4 at 37°C, and filtered with a 0.2 µm filter [Millipore, SLGP033RB]) or XF Glycolysis Stress Test Assay Medium (XF Base Medium added 2 mM L-glutamine, adjusted pH to 7.4 at 37°C, and filtered with a 0.2 µm filter). Cells were covered by assay medium for a final volume of 180 μl/well, and were placed in a 37°C incubator without CO2 for one hour prior to the assay. Meanwhile compounds were loaded into the XFe96 Sensor Cartridge. In cell mito stress test assay, compounds consists of port A: oligomycin for a final concentration of 1 μM, port B: FCCP for a final concentration of 0.5 μM, port C: rotenone for a final concentration of 0.5 μM, and antimycin A for a final concentration of 0.5 μM. While in glycolysis stress test assay, compounds consist of port A: glucose for a final concentration of 10 mM; port B: oligomycin for a final concentration of 1 μM; port C: 2-deoxy-D-glucose (2-DG [Seahorse Bioscience, 103020–100]) for a final concentration of 50 mM. Subsequently, runned the assay on Agilent Seahorse XFe96, viewed and analyzed assay result data using Wave Desktop and Report Generator software.
Cell counting Kit-8 assay
Cell proliferation-toxicity assays were performed by measuring cell viability with the Cell Counting Kit-8 (MedChemExpress, HY-K0301-500 T) according to the manufacturer’s protocol. Cell suspension (100 μl/well) was inoculated at 96 wells and the culture plate was placed in the incubator for pre-culture 24 h. Add different concentrations of drugs (metformin 0.2 mM, rotenone 100 ng/ml) to the culture plate to be tested; Incubate the plate in the incubator for an appropriate period of time; Add 10 μl cck-8 solution to each hole (be careful not to produce bubbles). Place the culture plate in the incubator and incubate for 1–4 h; The absorbance at 450 nm was measured by micrometer.
Statistical analysis
Densitometry was analyzed using ImageJ software for the quantitative analysis of the bands on the immuno blots. Data were presented as the mean ± S.D. Student’s t-test was used to calculate P-values. Statistical significance is displayed as *p < 0.05, **p < 0.01, ***p < 0.001.
Supplementary Material
Acknowledgments
We thank Dr. Isabel Hanson for editing the manuscript. We thank Dr. Chao Tong (Zhejiang University) for kindly providing the U2OS cells stably expressing the MERC reporter. We thank all authors for commenting on the manuscript. The work is supported by the NSFC (No. 91754115, No. 31771531, No. 81771328 and No. 81571203), by the Guangdong Province Universities and Colleges Pearl River Scholar Funded Scheme (GDUPS, 2018), by the Science and Technology Planning Project of Guangdong Province (2017B090901051, 2016A020215152), by the Key Specialty Construction Project of the Shanghai Municipal Commission of Health and Family Planning (No. ZK2019A08), and by the Municipal Human Resources Development Program for Outstanding Leaders in Medical Disciplines in Shanghai (No. 2017BR051).
Correction Statement
This article has been republished with minor changes. These changes do not impact the academic content of the article.
Funding Statement
This work was supported by the National Natural Science Foundation of China [31771531, 91754115].
Disclosure statement
The authors declare that they have no conflict of interests.
Supplementary material
Supplemental data for this article can be accessed here.
References
- [1].Hardie DG, Ross FA, Hawley SA.. AMPK: a nutrient and energy sensor that maintains energy homeostasis. Nat Rev Mol Cell Biol. 2012;13:251–262. [DOI] [PMC free article] [PubMed] [Google Scholar]
- [2].Mihaylova MM, Shaw RJ. The AMPK signalling pathway coordinates cell growth, autophagy and metabolism. Nat Cell Biol. 2011;13:1016–1023. [DOI] [PMC free article] [PubMed] [Google Scholar]
- [3].Shirwany NA, Zou M-H. AMPK in cardiovascular health and disease. Acta Pharmacol Sin. 2010;31:1075–1084. [DOI] [PMC free article] [PubMed] [Google Scholar]
- [4].Carling D. AMPK signalling in health and disease. Curr Opin Cell Biol. 2017;45:31–37. [DOI] [PubMed] [Google Scholar]
- [5].Steinberg GR, Kemp BE. AMPK in health and disease. Physiol Rev. 2009;89:1025–1078. [DOI] [PubMed] [Google Scholar]
- [6].Cheung PCF, Salt IP, Davies SP, et al. Characterization of AMP-activated protein kinase γ-subunit isoforms and their role in AMP binding. Biochem J. 2000;346(3):659–669. [PMC free article] [PubMed] [Google Scholar]
- [7].Laderoute KR, Amin K, Calaoagan JM, et al. 5’-AMP-Activated Protein Kinase (AMPK) is induced by low-oxygen and glucose deprivation conditions found in solid-tumor microenvironments. Mol Cell Biol. 2006;26:5336–5347. [DOI] [PMC free article] [PubMed] [Google Scholar]
- [8].Tian W, Li W, Chen Y, et al. Phosphorylation of ULK1 by AMPK regulates translocation of ULK1 to mitochondria and mitophagy. FEBS Lett. 2015;589:1847–1854. [DOI] [PubMed] [Google Scholar]
- [9].Zhao M, Klionsky DJ. AMPK-dependent phosphorylation of ULK1 induces autophagy. Cell Metab. 2011;13(2):119–120. [DOI] [PMC free article] [PubMed] [Google Scholar]
- [10].Kim J, Kundu M, Viollet B, et al. AMPK and mTOR regulate autophagy through direct phosphorylation of Ulk1. Nat Cell Biol. 2011;13:132–141. [DOI] [PMC free article] [PubMed] [Google Scholar]
- [11].Lee JW, Park S, Takahashi Y, et al. The association of AMPK with ULK1 regulates autophagy. PLoS One. 2010;5:e15394. [DOI] [PMC free article] [PubMed] [Google Scholar]
- [12].Gwinn DM, Shackelford DB, Egan DF, et al. AMPK phosphorylation of raptor mediates a metabolic checkpoint. Mol Cell. 2008;30:214–226. [DOI] [PMC free article] [PubMed] [Google Scholar]
- [13].Toyama EQ, Herzig S, Courchet J, et al. Metabolism AMP-activated protein kinase mediates mitochondrial fission in response to energy stress. Science. 2016;351:275–281. [DOI] [PMC free article] [PubMed] [Google Scholar]
- [14].Detmer SA, Chan DC. Functions and dysfunctions of mitochondrial dynamics. Nat Rev Mol Cell Biol. 2007;8:870–879. [DOI] [PubMed] [Google Scholar]
- [15].Chan DC. Mitochondrial dynamics in disease. N Engl J Med. 2007;356:1707–1709. [DOI] [PubMed] [Google Scholar]
- [16].Detmer SA, Chan DC. Complementation between mouse Mfn1 and Mfn2 protects mitochondrial fusion defects caused by CMT2A disease mutations. J Cell Biol. 2007;176:405–414. [DOI] [PMC free article] [PubMed] [Google Scholar]
- [17].Chen H, Detmer SA, Ewald AJ, et al. Mitofusins Mfn1 and Mfn2 coordinately regulate mitochondrial fusion and are essential for embryonic development. J Cell Biol. 2003;160:189–200. [DOI] [PMC free article] [PubMed] [Google Scholar]
- [18].Mishra P, Carelli V, Manfredi G, et al. Proteolytic cleavage of Opa1 stimulates mitochondrial inner membrane fusion and couples fusion to oxidative phosphorylation. Cell Metab. 2014;19:630–641. [DOI] [PMC free article] [PubMed] [Google Scholar]
- [19].Olichon A, Baricault L, Gas N, et al. Loss of OPA1 perturbates the mitochondrial inner membrane structure and integrity, leading to cytochromec release and apoptosis. J Biol Chem. 2003;278:7743–7746. [DOI] [PubMed] [Google Scholar]
- [20].Gandre-Babbe S, van der Bliek AM, Shaw J. The novel tail-anchored membrane protein Mff controls mitochondrial and peroxisomal fission in mammalian cells. Mol Biol Cell. 2008;19:2402–2412. [DOI] [PMC free article] [PubMed] [Google Scholar]
- [21].Otera H, Wang C, Cleland MM, et al. Mff is an essential factor for mitochondrial recruitment of Drp1 during mitochondrial fission in mammalian cells. J Cell Biol. 2010;191:1141–1158. [DOI] [PMC free article] [PubMed] [Google Scholar]
- [22].Smirnova E, Griparic L, Shurland D-L, et al. Dynamin-related protein Drp1 is required for mitochondrial division in mammalian cells. Mol Biol Cell. 2001;12:2245–2256. [DOI] [PMC free article] [PubMed] [Google Scholar]
- [23].Palmer CS, Elgass KD, Parton RG, et al. Adaptor proteins MiD49 and MiD51 can act independently of Mff and Fis1 in Drp1 recruitment and are specific for mitochondrial fission. J Biol Chem. 2013;288:27584–27593. [DOI] [PMC free article] [PubMed] [Google Scholar]
- [24].Loson OC, Song Z, Chen H, et al. Fis1, Mff, MiD49, and MiD51 mediate Drp1 recruitment in mitochondrial fission. Mol Biol Cell. 2013;24:659–667. [DOI] [PMC free article] [PubMed] [Google Scholar]
- [25].Zhao YG, Zhang H. Formation and maturation of autophagosomes in higher eukaryotes: a social network. Curr Opin Cell Biol. 2018;53:29–36. [DOI] [PubMed] [Google Scholar]
- [26].Angebault C, Fauconnier J, Patergnani S, et al. ER-mitochondria cross-talk is regulated by the Ca(2+) sensor NCS1 and is impaired in Wolfram syndrome. Sci Signal. 2018;11:1–14. [DOI] [PubMed] [Google Scholar]
- [27].Marchi S, Patergnani S, Pinton P. The endoplasmic reticulum–mitochondria connection: one touch, multiple functions. Biochim Biophys Acta. 2014;1837:461–469. [DOI] [PubMed] [Google Scholar]
- [28].Hamasaki M, Furuta N, Matsuda A, et al. Autophagosomes form at ER–mitochondria contact sites. Nature. 2013;495:389–393. [DOI] [PubMed] [Google Scholar]
- [29].Murley A, Lackner LL, Osman C, et al. ER-associated mitochondrial division links the distribution of mitochondria and mitochondrial DNA in yeast. Elife. 2013;2:e00422.23682313 [Google Scholar]
- [30].de Brito OM, Scorrano L. Mitofusin 2 tethers endoplasmic reticulum to mitochondria. Nature. 2008;456:605–610. [DOI] [PubMed] [Google Scholar]
- [31].Naon D, Zaninello M, Giacomello M, et al. Critical reappraisal confirms that mitofusin 2 is an endoplasmic reticulum–mitochondria tether. Proc Natl Acad Sci U S A. 2016;113:11249–11254. [DOI] [PMC free article] [PubMed] [Google Scholar]
- [32].Filadi R, Greotti E, Turacchio G, et al. On the role of mitofusin 2 in endoplasmic reticulum–mitochondria tethering. Proc Natl Acad Sci U S A. 2017;114:E2266–E7. [DOI] [PMC free article] [PubMed] [Google Scholar]
- [33].Zhao T, Huang X, Han L, et al. Central role of mitofusin 2 in autophagosome-lysosome fusion in cardiomyocytes. J Biol Chem. 2012;287:23615–23625. [DOI] [PMC free article] [PubMed] [Google Scholar]
- [34].Sebastian D, Sorianello E, Segales J, et al. Mfn2 deficiency links age-related sarcopenia and impaired autophagy to activation of an adaptive mitophagy pathway. Embo J. 2016;35:1677–1693. [DOI] [PMC free article] [PubMed] [Google Scholar]
- [35].Owen MR, Doran E, Halestrap AP. Evidence that metformin exerts its anti-diabetic effects through inhibition of complex 1 of the mitochondrial respiratory chain. Biochem J. 2000;348(3):607–614. [PMC free article] [PubMed] [Google Scholar]
- [36].El-Mir M-Y, Nogueira V, Fontaine E, et al. Dimethylbiguanide inhibits cell respiration via an indirect effect targeted on the respiratory chain complex I. J Biol Chem. 2000;275:223–228. [DOI] [PubMed] [Google Scholar]
- [37].Li N, Ragheb K, Lawler G, et al. Mitochondrial complex I inhibitor rotenone induces apoptosis through enhancing mitochondrial reactive oxygen species production. J Biol Chem. 2003;278:8516–8525. [DOI] [PubMed] [Google Scholar]
- [38].Yang Z, Zhao X, Xu J, et al. A novel fluorescent reporter detects plastic remodeling of mitochondria-ER contact sites. J Cell Sci. 2018;131:1–13. [DOI] [PubMed] [Google Scholar]
- [39].Egan DF, Shackelford DB, Mihaylova MM, et al. Phosphorylation of ULK1 (hATG1) by AMP-activated protein kinase connects energy sensing to mitophagy. Science. 2011;331:456–461. [DOI] [PMC free article] [PubMed] [Google Scholar]
- [40].Wieckowski MR, Giorgi C, Lebiedzinska M, et al. Isolation of mitochondria-associated membranes and mitochondria from animal tissues and cells. Nat Protoc. 2009;4:1582–1590. [DOI] [PubMed] [Google Scholar]
- [41].Wu W, Lin C, Wu K, et al. FUNDC1 regulates mitochondrial dynamics at the ER–mitochondrial contact site under hypoxic conditions. Embo J. 2016;35:1368–1384. [DOI] [PMC free article] [PubMed] [Google Scholar]
- [42].Chan D, Frank S, Rojo M. Mitochondrial dynamics in cell life and death. Cell Death Differ. 2006;13:680–684. [DOI] [PubMed] [Google Scholar]
- [43].Chen H, Chan DC. Mitochondrial dynamics in mammals. Curr Top Dev Biol. 2004;59:119–144. [DOI] [PubMed] [Google Scholar]
- [44].Chen H, Chan DC. Mitochondrial dynamics-fusion, fission, movement, and mitophagy-in neurodegenerative diseases. Hum Mol Genet. 2009;18:R169–76. [DOI] [PMC free article] [PubMed] [Google Scholar]
- [45].Chen Y, Dorn GW 2nd.. PINK1-phosphorylated mitofusin 2 is a Parkin receptor for culling damaged mitochondria. Science. 2013;340:471–475. [DOI] [PMC free article] [PubMed] [Google Scholar]
- [46].Yue W, Chen Z, Liu H, et al. A small natural molecule promotes mitochondrial fusion through inhibition of the deubiquitinase USP30. Cell Res. 2014;24:482–496. [DOI] [PMC free article] [PubMed] [Google Scholar]
- [47].Cho YS, Lee JI, Shin D, et al. Molecular mechanism for the regulation of human ACC2 through phosphorylation by AMPK. Biochem Biophys Res Commun. 2010;391:187–192. [DOI] [PubMed] [Google Scholar]
- [48].Chang C, Su H, Zhang D, et al. AMPK-dependent phosphorylation of GAPDH triggers Sirt1 activation and is necessary for autophagy upon glucose starvation. Mol Cell. 2015;60:930–940. [DOI] [PubMed] [Google Scholar]
- [49].Hardie DG. New roles for the LKB1→AMPK pathway. Curr Opin Cell Biol. 2005;17:167–173. [DOI] [PubMed] [Google Scholar]
- [50].Zhang C-S, Hawley SA, Zong Y, et al. Fructose-1,6-bisphosphate and aldolase mediate glucose sensing by AMPK. Nature. 2017;548:112–116. [DOI] [PMC free article] [PubMed] [Google Scholar]
- [51].Lin S-C, Hardie DG. AMPK: sensing glucose as well as cellular energy status. Cell Metab. 2018;27:299–313. [DOI] [PubMed] [Google Scholar]
- [52].Zong Y, Zhang C-S, Li M, et al. Hierarchical activation of compartmentalized pools of AMPK depends on severity of nutrient or energy stress. Cell Res. 2019;29:460–473. [DOI] [PMC free article] [PubMed] [Google Scholar]
- [53].Feng D, Zhao W-L, Ye -Y-Y, et al. Cellular internalization of exosomes occurs through phagocytosis. Traffic. 2010;11:675–687. [DOI] [PubMed] [Google Scholar]
Associated Data
This section collects any data citations, data availability statements, or supplementary materials included in this article.