

ABSTRACT
CTSD/CathD/CATD (cathepsin D) is a lysosomal aspartic protease. A distinguishing characteristic of CTSD is its dual functions of promoting cell proliferation via secreting a pro-enzyme outside the cells as a ligand, and promoting apoptosis via the mature form of this enzyme inside cells; however, the regulation of its secretion, expression, and maturation is undetermined. Using the lepidopteran insect Helicoverpa armigera, a serious agricultural pest, as a model, we revealed the dual functions and regulatory mechanisms of CTSD secretion, expression, and maturation. Glycosylation of asparagine 233 (N233) determined pro-CTSD secretion. The steroid hormone 20-hydroxyecdysone (20E) promoted CTSD expression. Macroautophagy/autophagy triggered CTSD maturation and localization inside midgut cells to activate CASP3 (caspase 3) and promote apoptosis. Pro-CTSD was expressed in the pupal epidermis and was secreted into the hemolymph to promote adult fat body endoreplication/endoreduplication, cell proliferation, and association. Our study revealed that the differential expression and autophagy-mediated maturation of CTSD in tissues determine its roles in apoptosis and cell proliferation, thereby determining the cell fates of tissues during lepidopteran metamorphosis.
Abbreviations: 20E: 20-hydroxyecdysone; 3-MA: 3-methyladenine; ACTB/β-actin: actin beta; AKT: protein kinase B; ATG1: autophagy-related 1; ATG4: autophagy-related 4; ATG5: autophagy-related 5; ATG7: autophagy-related 7; ATG14: autophagy-related 14; BSA: bovine serum albumin; CASP3: caspase 3; CQ: choroquine; CTSD: cathepsin D; DAPI: 4′,6-diamidino-2-phenylindole; DMSO: dimethyl sulfoxide; DPBS: dulbecco’s phosphate-buffered saline; DsRNA: double-stranded RNA; EcR: ecdysone receptor; EcRE: ecdysone response element; EdU: 5-ethynyl-2´-deoxyuridine; G-m-CTSD: glycosylated-mautre-CTSD; G-pro-CTSD: glycosylated-pro-CTSD; HaEpi: Helicoverpa armigera epidermal cell line; HE staining: hematoxylin and eosin staining; IgG: immunoglobin G; IM: imaginal midgut; JH: juvenile hormone; Kr-h1: krueppel homologous protein 1; LM: larval midgut; M6P: mannose-6-phosphate; PBS: phosphate-buffered saline; PCD: programmed cell death; PNGase: peptide-N-glycosidase F; RFP: red fluorescent protein; RNAi: RNA interference; SDS-PAGE: sodium dodecyl sulfate-polyacrylamide gel electrophoresis; SYX17: syntaxin 17; USP1: ultraspiracle isoform 1.
KEYWORDS: 20-hydroxyecdysone, apoptosis, autophagy, cathepsin D, cell proliferation, CTSD
Introduction
CTSD (cathepsin D) (EC 3.4.23.5) is a lysosomal aspartic protease in the pepsin superfamily [1]. Human CTSD is expressed as pre-pro-CTSD and is glycosylated at two N-linked glycosylation sites (Asn residues 134 and 263 numbered according to the full-length protein) in the rough endoplasmic reticulum (ER). The signal peptide of the pre-pro-CTSD is cleaved in the ER, forming the pro-CTSD, which is transported to the Golgi and then transported to the endosome by the binding of mannose-6-phosphate (M6P) to M6PR (mannose-6-phosphate receptor, cation dependent). Pro-CTSD is finally processed to form the mature CTSD (m-CTSD) in the lysosome [2]. The major role of the m-CTSD is the digestion of internalized waste cell proteins and peptides in the lysosome [3,4], which maintains cell health [5,6].
In addition to its function in the lysosome, CTSD also functions in the cytosol and extracellular environment. In the cytosol, m-CTSD has a pro-apoptotic function [7]. M-CTSD can cleave and activate the pro-apoptotic molecule BID (BH3 interacting domain death agonist), which, in turn, causes the release of CYCS/cytochrome c, the integral part of the APAF1 (apoptotic peptidase activating factor 1) complex, which activates directly an initiator caspase, CASP9 (caspase 9) [8]. CASP9 activates in turn CASP3 (caspase 3) and CASP7 (caspase 7), resulting in apoptosis [9]. M-CTSD acts at different stages of the intrinsic and extrinsic pathways of apoptosis [10] and also primes CASP8 (caspase 8) activation [11]. In the extracellular environment, pro-CTSD has a pro-proliferation function. The expression and secretion of pro-CTSD increases cell proliferation, metastasis, and progression of breast cancer [12] and a number of other tumors [13]. Epithelial ovarian cancer secretes CTSD as an extracellular ligand to increase cell proliferation via a non-proteolytic mechanism and via activation of MAPK1/ERK2 (mitogen-activated protein kinase 1)-MAPK3/ERK1 (mitogen-activated protein kinase 3) and AKT/protein kinase B [14]. However, the mechanism of the transformation of CTSD from its pro-apoptotic function as a “physiological guardian angel” to the pro-proliferation function in cancers as a “pathological demon” is unclear [2].
Insect metamorphosis from larva to adult is characterized by the extensive larval tissue apoptosis and adult cell proliferation. The steroid hormone 20-hydroxyecdysone (20E), via the EcR-USP1 (ecdysone receptor-ultraspiracle isoform 1) transcription complex, regulates metamorphosis-related gene expression [15]. Interestingly, different larval tissues have different fates during metamorphosis. For example, the epithelium of the larval midgut is completely degraded via programmed cell death (PCD) during metamorphosis in Bombyx [16], Drosophila [17], and Helicoverpa armigera [18,19]. Macroautophagy/autophagy determines apoptosis in the midgut under 20E regulation in H. armigera [19]. However, the epidermis forms the cuticles of larvae, pupae, and adults sequentially, without histolysis, in the lepidopteran insect Manduca sexta [20]. The larval fat body is dissociated in the pupa as individual cells and eventually removed by apoptosis in Drosophila [21,22], but the formation of the adult fat body is unclear. Proteases are known to be involved in autophagy; however, the physiological substrates and intracellular functions of the proteases in autophagy are unknown [23]. A CTSD is known to be involved in PCD of the larval fat body and midgut in the silkworm, Bombyx mori [24,25]; however, the mechanisms underlying its dual functions in tissue remodeling and the different tissue fates are unclear.
Understanding the mechanisms of CTSD expression, secretion, and maturation are important for the diagnosis and therapy of cancers and are necessary to reveal the mechanism of tissue fate during physiological or pathological processes. Therefore, we used H. armigera as a model to investigate the dual functions and the steroid hormonal regulatory mechanisms of CTSD secretion, expression, and maturation to investigate the different tissue fates during insect metamorphosis. Our data revealed that 20E upregulated CTSD expression. Pro-CTSD was glycosylated and secreted into the hemolymph from the pupal epidermis to promote adult fat body reassociation, endoreplication, and cell proliferation. However, autophagy resulted in the maturation of glycosylated-pro-CTSD (G-pro-CTSD) to glycosylated-mature-CTSD (G-m-CTSD), which promoted CASP3 cleavage and apoptosis in the midgut. Our study not only revealed the mechanisms of CTSD expression, secretion, and maturation but also revealed the mechanisms of different tissue fates during lepidopteran metamorphic development.
Results
CTSD showed developmental stage- and tissue-specific expression
To study the function of CTSD, its developmental expression profiles and tissue-specific expression were examined at the protein and mRNA levels using western blotting and quantitative real-time reverse transcription PCR (QRT-PCR), respectively. Western blotting detected a band of approximately 41 kDa in the epidermis at the pupal stages (P-2 d and P-8 d), which was named as pro-CTSD (41 kDa). A band of approximately 38 kDa was detected in the midgut at the metamorphic stages from sixth instar 72 h larvae to pupal 6 d (6th-72 h to P-6 d), which was hypothesized to be the glycosylated-mature-CTSD; therefore, it was named as G-m-CTSD (38 kDa). A band of approximately 43 kDa was detected in the blood plasma (hemolymph without hemocytes) at the pupal stages (P-2 d and P-8 d), which was hypothesized as the glycosylated-pro-CTSD; therefore, it was named as G-pro-CTSD (43 kDa). In addition, an unknown band of approximately 65 kDa was detected in the midgut at around the 5th instar molting stage. No band was detected in the fat body and hemocytes (Figure 1 A,B). QRT-PCR also showed an increased mRNA level of Ctsd in the midgut and epidermis, and very low levels of Ctsd mRNA in the fat body and hemocytes (Figure 1C). Thus, CTSD expression shows tissue and developmental stage specificity.
Figure 1.
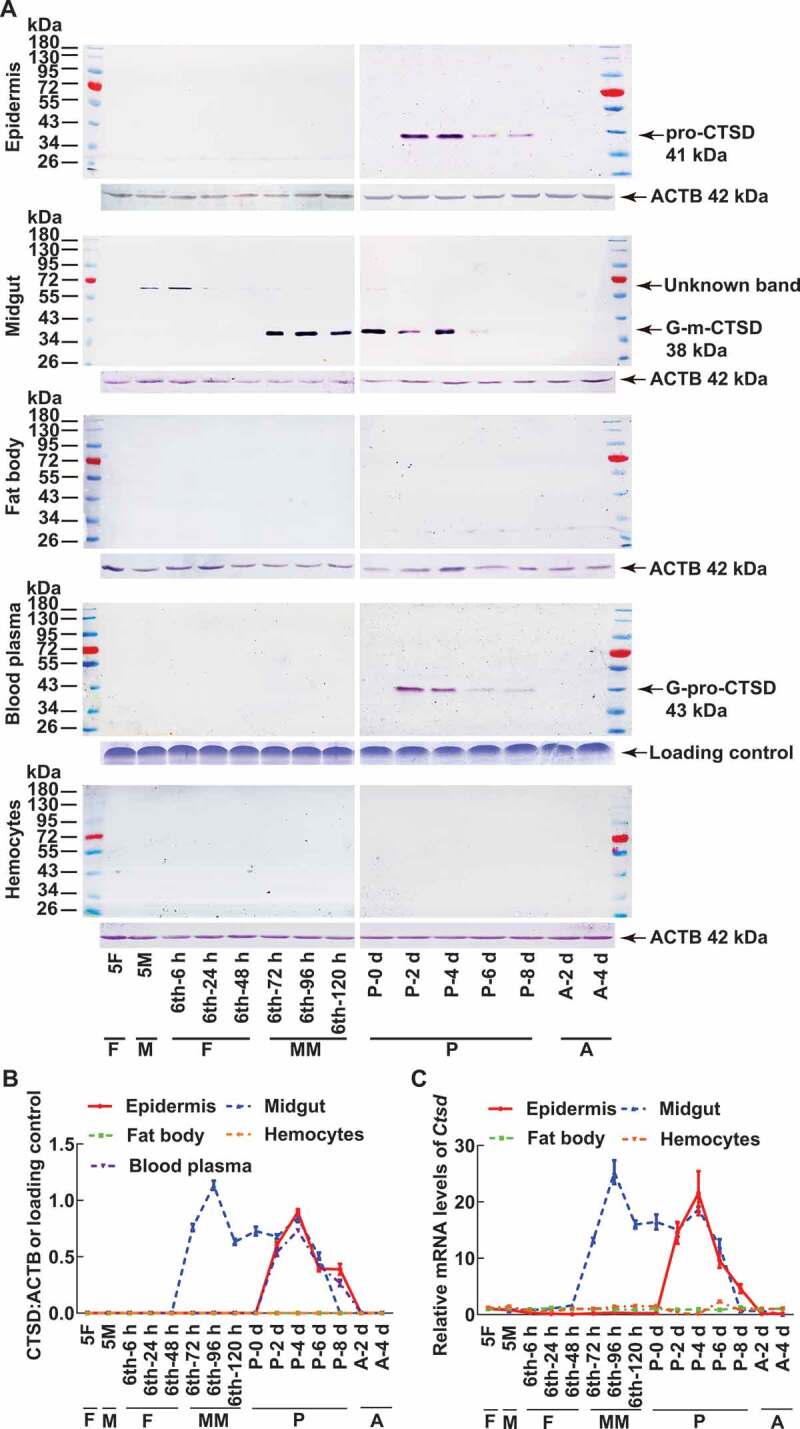
CTSD was expressed as different forms with tissue and developmental stage specificity. (A) Western blot analysis using antibodies against H. armigera CTSD. The specificity of the antibodies was shown in Fig. S1 to detect CTSD expression profiles in different tissues. The protein of blood plasma was diluted in a ratio of 1:8 with PBS. ACTB was detected as protein quality control. The loading controls were the proteins of hemolymph by SDS-PAGE as the control for blood plasma. 10% SDS-PAGE gel was used in western blot. 5F: 5th instar feeding larvae; 5M: 5th instar molting larvae; 6th-6 h to 6th-120 h: 6th instar 6 h larvae to 6th instar 120 h larvae; P-0 d to P-8 d: pupal stage at day 0 to day 8; A-2 d to A-4 d: adult stage at day 2 to day 4; F: feeding stage; M: molting stage; MM: metamorphic molting stage; P: pupae; A: adult. The protein markers are the same on both sides of the pictures. (B) Quantification of the data in (A) according to three independent replicates using ImageJ software. (C) QRT-PCR to show the mRNA level of Ctsd. All experiments were performed in triplicate. The bars indicate the mean ± SD
N-linked glycosylation of N233 determined CTSD secretion
To confirm the different forms of CTSD and their glycosylation, peptide-N-glycosidase F (PNGase) was used to remove N-linked oligosaccharides from CTSD in tissues on the day 2 pupal stage (P2 pupae). Western blotting showed that the molecular mass of G-m-CTSD in the midgut decreased after PNGase treatment. By contrast, the molecular mass of pro-CTSD in the epidermis was unchanged after PNGase treatment. The molecular mass of G-pro-CTSD decreased in the blood plasma (Figure 2A). These results suggested that CTSD is a glycoprotein in the midgut and in the blood plasma, whereas pro-CTSD in the epidermis is not glycosylated.
Figure 2.
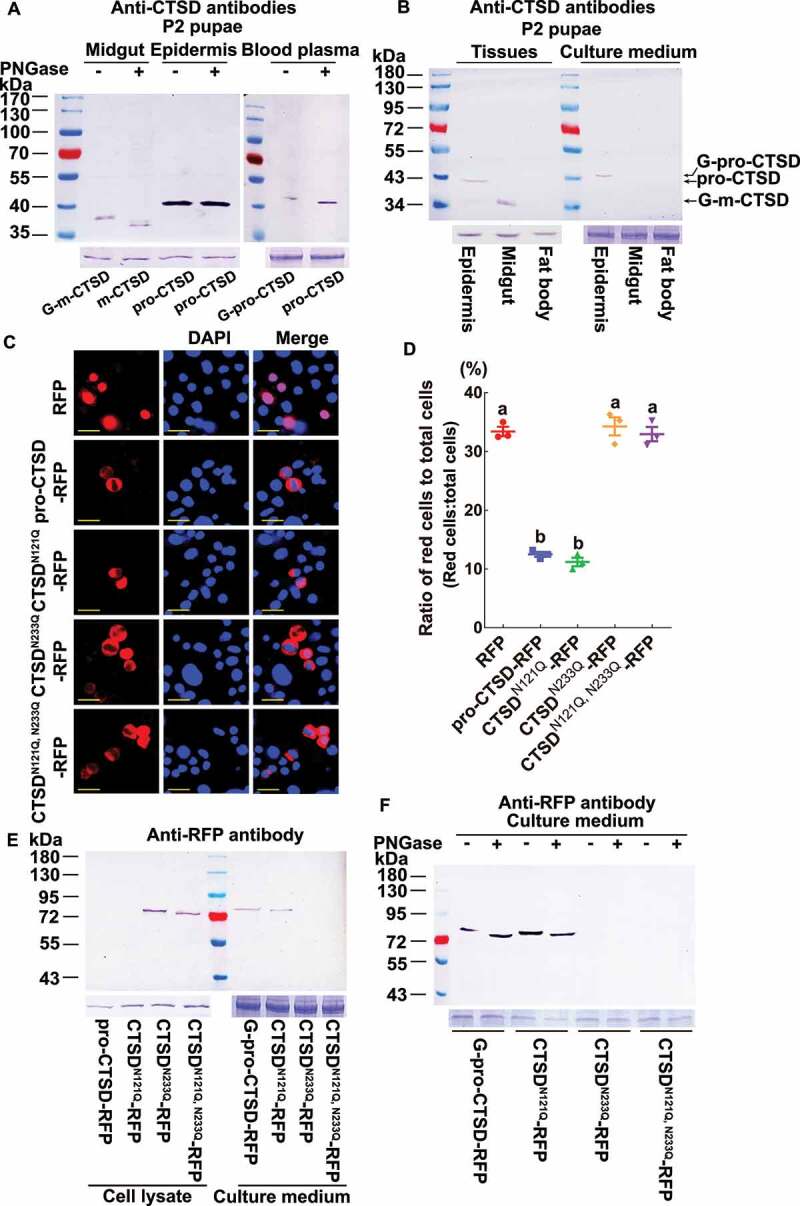
Molecular masses and glycosylation of CTSD. (A) Examination of the glycosylation of CTSD by western blotting using antibodies against H. armigera CTSD. The proteins from the midgut, epidermis, and blood plasma were isolated from pupae on day 2 and treated with PNGase. The SDS-PAGE gel used in western blot was a 10% gel. ACTB was detected as the protein quality control of tissues. The hemolymph proteins were used for blood plasma control by SDS-PAGE. (B) Identification of the source of G-pro-CTSD in the blood plasma by culturing the isolated midgut, epidermis, and fat body from pupae on day 2 in Grace’s medium. ACTB was detected as the protein quality control of tissues. Grace’s medium was used for tissue culture medium loading control by SDS-PAGE. (C) Immunofluorescence showing the overexpression of the RFP, full-length-CTSD-RFP and its mutants (CTSDN121Q-RFP, CTSDN233Q-RFP, and CTSDN121Q, N233Q-RFP) in HaEpi cells 48 h after transfection, with RFP as a control. Red fluorescence indicates the overexpressed RFP, pro-CTSD-RFP, CTSDN121Q-RFP, CTSDN233Q-RFP, and CTSDN121Q, N233Q-RFP. The blue fluorescence indicates the cell nuclei stained with 4′,6-diamidino-2-phenylindole (DAPI). Scale bar: 20 μm. (D) Statistical analysis of the ratio of red fluorescent cells/total cells in (C) using ANOVA; different lowercase letters indicated significant differences (p < 0.05). The bars indicate the mean ± SD. ImageJ software was used to transform the image data. (E) Western blot detecting the secretion of pro-CTSD-RFP, CTSDN121Q-RFP, CTSDN233Q-RFP, and CTSDN121Q, N233Q-RFP overexpressed for 48 h after transfection. Antibody against RFP was used to detect the proteins. Cell lysate: the cells were collected and subjected to western blot. Culture medium: Grace’s medium of cell culture after being enriched using anti-CTSD polyclonal antibodies. ACTB was detected as the protein quality control of cell lysate. Grace’s medium was used for the enrichment of CTSD control by SDS-PAGE. (F) Western blot detecting the glycosylation of G-pro-CTSD-RFP, CTSDN121Q-RFP, CTSDN233Q-RFP, and CTSDN121Q, N233Q-RFP overexpressed for 48 h after transfection in Grace’s medium. Antibody against RFP was used to detect the proteins. Culture medium: Grace’s medium of cell culture after being enriched using anti-CTSD polyclonal antibodies. The Grace’s medium used for enrichment of CTSD control by SDS-PAGE
To address the sources of G-pro-CTSD in the blood plasma, the epidermis, midgut, and fat body from pupae at P-2 d were dissected and cultured in the medium for 12 h, and then the homogenates of tissues and the tissue culture medium were subjected to western blotting. G-pro-CTSD (43 kDa) was detected from the epidermis-culture medium, but not from the midgut- or fat body-culture medium (Figure 2B), suggesting the G-pro-CTSD in the blood plasma was secreted from the epidermis after being glycosylated.
Asparagines at positions 121 and 233 (N121 and N233) of CTSD were predicted as N-linked glycosylation sites. We overexpressed the wild-type full-length CTSD, a single glycosylation site mutant with asparagine replaced by glutamine (CTSDN121Q-RFP or CTSDN233Q-RFP), and the double glycosylation site mutant (CTSDN121Q, N233Q-RFP) in an H. armigera epidermal cell line (HaEpi) via the plasmid pIEx-4-RFP-His to investigate the role of glycosylation in pro-CTSD-RFP secretion, with RFP as a control. The results showed less red fluorescence in pro-CTSD-RFP or CTSDN121Q-RFP overexpressing-cells than in cells overexpressing CTSDN233Q-RFP or CTSDN121Q, N233Q-RFP, and the CTSD secretion was not affected by the transfection efficiency compared to the RFP (Figure 2 C,D). Western blotting further revealed that G-pro-CTSD-RFP and CTSDN121Q-RFP were not detected in the cell lysate, whereas they were detected in the culture medium. In contrast, CTSDN233Q-RFP and CTSDN121Q, N233Q-RFP were detected in the cell lysate, but not in the culture medium (Figure 2E). To confirm the glycosylation of G-pro-CTSD-RFP and CTSDN121Q-RFP in the culture medium, PNGase was used to deglycosylate CTSD. Results showed that the molecular masses of G-pro-CTSD-RFP and CTSDN121Q-RFP in the culture medium were decreased by PNGase treatment, indicating G-pro-CTSD-RFP and CTSDN121Q-RFP in the culture medium were glycosylated (Figure 2F). These data suggested that N233 glycosylation determines pro-CTSD secretion.
20E induced CTSD expression as the mature form in the midgut and pro-CTSD in the epidermis
The upregulated expression of G-m-CTSD in the midgut during metamorphosis suggested that 20E upregulates CTSD expression because the 20E titer is high during insect metamorphosis [26]; therefore, we detected the effect of 20E on larvae at 6 instar 6 h. The protein levels of G-m-CTSD increased at 6 h after injection of 200–500 ng 20E, compared with larvae injected with dimethyl sulfoxide (DMSO) solvent as a control (Figures 3A,Ai). In turn, 500 ng of 20E induced G-m-CTSD expression from 3–24 h, with the highest level from 6–12 h (Figures 3B,Bi). In contrast, G-m-CTSD, pro-CTSD, or G-pro-CTSD was not induced by 20E in other tissues in sixth instar 6 h larvae (Fig. S2). These suggested that 20E promotes CTSD expression and maturation in the midgut.
Figure 3.
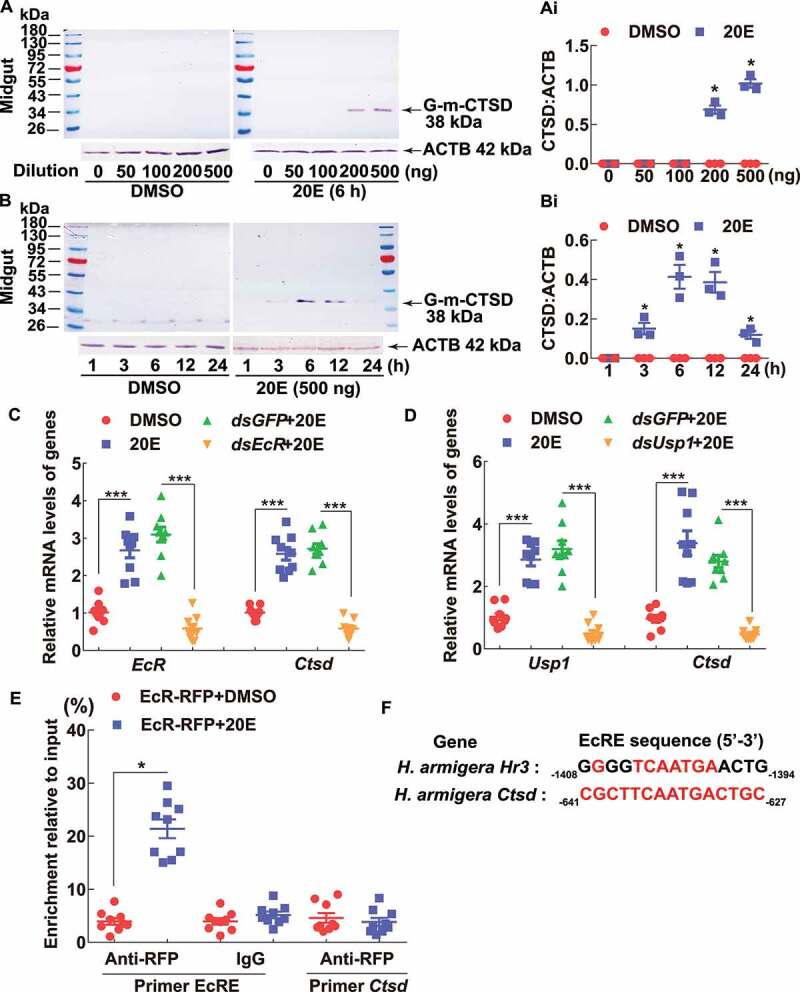
20E promoted G-m-CTSD expression in the larval midgut. (A) 20E promoted G-m-CTSD expression by dose. Different concentrations of 20E were injected into 6th-6 h larva for 6 h. Equal diluted volume of DMSO (0–500) was used as the solvent control. (B) 20E promoted G-m-CTSD expression by time. 500 ng of 20E was injected into 6th-6 h larva for 1 to 24 h. Equal amounts of diluted DMSO were used as solvent control. (Ai and Bi) Statistical analysis of (A and B). ImageJ software was used to transform the image data. (C and D) QRT-PCR analyzed the mRNA levels of Ctsd after knockdown of EcR and Usp1 by dsEcR and dsUsp1 (2 μg for 48 h) in HaEpi cells followed 20E induction (2 μM for 6 h). dsGFP (2 μg for 48 h) was the negative control. DMSO was the solvent control for 20E. (E) ChIP assay of EcR binding to the upstream region of Ctsd using primers (Table S1). EcR-RFP-His was overexpressed from plasmid pIEx-4-RFP-His in cells for 72 h. The cells were treated with 5 μM 20E for 3 h. DMSO treatment was used as control. The statistical analyses were conducted using Student’s t-test (*p < 0.05, ***p < 0.001) based triplicate. The bars indicate the mean ± SD. (F) Alignment of the EcRE in the 5ʹ-upstream of Hhr3 and Ctsd.
EcR, the nuclear receptor of 20E, and its heterodimeric protein, Usp1, were knocked down in HaEpi cells to confirm the upregulation of CTSD expression by 20E. The results showed that the mRNA level of Ctsd decreased after knockdown of EcR and Usp1 (Figure 3 C,D). To understand how 20E upregulated the Ctsd expression via EcR and USP1, we detected the binding of EcR to the ecdysone response element (EcRE) in the 5ʹ-upstream of Ctsd via chromatin immunoprecipitation (ChIP) assay. The overexpressed EcR-RFP-His in the HaEpi cells was confirmed to bound more EcRE-fragment of Ctsd under 20E induction compared to the DMSO (Figure 3E). The EcRE motif (5ʹ–641 CGCTTCAATGACTGC−627-3ʹ, numbered from the ATG of the Ctsd open reading frame) in the 5ʹ-upstream of Ctsd was conserved on the 5ʹ-TCAATG-3ʹ core region with the EcRE in Hhr3 (Helicoverpa hormone receptor 3) [27] (Figure 3F). These data suggested that Ctsd is upregulated by 20E through the binding of EcR to the EcRE motif.
To validate 20E promotes the pro-CTSD expression in the pupal epidermis, we injected 20E into the pupae on day 2. The results showed 20E increased pro-CTSD levels (41 kDa) in the epidermis and G-pro-CTSD (43 kDa) in the blood plasma dependent on dose, compared with DMSO (Figure 4 A,B). Similarly, 20E increased pro-CTSD levels in the epidermis and G-pro-CTSD in the blood plasma dependent on time (Figure 4C,Ci,4D,Di). These results suggested that 20E promotes CTSD expression in the epidermis and secretion of G-pro-CTSD into the blood plasma.
Figure 4.
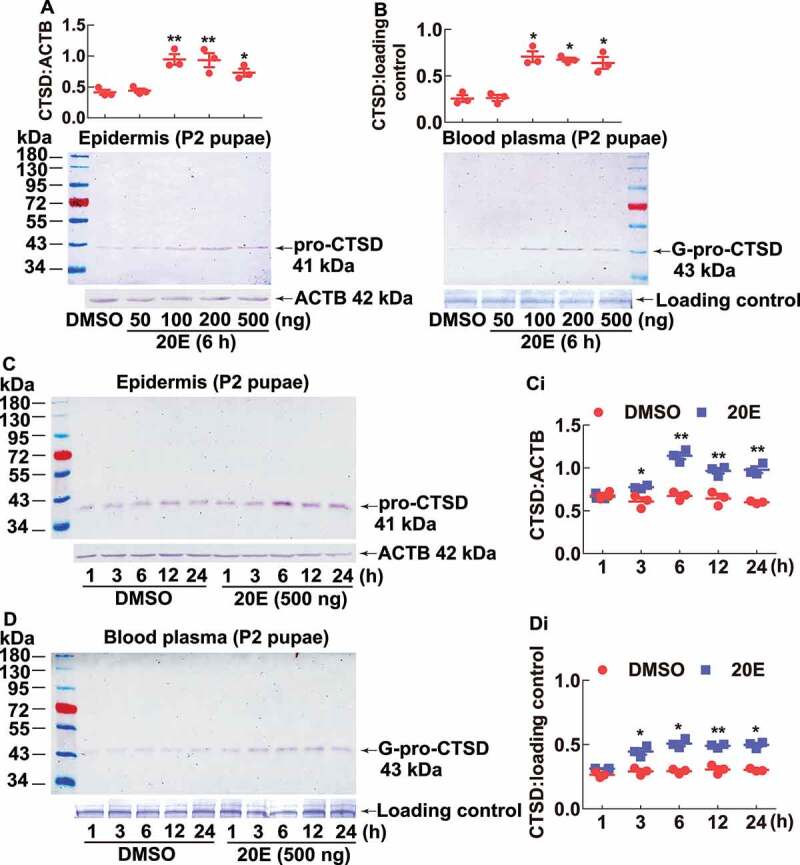
20E promoted pro-CTSD expression in the pupal epidermis and G-pro-CTSD secretion into the blood plasma. (A and B) 20E promoted pro-CTSD expression and G-pro-CTSD secretion by dose. Different concentrations of 20E were injected into a pupa on day 2. Equal diluted volume of DMSO was used as the solvent control. The protein markers are the same as (A). (C and D) 20E promoted pro-CTSD expression and G-pro-CTSD secretion in the blood plasma by time. Equal amounts of diluted DMSO were used as solvent control. ACTB was detected as protein quality control. The loading controls were the proteins of hemolymph by SDS-PAGE as the control for blood plasma. (Ci and Di) Statistical analysis of (C and D). ImageJ software was used to transform the image data. The statistical analysis was conducted using Student’s t-test (*p < 0.05, **p < 0.01) based triplicate. The bars indicate the mean ± SD
Autophagy was required for CTSD maturation
To address the mechanism by which 20E induces CTSD maturation in the midgut, we cultured the midgut tissue in vitro by cutting it into four pieces to expose the gut lumen to the medium. After incubation with MG-132 (a proteasome and calpain inhibitor), 3-methyladenine (3-MA, an autophagosome formation inhibitor), chloroquine (CQ, which inhibits autophagy by changing the lysosomal pH), or Ac-DEVD-CHO (an apoptosis inhibitor) treatment for 1 h, respectively, the tissues were further incubated with 5 µM 20E for 6 h. The results showed that 3-MA treatment decreased the level of G-m-CTSD in the midgut but increased the level of G-pro-CTSD in the culture medium. By contrast, MG-132, CQ, and Ac-DEVD-CHO treatment did not affect the levels of G-m-CTSD in the midgut, and no G-pro-CTSD was detected in the culture medium (Figure 5 A,B). These results suggested that autophagy is required for CTSD maturation.
Figure 5.
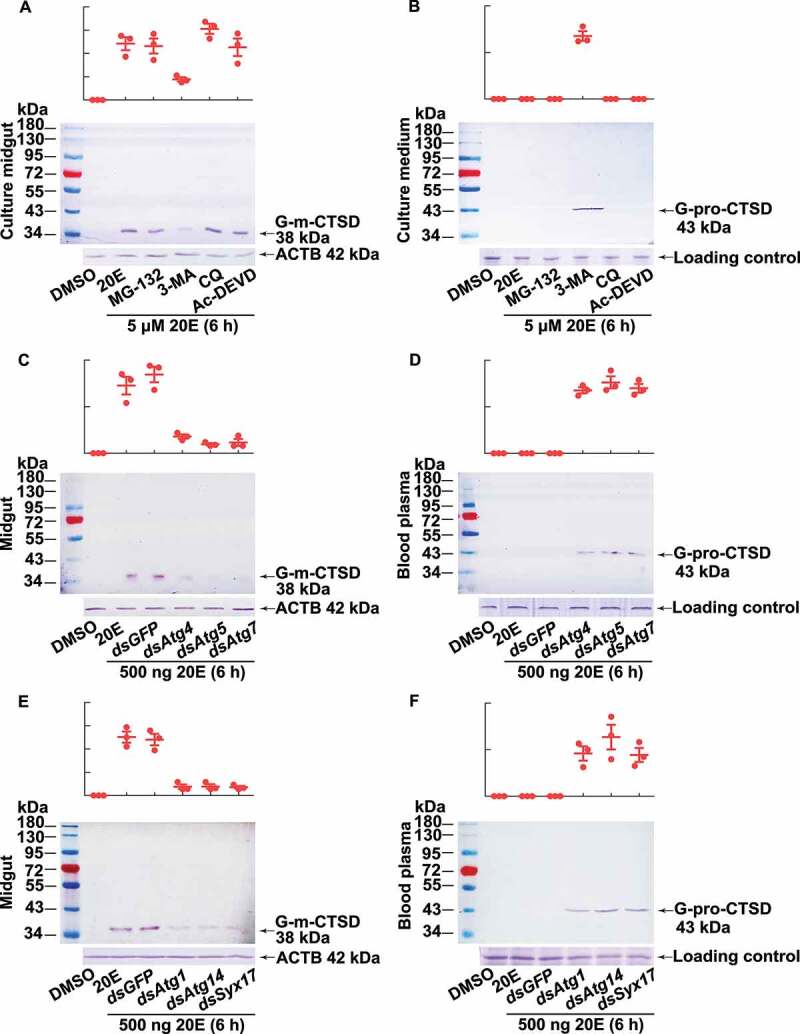
Western blotting showing that CTSD maturation relied on autophagy. (A) G-m-CTSD in the midgut after treatment with different inhibitors. The isolated midgut was cultured in Grace’s medium with MG-132 (2 µM, final concentration), 3-MA (10 µM), CQ (25 µM), and Ac-DEVD/Ac-DEVD-CHO (10 µM) for 1 h, followed by 20E incubation (5 µM for 6 h). DMSO was the solvent control for 20E. (B) The secreted G-pro-CTSD in the culture medium after the treatment as (A). ACTB was detected as protein quality control. Grace’s medium was used for tissue culture medium loading control by SDS-PAGE. (C) G-m-CTSD in the midgut after Atg4, Atg5, and Atg7 knockdown (2 μg dsRNA were injected to sixth instar 6 h larva twice in 48 h), followed by 20E incubation (500 ng for 6 h). dsGFP (2 μg twice in 48 h) was the negative control. (D) The secreted G-pro-CTSD in the blood plasma after Atg4, Atg5, and Atg7 knockdown. (E) G-m-CTSD in the midgut after Atg1, Atg14, and Syx17 knockdown (2 μg dsRNA were injected to sixth instar 6 h larva twice in 48 h), followed by 20E incubation (500 ng for 6 h). dsGFP (2 μg twice in 48 h) was the negative control. (F) The secreted G-pro-CTSD in the blood plasma after Atg1, Atg14, and Syx17 knockdown. ACTB was detected as the protein quality control. The loading controls were the proteins of hemolymph by SDS-PAGE as the control for blood plasma. All experiments were performed in triplicate, and statistical analysis was conducted using ANOVA; different lowercase letters indicated significant differences (p < 0.05). The bars indicate the mean ± SD. ImageJ software was used to transform the image data
To further test this hypothesis, we injected double-stranded RNA (dsRNA) targeting Atg4 (encoding autophagy related 4; dsAtg4), Atg5 (autophagy related 5; dsAtg5), and Atg7 (autophagy related 7; dsAtg7) into sixth instar 6 h larvae to block autophagosome formation and then injected 500 ng 20E for 6 h. The levels of G-m-CTSD decreased in the midgut; however, the levels of G-pro-CTSD increased in the blood plasma after the knockdown of Atg4, Atg5, and Atg7 (Figure 5 C,D). These results confirmed that autophagosome formation is critical for CTSD maturation in the larval midgut.
To further verify our conclusion, Atg1 (autophagy related 1), Atg14 (autophagy related 14), and Syx17 (syntaxin 17) were knocked down by injection of the related dsRNA into sixth instar 6 h larvae to block autophagy initiation and autophagosomes-lysosomes fusion, respectively. The dsGFP was injected as a negative control. The levels of G-m-CTSD was reduced in the midgut; however, the levels of G-pro-CTSD increased in the blood plasma after knockdown of Atg1, Atg14, and Syx17, followed by 500 ng 20E induction for 6 h, respectively (Figure 5 E,F), showing the autophagy initiation and autophagosomes-lysosomes fusion are important for CTSD maturation.
G-m-CTSD promoted midgut PCD by promoting CASP3 activation
To address the function of G-m-CTSD in the midgut, the location of G-m-CTSD in the midgut was analyzed using immunohistochemistry. Pre-immune serum did not produce red fluorescence from the midgut of the sixth instar 96 h wandering larvae. However, anti-CTSD antibodies detected G-m-CTSD in the larval midgut at 6th-96 h and 6th-120 h stages (Figure 6), suggesting that G-m-CTSD plays roles in the larval midgut during metamorphosis.
Figure 6.
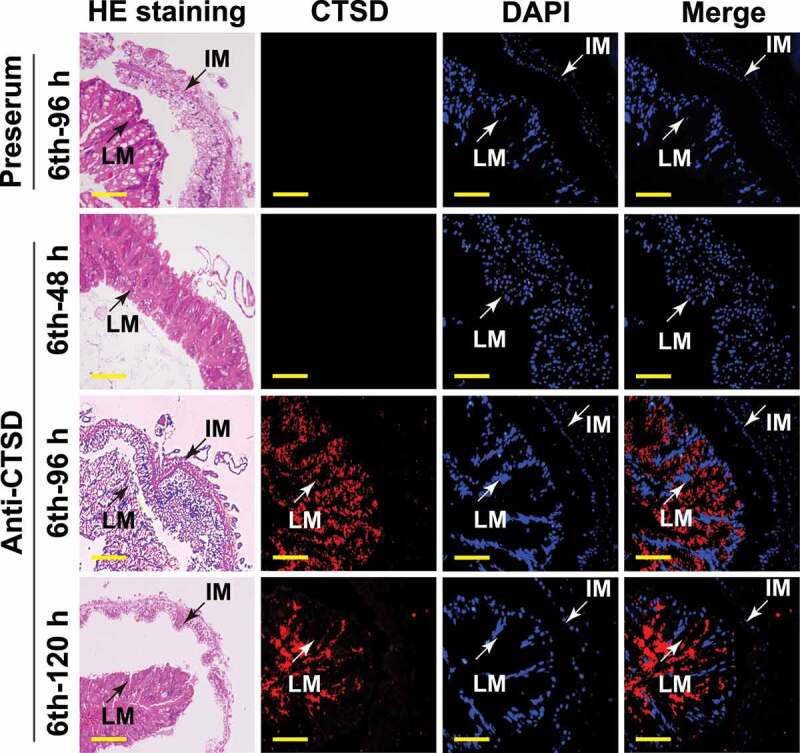
Immunohistochemical analysis shows CTSD localization in the larval midgut during metamorphosis. Rabbit polyclonal antibodies against CTSD were used. The preserum was used as the negative control. LM: larval midgut; IM: imaginal midgut; hematoxylin and eosin (HE) staining showed the morphology of the midgut; Red fluorescence indicates CTSD; Nuclei were stained with DAPI (blue). Scale bar: 50 μm
To address the function of G-m-CTSD in the midgut and metamorphosis, we injected dsRNA targeting Ctsd (dsCtsd) into sixth instar 6 h larvae to knockdown Ctsd. Larval pupation was delayed by 20 h after injection of dsCtsd compared with larvae injected with dsGFP. Moreover, larval pupation was delayed by 30 h after injection with dsCtsd plus 20E, compared with larvae injected with dsGFP plus 20E (Figure 7 A,B) when CTSD expression was effectively knocked down at the mRNA and protein levels (Figure 7 C,D). Meanwhile, the larval midgut in the dsGFP control group exhibited characteristics of PCD at 72 h post the second dsRNA injection, showing a red color, whereas dsCtsd-injected larval midgut did not appear red at that time, exhibited delayed PCD (Figure 7E). The rate of the delayed PCD of dsCtsd-injected larvae was 60.0%, compared with the 8.9% of dsGFP-injected larvae (Figures 7E,Ei). Hematoxylin and eosin (HE) staining showed that the separation of the larval midgut and the imaginal midgut was delayed by dsCtsd injection, compared with that in the dsGFP injection control (Figure 7F). Immunohistochemistry showed that CASP3 was located in larval midguts after injecting dsCtsd or dsGFP for 120 h; however, CASP3 was greatly localized in the nuclei in the dsGFP-injected midgut, but in the cytoplasm in the dsCtsd-injected midgut (Figure 7G). Western blotting further showed that CASP3 could not be cleaved to the active form after dsCtsd injection, compared with that in the dsGFP injection control, which was greatly cleaved to the active form (Figure 7 H,I). These results suggested that G-m-CTSD promotes midgut apoptosis by activating CASP3, therefore promoting pupation.
Figure 7.
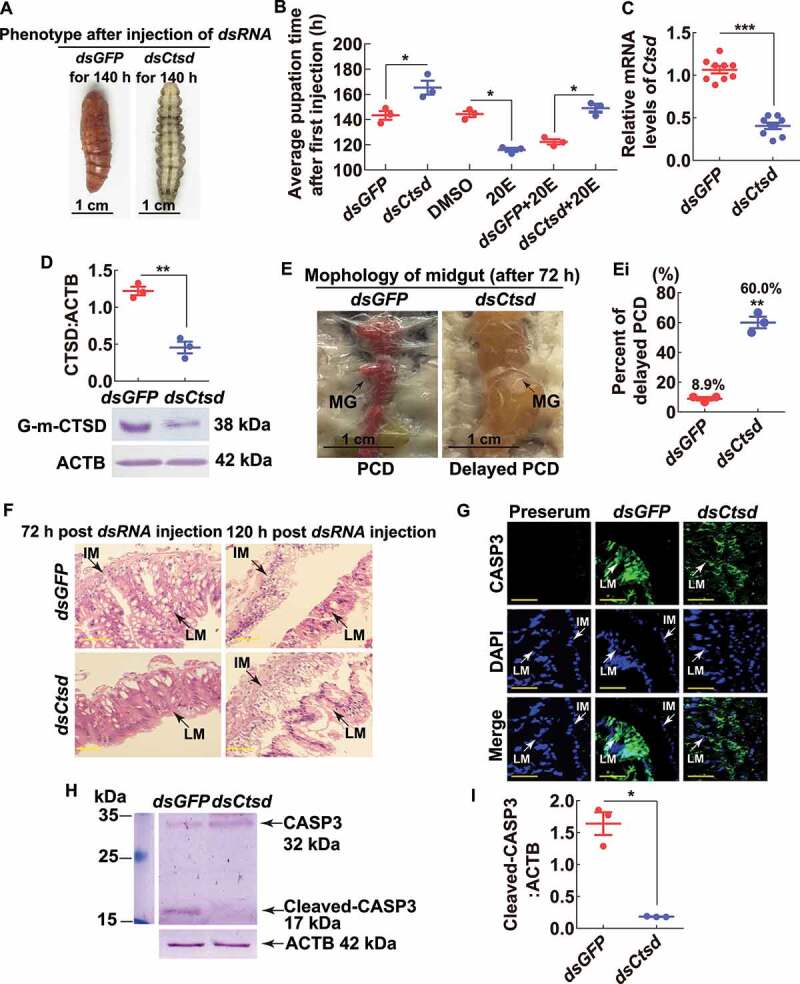
Injection of Ctsd dsRNA repressed midgut apoptosis and delayed larval-pupal transition. (A) Insect phenotypes 140 h after the first dsRNA injection (2 μg, first at sixth instar 6 h larva and the second at sixth instar 32 h larva). The bar represents 1 cm. (B) Statistical analysis of pupation time after dsRNA injection by Student’s t-test based on three repeats. 30 larvae for each repeat in one treatment. (C and D) Efficiency of knockdown of Ctsd by QRT-PCR and western blotting analysis (10% SDS-PAGE gel), respectively. (E) Morphology of the midgut 72 h after the second dsRNA injection. (Ei) Statistical analysis of delayed PCD from (E). (F) HE staining of midgut 72 h and 120 h after first dsRNA injection, respectively. LM: larval midgut; IM: imaginal midgut; Scale bar: 20 µm. (G) CASP3 location in the midgut after dsRNA injection. Rabbit polyclonal antibodies against CASP3 were used as the primary antibody. LM: larval midgut; IM: imaginal midgut; Green fluorescence indicates CASP3; Nuclei were stained with DAPI (blue). Scale bar: 20 μm. (H and I) Western blot and statistical analysis showing the cleaved-CASP3 after dsRNA injection. All experiments were performed in triplicate, and statistical analysis was conducted using Student’s t-test (*p < 0.05, **p < 0.01, ***p < 0.001). The bars indicate the mean ± SD. ImageJ software was used to transform the image data
G-pro-CTSD promoted imaginal fat body formation
The CASP3 was not cleaved in the epidermis during metamorphosis (Fig. S3), which excluded the function of pro-CTSD in apoptosis in the epidermis. To address the function of G-pro-CTSD in the pupal blood plasma/hemolymph, we injected anti-CTSD antibodies into pupal hemolymph at day 2 pupae to neutralize G-pro-CTSD. Anti-CTSD antibodies treatment resulted in an approximately 4-day-delay of emergence in 61.9% individuals, 23.5% dead at the adult stage, and 14.6% normal emergence, compared with larvae injected with IgG as a negative control (Figure 8A–C).
Figure 8.
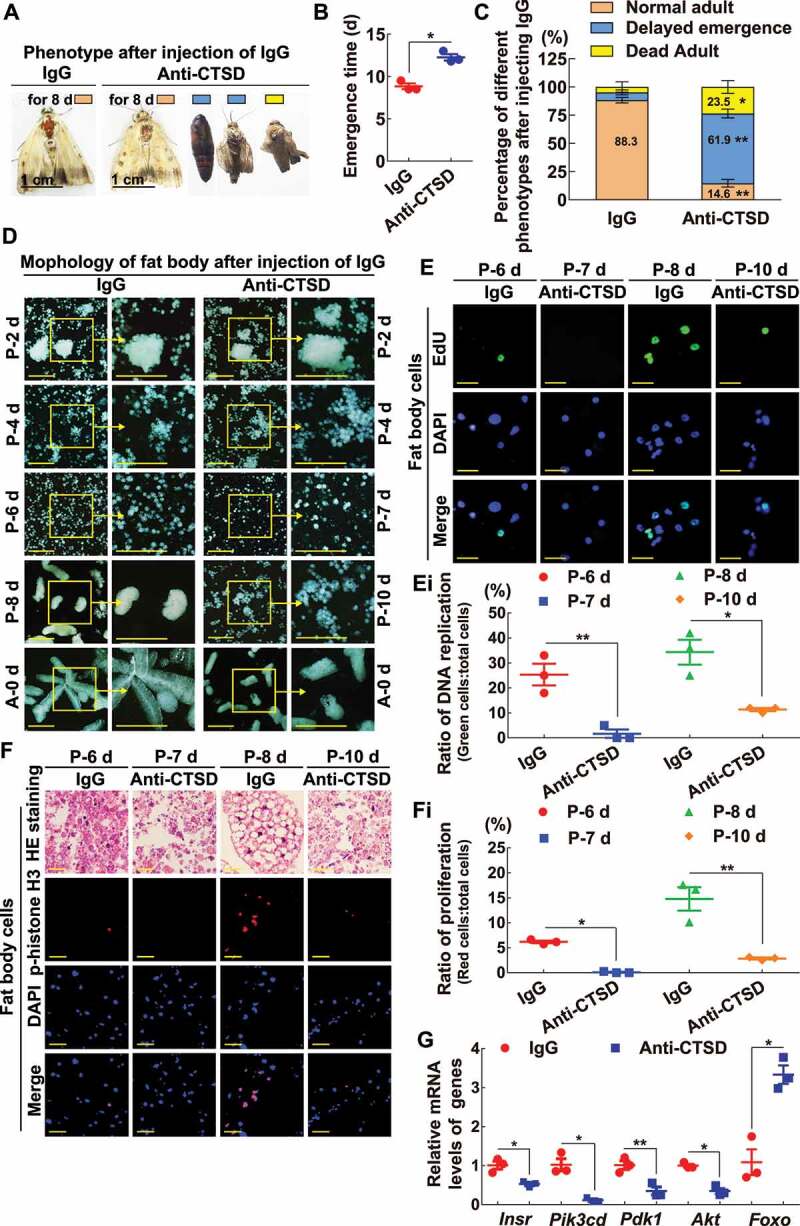
Neutralization of G-pro-CTSD by antibodies repressed imaginal fat body formation and emergence. (A) Phenotype of an adult after injection of anti-CTSD antibodies for 8 d (4 μg was injected into pupa on day 2 and day 4). IgG was a negative control for the antibody. (B) The time of emergence after the antibody injection (from pupa on day 0 to emergence). (C) The percentage of emergence after the antibody injection. The data were analyzed by Student’s t-test (*p < 0.05, **p < 0.01) based three repeats (3 × 30 larvae). (D) Morphology of the fat body after antibody injection. P-2 d to P-10 d: pupae on day 2 to 10. A-0 d: adult on day 0. Arrows indicated magnification. The bars showed 100 μm. (E) EdU staining DNA replication in the fat body after injection of anti-CTSD antibodies. Green fluorescence: EdU staining cells. Blue fluorescence: DAPI staining nuclei. The bars showed 20 μm. (Ei) Statistical analysis of the DNA replication in (E) by the ImageJ software. (F) p-histone H3 (phospho-histone H3) in the fat body after injection of anti-CTSD antibodies. Red fluorescence: phospho-histone H3 detected by anti-phospho-histone H3 (Ser10) antibodies. Blue fluorescence: DAPI staining nuclei. The bars showed 20 μm. (Fi) Statistical analysis of cell proliferation in (F) by the ImageJ software. (G) QRT-PCR detected the mRNA levels of Insr, Pik3cd, Pdk1, Akt, and Foxo after two days of injecting anti-CTSD antibodies and IgG. All of the experiments were conducted in equal development stages of equal eye pigment. The statistical analysis was performed using three independent replicates by Student’s t-test. Asterisks denote significant differences (*p < 0.05, **p < 0.01)
To address the mechanism of delayed-emergence by anti-CTSD antibody neutralization, the fat body morphology was observed at the equivalent stage of development after injecting IgG and anti-CTSD antibodies according to the ommateum (the compound eye) pigmentation, a marker of adult developmental stages (Fig. S4), to overcome the delayed effect on the fat body by the antibody neutralization. The dissociation of the larval fat body was not repressed from day 2 to day 4 pupae (P-2 d and P-4 d) by anti-CTSD antibodies injection. However, the adult fat body was not formed normally until day 10 pupae (P-10 d) and adult (A-0 h), compared with that formed at day 8 pupae (P-8 d) and adult in the IgG control in the equal developmental stages according to eye pigmentation (Figure 8D). These data suggested that the neutralization of G-pro-CTSD in the hemolymph repressed the formation of the adult fat body.
Cell proliferation was examined considering the pro-cell proliferation characters of the pro-CTSD in the mammal. 5-Ethynyl-2´-deoxyuridine (EdU) staining of fat body showed that DNA replication was repressed in the adult fat body both at P-7 d and P-10 d after injection of anti-CTSD antibodies, compared with that at P-6 d and P-8 d after IgG injection (Figure 8E,Ei). Similarly, treatment with anti-phospho-histone H3 (Ser10) antibodies showed that cell proliferation was also repressed by injection of anti-CTSD antibodies, compared with that at P-6 d and P-8 d after IgG injection (Figure 8F,Fi). In addition, QRT-PCR showed decreased expression of the Insr (insulin receptor), Pik3cd (phosphatidylinositol-4,5-bisphosphate 3-kinase catalytic subunit delta), Pdk1 (phosphoinositide-dependent protein kinase-1), and Akt, which promote cell growth and proliferation [28,29], but increased Foxo (forkhead box O) expression, which promotes apoptosis [30], in the fat body after anti-CTSD antibodies injection, compared with that after IgG injection (Figure 8G). The adult midgut was not affected after the injection of anti-CTSD antibodies by HE staining (Fig. S5). The 20E titer was confirmed not affected by injection of anti-CTSD antibodies by comparison with IgG injection at the same stage, respectively (Fig. S6). These results suggested that G-pro-CTSD in the hemolymph plays an important role in adult fat body reassociation, endoreplication, and cell proliferation.
Pro-CTSD promoted cell proliferation, and m-CTSD promoted apoptosis
To confirm the functions of m-CTSD promoting apoptosis and pro-CTSD promoting cell proliferation, we overexpressed them in HaEpi cells by fusing them with RFP. The m-CTSD-RFP was detected in the cell lysate, whereas pro-CTSD-RFP was detected in the culture medium using western blotting (Figure 9A). No CASP3 activity was detected in the RFP and pro-CTSD-RFP overexpressing cells. However, higher CASP3 activity was detected in the m-CTSD-RFP overexpressing cells (Figures 9B,Bi). In contrast, higher EdU signals and phospho-histone H3 levels were detected from pro-CTSD-RFP overexpressing cells; however, fewer such signals were detected and no difference with the RFP in m-CTSD-RFP-overexpressing cells (Figure 9C,Ci,D,Di). These results confirmed that pro-CTSD promoted cell proliferation and m-CTSD promoted apoptosis.
Figure 9.
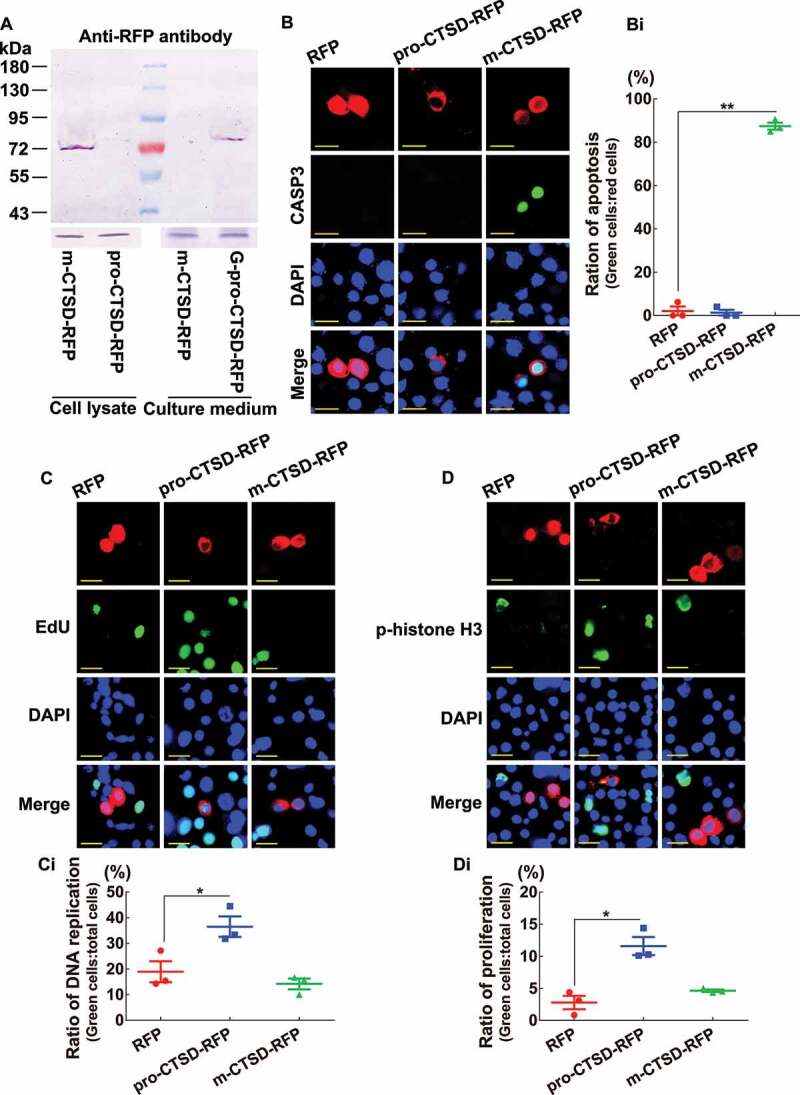
M-CTSD induced apoptosis and pro-CTSD promoted cell proliferation. (A) Western blot showing the overexpression of m-CTSD-RFP and pro-CTSD-RFP in HaEpi cells in Grace’s medium, respectively. An antibody against RFP was used. ACTB and Grace’s medium were used as loading controls for cell lysate and culture medium, respectively (10% SDS-PAGE gel). (B) Detection of cell apoptosis by CASP3 activity. Red fluorescence represents RFP, pro-CTSD-RFP, or m-CTSD-RFP. Green fluorescence represents the CASP3 activity, as assessed using a CASP3 activity detection kit. Blue fluorescence indicates DAPI-stained nuclei. Merge: the superimposed images of the red, green, and blue fluorescence. Scale bar: 20 μm. (Bi) Statistical analysis of CASP3 active cells in (B). (C) Detection of DNA replication by the EdU assay. Red: RFP, pro-CTSD-RFP, and m-CTSD-RFP; Green: EdU; Blue: nucleus stained with DAPI; Merge: the overlapped red, green, and blue fluorescence. Bar: 20 μm. (Ci) Statistical analysis of EdU in (C). (D) Detection of cell proliferation by anti-phospho-histone H3 (Ser10) antibodies. Red: RFP, pro-CTSD-RFP, and m-CTSD-RFP; Green: phospho-histone H3; Blue: nucleus stained with DAPI; Merge: the overlapped red, green, and blue fluorescence. Bar: 20 μm. (Di) Statistical analysis of phospho-histone H3 in (D). All the experiments were performed in triplicate, and statistical analysis was conducted using Student’s t-test (*p < 0.05, **p < 0.01). The bars indicate the mean ± SD
To validate that G-pro-CTSD promoted endoreplication and cell proliferation, the G-pro-CTSD was purified from the blood plasma of day 2 pupae by CNBr-activated Sepharose 4B column combined with anti-CTSD antibodies and added into Grace’s medium for 12 h to culture HaEpi cells. The results showed higher EdU signals and phospho-histone H3 levels were detected from G-pro-CTSD incubated cells, compared with bovine serum albumin (BSA) (Figure 10A,Ai,B,Bi) when the purity of G-pro-CTSD was confirmed (Figure 10C). These data suggested that pro-CTSD promotes endoreplication and cell proliferation.
Figure 10.
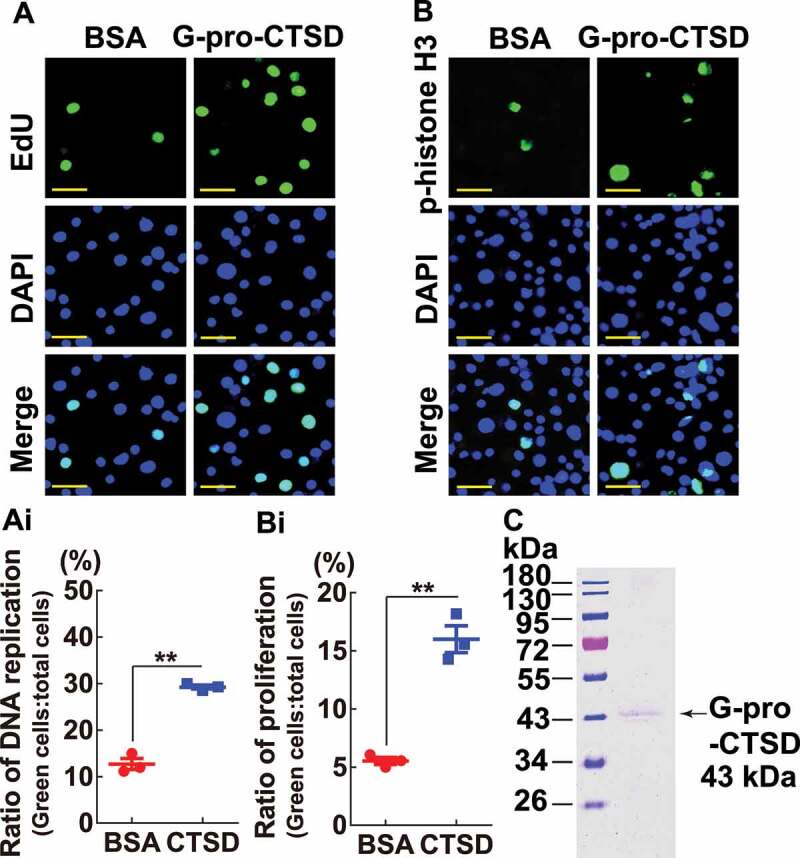
G-pro-CTSD promoted DNA replication and cell proliferation. (A and B) Detection of DNA replication and cell proliferation by EdU and anti-phospho-histone H3 (Ser10) antibodies, respectively. The cells were incubated with Grace’s medium with 200 ng/ml G-pro-CTSD for 12 h, with BSA as a control. Green: EdU or phospho-histone H3; Blue: nucleus stained with DAPI; Merge: the overlapped green and blue fluorescence. Bar: 20 μm. (Ai and Bi) Statistical analysis of (A and B). All experiments were performed in triplicate, and statistical analysis was conducted using Student’s t-test (**p < 0.01). The bars indicate the mean ± SD. (C) Detection of G-pro-CTSD purity by 12.5% SDS-PAGE
Analysis of the mechanism of different expression and maturation of CTSD in tissues
A previous study suggested that 20E promotes autophagy and apoptosis sequentially in the midgut of H. armigera at different concentrations [19]. To address the mechanisms of the different expression and maturation of CTSD in tissues, we analyzed the 20E titer in the hemolymph at different developmental stages and determined related gene expression. The 20E titer was about 0.27 μg/ml hemolymph (0.56 μM) at larval feeding stages (from 6th-6 h to 24 h), and then increased markedly from 6th-72 h wandering stage to reach 4.47 μg/ml in the hemolymph (9.30 μM) at 6th-120 h. The 20E titer decreased to a very low level in new pupae, and then markedly increased to 4.85 μg/ml in the hemolymph (10.09 μM) on pupae day 4, before decreasing to a low titer on pupae day 8 (Figure 11A). However, the 20E titer was different in various tissues of 6th instar 96 h larvae: 1.5 μg/g (3 μM) in the hemolymph, 1 μg/g (2 μM) in the midgut and 0.5 μg/g (1 μM) in the epidermis and fat body (Figure 11B), implying a relationship between the 20E titer and different CTSD expression levels in tissues.
Figure 11.
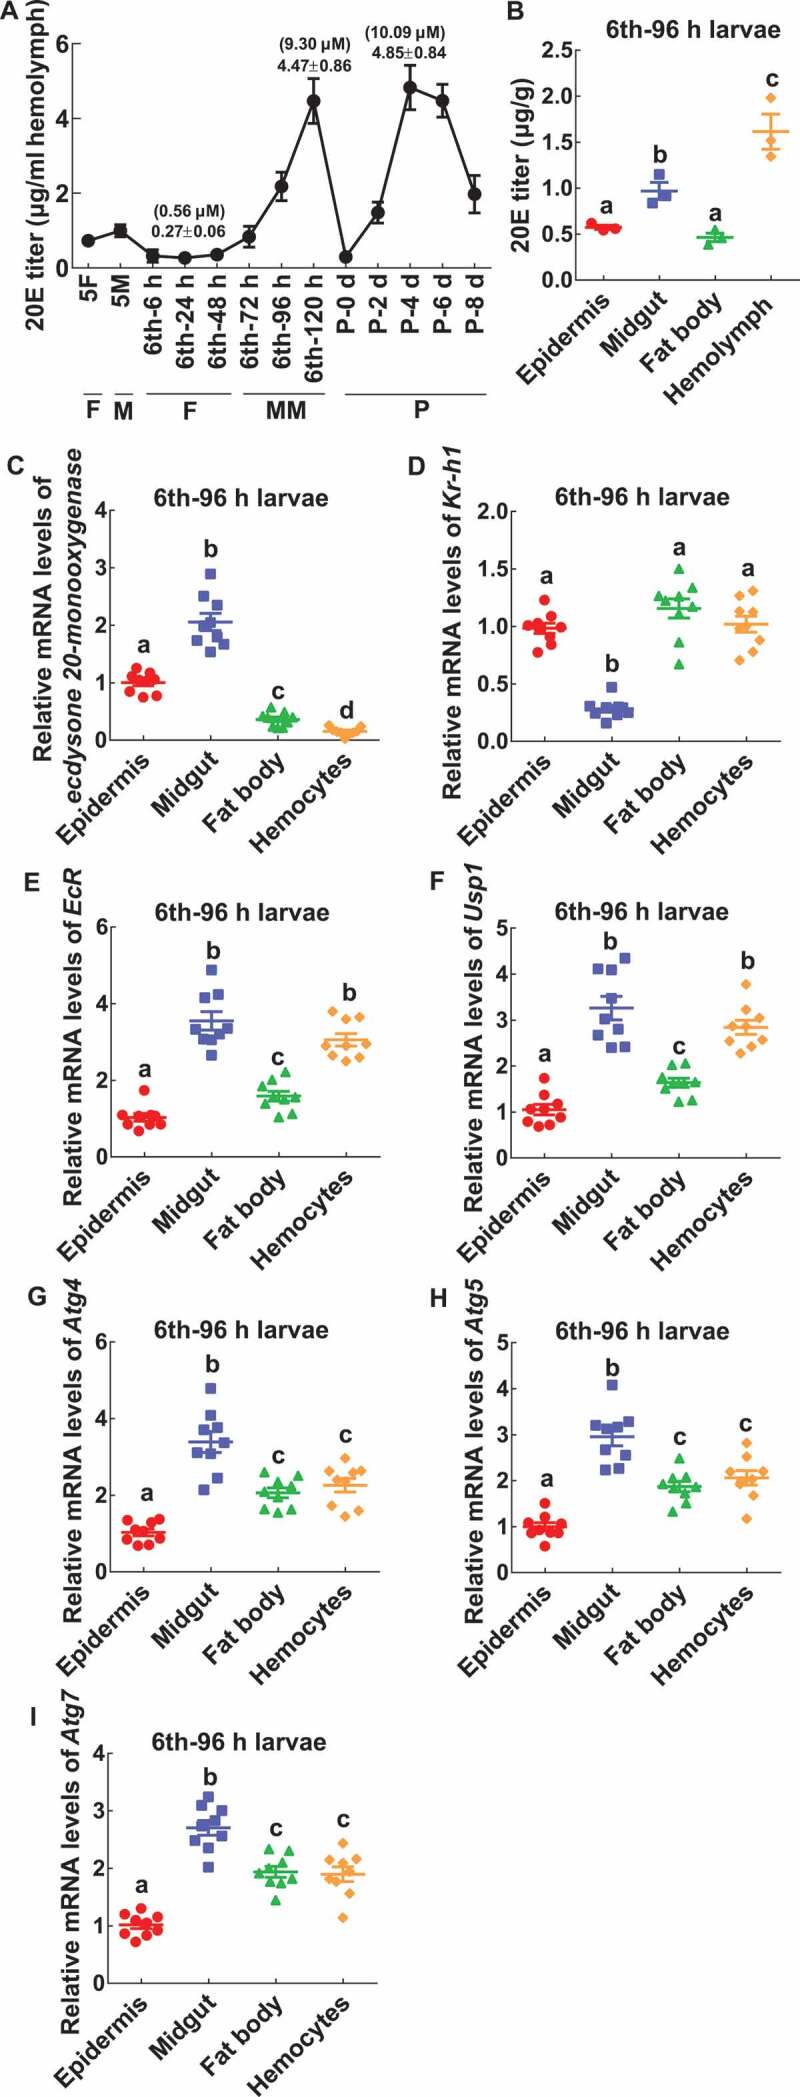
The 20E titer and gene expression in tissues. (A) The 20E titer in the hemolymph. (B) The 20E titer in tissues. (C-I) The relative mRNA levels of ecdysone 20-monooxygenase, Kr-h1, EcR, Usp1, Atg4, Atg5, and Atg7. All the experiments were performed in triplicate, and statistical analysis was conducted using ANOVA; different lowercase letters indicate significant differences (p < 0.05). The bars indicate mean ± SD
In addition, the expression levels of various genes were examined in tissues to address the mechanisms of the different expression and maturation of CTSD in tissues. The mRNA level of ecdysone 20-monooxygenase (GenBank accession number: XP_021191112.1) was higher in the midgut than those in the epidermis, fat body, and hemocytes (Figure 11C). Level of Kr-h1 (Krueppel homologous protein 1) (GenBank accession number: XP_021191291.1) was lower in the midgut than in the epidermis, fat body, and hemocytes (Figure 11D). The mRNA levels of EcR, Usp1, and autophagy-related genes (Atg4, Atg5, and Atg7) were higher in the midgut than in the epidermis, fat body, and hemocytes (Figure 11E–I). These data suggested a relationship between the expression and maturation of CTSD and the gene expression in tissues.
Discussion
To understand insect development and to develop cancer therapies, it is important to determine the mechanisms underlying the dual functions of CTSD in apoptosis and cell proliferation. The present study revealed that the steroid hormone 20E promotes CTSD expression. Autophagy triggers the maturation of CTSD to promote apoptosis. Glycosylation of CTSD at N233 allows the secretion of pro-CTSD into the blood plasma to enhance endoreplication, cell proliferation, and reassociation of the adult fat body. Tissue-specific expression and maturation of CTSD determine the fates of different tissues.
20E promotes CTSD expression and maturation in the midgut
In mammals, CTSD is upregulated by the steroid hormone estrogen [31,32] via estrogen nuclear receptors ESR1 and ESR2 [33]. We revealed that 20E upregulates CTSD via its nuclear receptor transcription complex EcR-USP1 binding to an EcRE in the Ctsd promoter. These data suggested that the induction of CTSD expression by steroid hormones is conserved from insects to mammals. Our research further revealed that the 20E titer increased during metamorphosis, which was consistent with the CTSD expression profile.
20E and juvenile hormone (JH) have opposite effects on the regulation of the larval–pupal transition [26]. JH, via Kr-h1, inhibits ecdysone biosynthesis in the prothoracic gland (PGs) of Drosophila and Bombyx to resist metamorphosis. By contrast, 20E represses Kr-h1 expression to allow metamorphosis [34,35]. We found the titer of 20E is higher in the midgut than in epidermis and fat body. The transcript levels of genes in the 20E-pathway, including ecdysone 20-monooxygenase, which catalyzes ecdysone to 20-hydroxyecdysone [36], EcR, Usp1, and Atgs, were higher in the midgut than in other tissues. In contrast, the expression of Kr-h1, the key transcription factor in JH signaling [37], was low in the midgut. These data suggested that the expression and maturation of CTSD in the midgut are related to the 20E titer and gene expression.
Autophagy triggers the maturation of CTSD to promote apoptosis
The mechanism of CTSD maturation is not well understood [38]. Some studies suggested that cysteine proteases are involved in the cleavage of pre-pro-CTSD to a 48 kDa form and that CTSB (cathepsin B) or CTSL (cathepsin L) are involved in the cleavage of CTSD to the 34 kDa mature form [39]. In the present study, we observed that G-m-CTSD existed in the larval midgut. However, blocking autophagy using 3-MA and knockdown of Atg1, Atg4, Atg5, Atg7, Atg14, and Syx17 repressed CTSD maturation and resulted in G-pro-CTSD being released into the hemolymph. 3-MA inhibits the formation of the autophagosome [40]. ATG1 and ATG14 are vital for the initiation of autophagy [41,42]. ATG4, ATG5, and ATG7 are essential for the formation of the autophagosome [43,44]. SYX17 is necessary for the maturation of autophagosome and fusion with lysosome [45]. Our data suggested that autophagy triggered CTSD maturation and retained it in midgut cells.
CTSD is a lysosomal enzyme and exists in autolysosome in autophagy [46,47]. CTSD is released to the cytosol by lysosomal membrane permeabilization in the autophagy-dependent way to trigger CASP3-dependent cell death in K562/ADM cells [48]. The lysosome membrane permeability can be affected by lysosomal-targeted BAX-facilitated autophagic cell death [49]. The products by lysosomal degradation can be exported by lysosomal membrane transporters [50]. The degraded components in autolysosomes are released into the cytosol by lysosomal efflux permeases [51]. In addition, some ATGs have functions in secretion and exocytosis cargo [52,53]. CTSL (cathepsin L) and CTSB (cathepsin B) are released out of autolysosome to induce apoptosis [54]. H. armigera CTSD is supposed to be released from autolysosome to cytosol to activate CASP3 via a similar mechanism.
20E promotes both autophagy and apoptosis in Lepidoptera [55,56]. Autophagy and apoptosis occur sequentially in the midgut in lepidopteran insects [57]. 20E promotes the transformation of autophagy to apoptosis by increasing Ca2+ influx in the midgut of H. armigera, and apoptosis relies on autophagy [19]. The results of the present study provided further evidence that autophagy determines apoptosis by triggering CTSD maturation, which, in turn, promoted CASP3 cleavage and activation to induce apoptosis.
Glycosylation at N233 is necessary for the secretion of pro-CTSD
CTSD is a glycoprotein [58]. However, the significance of CTSD glycosylation is unknown. In the present study, we revealed that glycosylation at N233 is necessary for the secretion of pro-CTSD. The non-glycosylated-pro-CTSD is located in epidermal cells. The glycosylated-pro-CTSD was released from epidermal cells into the blood plasma. The possible reason why G-m-CTSD was not released out of the midgut after it was glycosylated is the action of autophagy, which arrested G-m-CTSD in the midgut cells.
H. armigera CTSD shares 76% identity with the B. mori CTSD [24,25]. However, BmCTSD is expressed in the larval fat body at the final instar and larval gut at the pupal stage for PCD of the larval fat body and midgut, whereas H. armigera CTSD is expressed in the larval midgut to promote apoptosis and in the pupal epidermis to secrete and promote adult fat body proliferation, respectively. H. armigera CTSD shares 67% identity with the Drosophila CTSD, and 54% identity with the human CTSD. The glycosylation sites around N233 of H. armigera CTSD are predicted in other species of insects and mammals, e.g., N263 in humans [2], N236 in Drosophila, and N255 in B. mori (Fig. S7), suggesting conservation of glycosylation in this protein region.
Tissue-specific expression and maturation of CTSD determine different tissue fates
CTSD plays dual functions in apoptosis and cell proliferation in mammals [59,60]. M-CTSD promotes apoptosis and pro-CTSD promotes cell proliferation in humans [2]. Our study revealed that m-CTSD was specifically localized in the larval midgut during metamorphosis, where it has a pro-apoptotic function. In addition, pro-CTSD was specifically expressed in the pupal epidermis, and it is secreted into the blood plasma for endoreplication, cell proliferation, and reassociation of the adult fat body. These data indicated that the specific expression and maturation of CTSD determine tissue fate, and its dual functions, whereby m-CTSD promotes apoptosis and pro-CTSD induces cell proliferation, are conserved from insects to humans.
In Drosophila, the larval fat body dissociates during metamorphosis and retained in the adult stage, and apoptosis and autophagy occur after adult emergence [61]. The imaginal fat body arises by proliferation from adepithelial cells that associate with imaginal discs in Drosophila [62]. By contrast, proteases-mediated apoptosis [63], dissociation [64,65], or autophagy [66] are believed to be the mechanisms of larval fat body histolysis at early pupal stages during metamorphosis in Lepidoptera, and then the larval fat body is remodeled or reassociated to form adult fat body [67]. However, mitosis was not observed during adult fat body formation in the butterfly Calpodes ethlius [68]. Here, we revealed, for the first time, that both endoreplication and cell proliferation occurred during adult fat body formation. EdU is a novel thymidine analog that is incorporated into the DNA to indicate DNA synthesis [69], and the phospho-histone H3 indicates chromosome condensation during mitosis and meiosis [70]. However, the cell proliferation signal was weaker than the DNA replication signal during adult fat body formation, suggesting that endoreplication is the dominant process during adult fat body formation. Endoreplication is an endocycle involving DNA replication, but not cell division. Endoreplication is widespread in insects, plants, and mammals, leading to polyploidy as an advantageous strategy for the growth of terminally differentiated cells and tissues [71]. Endoreplication has also been observed in cancer tissues, inducing survival advantages [72].
In addition to endoreplication and cell proliferation, we also observed that the dissociated fat body could not be reassociated when G-pro-CTSD was neutralized using the antibodies. The secreted CTSD functions as an extracellular ligand to increase cell proliferation via activation of MAPK1/ERK2-MAPK3/ERK1 and AKT in epithelial ovarian cancer [14]. The possible receptor of pro-CTSD, other than the M6PR that binds M6P on pro-CTSD, is unclear [2]. We also detected decreased Akt expression in the fat body after neutralization of G-pro-CTSD by anti-CTSD antibodies, suggesting that G-pro-CTSD may function via an AKT-related pathway.
The imaginal midgut occurs cell proliferation at the final instar larval stage [73]. The wing imaginal discs have grown to full size by pupation in H. armigera [74]. The wings mitosis occurs at earlier pupal stages [75]. Therefore, the imaginal midgut was little affected, but the wings appeared abnormal after the neutralization of G-pro-CTSD. Whether the G-pro-CTSD in hemolymph promotes cell proliferation in other tissues, such as the epidermis, requires further study.
In conclusion
The results of the present study suggested that pro-CTSD, G-pro-CTSD, and G-m-CTSD were expressed in the epidermis, hemolymph, and midgut differently. The steroid hormone 20E upregulates pro-CTSD expression. Pro-CTSD is glycosylated at N233, which determines its secretion. 20E, via autophagy, induces G-pro-CTSD maturation, and arrests G-m-CTSD inside midgut cells to promote CASP3 activation and larval midgut apoptosis. G-pro-CTSD is released into the blood plasma from the pupal epidermis to promote endoreplication, cell proliferation, and reassociation to form the adult fat body (Figure 12).
Figure 12.
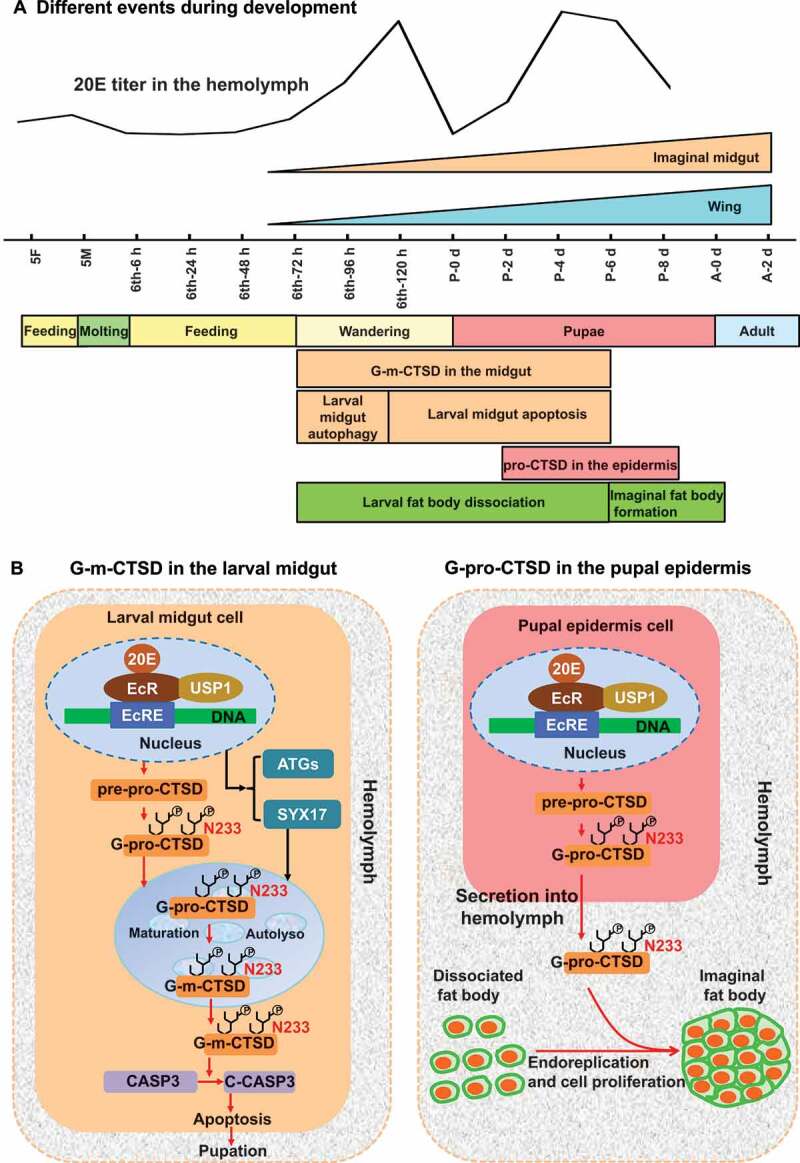
The chart to interpret the mechanisms of CTSD expression, maturation, secretion, and the dual functions in tissue remodeling under 20E regulation. (A) The time of different events during H. armigera development. (B) Mechanisms of CTSD plays dual functions. In the larval midgut, 20E upregulates CTSD expression and maturation during metamorphic molting. 20E via autophagy triggers G-pro-CTSD maturation to G-m-CTSD, which is retained inside the midgut cells to promote apoptosis by inducing CASP3 cleavage. In the pupal epidermis, G-pro-CTSD was secreted to hemolymph, and N233 glycosylation determines G-pro-CTSD secretion. In the hemolymph, the G-pro-CTSD promotes endoreplication, cell proliferation, and reassociation of the adult fat body. pre: signal peptide; pro: pro-peptide; Autolyso: autolysosome; C-CASP3: cleaved-CASP3
Materials and Methods
Insects
Helicoverpa armigera specimens were obtained originally from the Henan Agriculture University, Zhengzhou, China, and were maintained in our laboratory at 27 ± 1°C under a light with a 14:10 h light-dark cycle. The larvae were reared on the artificial diet described in previous work [76].
Cloning of the full-length cDNA and sequence analysis
A full-length cDNA sequence for Ctsd was obtained by H. armigera midgut transcriptome sequencing in our laboratory. The sequence has been submitted to GenBank and the accession number is MH151895. The cDNA encodes a pre-pro-CTSD of 384 amino acids with a calculated molecular mass of 41 kDa, which contains a signal peptide (18 amino acids, aa) and pro-CTSD (with the pro-peptide of 24 aa after signal peptide and the mature CTSD of 342 aa, with a calculated molecular mass of 36 kDa) (Fig. S8). Sequence alignment was done with the DNAMAN 4.0 software from Lynnon Corporation (http://www.lynnon.com/). The signal peptide, propeptide, aspartyl proteases active sites, and N-linked glycosylation sites were predicted using ScanProsite (http://www.expasy.org/tools/scanprosite/). The EcRE motif was predicted using the promoter binding site prediction software (http://jaspar.binf.ku.dk/cgi-bin/jaspar_db.pl) with the 5ʹ upstream sequence of Ctsd obtained from the genome of H. armigera in https://www.ncbi.nlm.nih.gov/genome/annotation_euk/all/.
Cell culture
The Helicoverpa armigera epidermal cell line (HaEpi) was established from H. armigera epidermis and has previously been well characterized [77]. HaEpi cells were developed as a loosely attached monolayer and were maintained at 27°C with Grace’s insect cell culture medium (Gibco, 11300–043) containing 10% fetal bovine serum (Gibco, 16140063).
Preparation of polyclonal antibodies against CTSD
The full-length cDNA of Ctsd was amplified with the selected primers CtsdexF/R (Table S1) and was inserted into plasmid pET30a(+) (Novagen, 69909–3). The recombinant plasmid was transformed into competent Escherichia coli (BL21-DE3) (Solarbio Life Sciences, C1400). CTSD was expressed and formed in inclusion bodies. After denaturation and refolding, the target protein was isolated by SDS-PAGE and the target protein band was cut from the gel and used as an antigen to produce rabbit polyclonal antibodies (Anti-CTSD antibodies) using the method described previously [78]. (NH4)2SO4 (Solarbio Life Sciences, A8820) precipitation of the antibodies was performed and the product was further subjected to affinity purification with the overexpressed CTSD in E. coli conjugated to a CNBr-activated Sepharose 4B column (General Electric Healthcare, 17-0430-01).
Western blot
The epidermis from the fifth instar to adult day 4 was dissected, free from muscles and subepidermal fat body, washed with phosphate-buffered saline (PBS; 140 mM NaCl, 2.7 mM KCl, 10 mM Na2HPO4, 1.8 mM KH2PO4, pH 7.4). The midgut from the fifth instar to adult day 4 was dissected and remove the chyme of midgut, washed with PBS. The fat body from the fifth instar to adult day 4 was dissected, washed with PBS. Hemolymph from larvae at different developmental stages was extracted and added to an equal amount anticoagulant (450 mM NaCl, 10 mM KCl, 10 mM EDTA [Sangon Biotech, A500895], 10 mM HEPES [Solarbio Life Sciences, H1070], pH 7.45). After centrifugation at 1000 × g, the supernatant was diluted with PBS (1:8).
Proteins (50 μg) extracted from the tissues at different developmental stages were separated using 10% SDS-PAGE (Beyotime Biotechnology, P0690) and transferred onto a nitrocellulose membrane (Solarbio Life Sciences, YA1711). After being blocked with blocking buffer (2% nonfat milk [Beyotime Biotechnology, P0216] in tris-buffered saline [TBS; 150 mM NaCl, 10 mM Tris-HCl, pH 7.5]), the membrane was incubated with antiserum against H. armigera CTSD (1:500 diluted in 3% nonfat milk in TBS). The membrane was then incubated with the secondary antibody alkaline phosphatase (AP)-conjugated goat anti-rabbit IgG (ZSGB-Biology, ZB2308) (1:10000 in the blocking buffer) sequentially using our previously reported method [79]. The ACTB was detected with a rabbit monoclonal antibody against human ACTB (ABclonal Technology, AC026). A monoclonal antibody against the red fluorescent protein (RFP; ABclonal Technology, AE020) was diluted 1:5000 in 3% nonfat milk in TBS to detect the overexpressed CTSD-RFP. The secondary antibody was AP-conjugated horse anti-mouse IgG (ZSGB-Biology, ZB2310) (1:10000 in the blocking buffer). The western blotting signal was observed in 10 ml of a TBS solution combined with 45 μl of 75 mg/ml p-nitro-blue tetrazolium chloride/NBT (Sangon Biotech, 298-83-9) and 35 μl of 50 mg/ml 5-bromo-4-chloro-3-indolyl phosphate/BCIP (Sangon Biotech, 6578-06-9) in the dark for 20 min. The protein markers used for western blotting were from Thermo Fisher Scientific (26616), with molecular masses from 10 kDa-170 kDa, or 10 kDa-180 kDa.
Tissue culture
The epidermis, midgut, and fat body were dissected from the day 2 pupae (P-2 d) and cut into four segments and cultured in 24-well plates with 100 μl Grace’s medium with serum for 12 h. Tissue proteins were extracted and Grace’s medium was collected for western blotting. In inhibition experiments, the midgut from three sixth instar 6 h larvae were cut into four pieces and cultured in 24-well plates with 100 μl Grace’s medium with serum for 12 h. Subsequently, the midgut was added with 2 µM MG-132 (Selleck Chemicals, S2619), 10 µM 3-MA (Selleck Chemicals, S2767), 25 µM CQ (Sangon Biotech, A506569), or 10 µM Ac-DEVD-CHO (Biotium, 99969) for 1 h and then incubated with 5 µM 20E (Sigma- Aldrich, H5142) for 6 h. DMSO (Solarbio Life Sciences, D8371) was used as the solvent control of 20E. MG-132 was used to inhibit proteasome and calpain activities [80], 3-MA inhibited autophagosome formation [81], CQ was used to inhibit autolysosome acidification [82], and Ac-DEVD-CHO was an inhibitor of apoptosis [19]. The concentration of all inhibitors was the final concentration. Proteins from various experiments were used for western blotting with rabbit antiserum against H. armigera CTSD and AP-conjugated goat anti-rabbit IgG.
Quantitative real-time reverse transcription PCR (QRT-PCR)
cDNA was synthesized using a FastQuant RT Kit (TIANGEN BIOTECH, KR140818). QRT-PCR was carried out with a Power 2× SYBR real-time PCR pre-mixture (BioTeke Corporation, PR7011) using a real-time thermal cycler (Bio-Rad, CA, USA) and the primers (Table S1). H. armigera ACTB (GenBank number EU52707) was used as the internal standard. The data from 3 independent experiments and 3 technique repeats were analyzed by 2−ΔΔCT method (ΔΔCT = ΔCTtreated sample-ΔCTcontrol, ΔCT = CTgene- CTActb) [83].
Examination of glycosylation of CTSD
The PNGase reagent (New England Biolabs, P0704) was used to remove N-glycosylation according to the manufacturers’ instructions. The epidermis, midgut, and blood plasma proteins at P-2 d stage were extracted using 40 mM Tris-HCl buffer, pH 7.5. Proteins (10 μg proteins in 9 μl Tris-HCl buffer) were added with 1 μl of 10 × glycoprotein denaturing buffer (5% SDS, 4 mM DTT; New England Biolabs, B1704 S) and boiled at 100°C for 10 min. Subsequently, 2 μl of 10 × glycobuffer 2 (500 mM Sodium phosphate, pH 7.5; New England Biolabs, B3704 S), 2 μl of 10% NP-40 (New England Biolabs, B2704 S) and 1 μl of PNGase were added, and water was added to 20 μl, followed by incubation at 37°C for 1 h. The control group was incubated in at equal volume protein denaturation solution and then incubated in boiling water at 100°C for 10 min. The samples were examined by western blotting with antiserum against H. armigera CTSD (1:500 diluted in 3% nonfat milk in TBS) and the secondary antibody AP-conjugated goat anti-rabbit IgG (1:10000 in the blocking buffer).
Overexpression of CTSD and its mutants in HaEpi cells
The sequence encoding the predicted N-linked glycosylation sites of full-length CTSD at N121 and N233 were subjected to a single site or double site mutation by replacing asparagine with glutamine using primers and PCR. Proofreading DNA polymerase (Transgen Biotech, AP131-03) was used to amplify the DNA encoding full-length CTSD and its mutants via PCR with various primers (Table S1). All the fragments were inserted into plasmid pIEx-4-His plasmid (Novagen, 71235–3) and fused in-frame with a sequence encoding RFP at the C-terminus of the target proteins. The plasmid (5 μg/ml) was transfected into HaEpi cells using the Quick Shuttle-enhanced transfection reagent (Biodragon Immunotechnologies, KX0110042). After 48 h of transfection, total cellular proteins were extracted from cells for western blotting analysis or other experiments.
Enrichment of CTSD by anti-CTSD antibodies
The secreted pro-CTSD-RFP in Grace’s medium was enriched using the anti-CTSD antibodies from 1.5 ml Grace’s medium for each experiment. Grace’s medium (1.5 ml with the secreted pro-CTSD-RFP) was added 35 μl of protein A (Smart-Lifesciences, SA012005) and incubated at 4°C for 1 h to exclude the nonspecific binding of protein A with the proteins. After centrifugation, the supernatant was added 15 μl (2 μg/μl) of anti-CTSD antibodies that was purified with the overexpressed CTSD and incubated at 4°C for 4 h. Then, 35 μl new protein A was added and the sample incubated for 1 h at 4°C. After centrifugation, the precipitates were suspended in 50 μl PBS for western blotting analysis. A monoclonal antibody against RFP was diluted 1:5000 in 3% nonfat milk in TBS to detect overexpressed CTSD. The secondary antibody was AP-conjugated horse anti-mouse IgG (1:10000 in the blocking buffer).
20E induction of CTSD expression in the larval midgut and the pupal epidermis
The sixth instar 6 h larva was injected with 50, 100, 200, and 500 ng of 20E for 6 h, or injected with 500 ng for 1, 3, 6, 12, and 24 h. The pupa on day 2 was injected with 50, 100, 200, and 500 ng of 20E for 6 h, or injected with 500 ng for 1, 3, 6, 12, and 24 h. The same volume of DMSO was injected as a 20E solvent control. Proteins from various experiments were used for western blotting analysis with rabbit antiserum against H. armigera CTSD and AP-conjugated goat anti-rabbit IgG.
RNA interference (RNAi) of EcR and Usp1 in HaEpi cells
For RNAi of H. armigera EcR (Ecdysone receptor; Accession: ACD74807.1) and Usp1 (ultraspiracle isoform 1; Accession: ACD74808.1) in HaEpi cells, 2 μg of dsEcR or dsUsp1 was transfected into the cells using the QuickShuttle-enhanced transfection reagent in 1 ml Grace’s medium, according to the manufacturer’s instructions, while the control group received an equivalent amount of dsGFP. After 48 h of dsRNA treatment, 2 μM 20E or an equivalent amount of DMSO was added to the cell culture medium, followed by an additional 6 h of incubation. Total RNA was then extracted from the cells for QRT-PCR analysis.
Chromatin immunoprecipitation (ChIP) assay
The EcR-RFP-His plasmid was transfected into 70% density cells in six-well plates for 72 h. The cells were then treated with 5 μM 20E for 3 h. DMSO treatment was used as control. The ChIP Assay Kit (Beyotime Biotechnology, P2078) was used for the following assay. Then, 40.5 μl of formaldehyde (Sigma-Aldrich, 252549) was added to the cells in 1.5 ml Grace’s medium and gently mixed (final concentration as 1%) and incubated at 37°C for 10 min for the crossing-link of the proteins to DNA. Then, 165 μl of glycine solution (10 ×) (Beyotime Biotechnology, P2078-2) was added and mixed gently at room temperature for 5 min. The cells were washed twice with ice-cold PBS with 1 mM PMSF (Sangon Biotech, A100754) and harvested by centrifugation. The cells were resuspended in 400 μl of SDS lysis buffer (Beyotime Biotechnology, P2078-11) with 1 mM PMSF. Ultrasonication was performed to break up the genomic DNA into 200–1,000 bp fragments. After centrifugation, the supernatant was added with 400 μl of ChIP dilution buffer (Beyotime Biotechnology, P2078-3) containing 1 mM PMSF to dilute the sample to a final volume of 900 μl, with Protein A + G Agarose-salmon sperm DNA (Beyotime Biotechnology, P2078-1) at 4°C for 1 h. After centrifugation, 300 μl of the supernatant was used as an input sample for QRT-PCR, the remaining supernatant of the experimental group was incubated with the anti-RFP antibody. The Protein A + G Agarose-salmon sperm DNA was added to collect the protein and DNA complex at 4°C. The complex was washed as follows: once with low salt buffer (Beyotime Biotechnology, P2078-4); once with high salt wash buffer (Beyotime Biotechnology, P2078-5); once with LiCl wash buffer (Beyotime Biotechnology, P2078-6); and twice with TE buffer (Beyotime Biotechnology, P2078-7). The proteins were eluted with buffer (1% SDS, 100 mM NaHCO3). The DNA-protein cross-links were reversed at 65°C for 4 h and treated with RNase A (Beyotime Biotechnology, ST576) at 37°C for 1 h and proteinase K (Sangon Biotech, A510453) at 45°C for 2 h; the input sample was processed in the same way. DNA was purified and analyzed by QRT-PCR to detect the EcR-USP1-binding elements in the H. armigera Ctsd promoter region using the Ctsd PF/Ctsd PR primers shown in Table S1. IgG was used as a positive control.
RNAi of Atgs and Syx17 in larvae
The depletion of Atg (encoding autophagy-related cysteine proteases) genes and Syx17 (encoding syntaxin 17 for fusing autophagosome with lysosome) in the insects was performed through the injection of a > 500 bp long dsRNAs for Atg4 (XM_021327178.1), Atg5 (KT895433.1), Atg7 (XM_021331200.1), Atg1 (XM_021329719.1), Atg14 (XM_021335677.1), and Syx17 (XM_021344066.1) (dsAtg4, dsAtg5, dsAtg7, dsAtg1, dsAtg14, and dsSyx17). The long dsRNAs can be used in worms [84] and insects [74] and can be broken down into several smaller dsRNA in vivo [85]. Two micrograms of dsAtg4, dsAtg5, dsAtg7, dsAtg1, dsAtg14, and dsSyx17 (in 5 μl PBS) were first injected into the hemocoel of the sixth instar 6 h larva for 24 h, respectively, followed by a second injection of 2 μg dsAtg4, dsAtg5, dsAtg7, dsAtg1, dsAtg14, and dsSyx17 for 24 h. The control larvae received two injections of an equal amount of dsGFP. After the second injection of dsRNA for 24 h, 500 ng (in 5 μl PBS) 20E was injected into the larva for 6 h. Proteins from various experiments were used for western blotting analysis with rabbit antiserum against H. armigera CTSD and AP-conjugated goat anti-rabbit IgG.
Immunohistochemistry
Midguts were dissected from larvae. After washing with PBS, the midgut was fixed in 4% paraformaldehyde overnight at 4°C. The fixed tissues were submitted to a professional company (Servicebio, Wuhan, China) for processing into slides and for HE staining. The anti-CTSD antibodies (1:500) were used to indicate the distribution of CTSD in the midgut. Pre-immune rabbit serum was used to replace the anti-CTSD antibodies as negative controls. The secondary antibody was Cy3 conjugated goat anti-rabbit IgG (H + L) (1:200; Servicebio, GB21303). CASP3 was detected with the rabbit polyclonal antibodies against H. armigera CASP3 (anti-CASP3 antibodies) prepared in our laboratory (1:500). The secondary antibody was FITC-conjugated goat anti-rabbit IgG (H + L) (1:200; Servicebio, GB22303). The anti-phospho-histone H3 (Ser10; Cell Signaling Technology, 9701) antibodies (1:200) were used to indicate proliferative cells in the fat body. The secondary antibody was Cy3-conjugated goat anti-rabbit IgG (H + L) (1:200). Fluorescence of the section was detected using an Olympus BX51 fluorescence microscope (Olympus Optical Co, Tokyo, Japan).
RNAi of CTSD in larvae
DsRNA was synthesized using Ctsd cDNA as the template (433 bp) with the MEGAscript™ RNAi kit (Thermo Fisher Scientific, AM1626) and the primers shown in Table S1. The depletion of Ctsd and other genes in the insects were performed through the injection of a long dsRNA of Ctsd (dsCtsd). 2 μg of dsCtsd was injected into the hemocoel of sixth instar 6 h larva for 24 h, and 2 μg of dsCtsd was injected a second time to observe pupation. 20E (500 ng) was injected into larva after the second injection of dsCtsd for 12 h. An equivalent amount of DMSO was used as a control. Ninety larvae were injected with the dsCtsd. The control larvae received the same number and amount of dsGFP injections.
Neutralization of G-pro-CTSD in pupae
To neutralize the G-pro-CTSD in hemolymph in pupae, the rabbit polyclonal antibodies against H. armigera CTSD were purified by protein A. Every 4 μg anti-CTSD antibodies were injected into the hemolymph of pupa on day 2 and day 4 for twice. Equal amount of rabbit IgG was injected as a negative control. Fat body was dissected from the third section of the back at day 2 pupa to adult into PBS to observe the fat body form. Midgut was dissected and stained with HE staining. Ninety pupae were examined in each experimental group for statistical analysis of emergence.
CASP3 activity assay in HaEpi
RFP, full-length CTSD-RFP, and m-CTSD-RFP were overexpressed using the pIEx-4-RFP-His plasmid in HaEpi cells for 48 h, respectively. The activity of CASP3 was detected using a NucView 488 CASP3 assay kit via immunocytochemistry, according to the manufacturer’s instructions (Biotium, 30029). The NucView 488 CASP3 Substrate (5 μM) was added to the cell culture media, followed by 0.5 h incubation at room temperature. Finally, the nuclei were stained with 10 μg/ml DAPI (KeyGEN Biotechnology, KGA215) for 10 min, and the resulting signals were observed using a Zeiss LSM 700 laser Confocal microscope (Zeiss) or Olympus BX51 fluorescence microscope (Shinjuku-ku, Tokyo, Japan).
5-Ethynyl-2´-deoxyuridine (EdU) detection
RFP, full-length CTSD-RFP, and m-CTSD-RFP were overexpressed using the pIEx-4-RFP-His plasmid in HaEpi cells for 48 h, respectively. An EdU Kit (Ribobio, C10310-3) was used to detect cell proliferation levels according to the manufacturer’s protocol. The cells were incubated with 100 μl of EdU substrate (20 μM, Grace’s: buffer A = 2500: 1) for 6 h. The fat body was dissected and cultured in Grace’s medium with 20 μM EdU substrate for 24 h under 27°C. After being washed with Dulbecco’s phosphate-buffered saline (DPBS; 137 mM NaCl, 2.7 mM KCl, 1.5 mM KH2PO4, 8 mM Na2HPO4, pH 7.5) for 5 min, the cells were fixed in the dark using 100 μl 4% paraformaldehyde for 30 min at room temperature. The cells were then incubated with 100 μl of 2 mg/ml glycine (Solarbio Life Sciences, G8200) for 5 min with shaking, and washed with DPBS for 5 min twice. The cells were incubated with 1 × Apollo staining reaction liquid for 30 min in a shaking device in the dark, and washed by DPBS for 10 min twice. Cells were incubated in the dark with 1 × Hoechst 33342 (Ribobio, C00033) staining reaction (deionized water: Hoechst 33342 = 100: 1) for 30 min with shaking, and then washed with DPBS for 5 min twice. The cells were observed using a Zeiss LSM 700 laser confocal microscope (Zeiss) or an Olympus BX51 fluorescence microscope (Shinjuku-ku, Tokyo, Japan).
Phospho-Histone H3 (Ser10) detection
RFP, full-length CTSD-RFP, and m-CTSD-RFP were overexpressed in HaEpi cells at a density of 2 × 10⁵ with 500 μl Grace’s medium supplemented with 10% fetal bovine serum for 48 h. Then, the cells were fixed in 4% paraformaldehyde for 10 min and washed with PBS three times. The cells were blocked with 5% BSA in PBS for 1 h. The phospho-histone H3 (Ser10) Antibody (rabbit polyclonal antibodies; Cell Signaling Technology, 9701) was diluted (1:800) in 500 μl 5% BSA (Solarbio Life Sciences, A8020) and was added to cells overnight at 4°C. The cells were washed three times for 5 min each with PBS and incubated with goat anti-rabbit IgG Alexa Fluor 488 (Thermo Fisher Scientific, R37116) diluted with 1:1000 for 1 h at 37°C after being washed three times for 5 min each. The nuclei were stained with DAPI for 10 min at room temperature and washed three times for 5 min each with PBS.
Purification of G-pro-CTSD
The CNBr-activated Sepharose 4B was conjugated with anti-CTSD antibodies. The blood plasma collected from three pupae on day 2 was added to an equal volume of anticoagulant (same as that in western blot) and incubated with CNBr-activated Sepharose 4B-anti-CTSD antibodies overnight at 4°C. The CNBr beads were washed with washing buffer (0.1 M Tris-HCl, 0.1 M NaCl, pH 8.0) for twice, and G-pro-CTSD protein was eluted by buffer (0.1 M glycine, pH 2.5) and was neutralized with 1 M Tris-HCl, pH 8.0 for experiments.
Detection of the 20E titer
100 μl hemolymph was quickly collected from more than three larvae or pupae at different developmental stages. The hemocytes were removed by centrifugation at 1000 × g for 2 min at room temperature immediately. The supernatant was frozen in liquid nitrogen and freeze-dried using a freeze-dry system (LABCONCO, 77530–01, American) for 6 h. The sample was directly dissolved with 500 μl EIA buffer (Bertin Pharma, A05120) without 80% methyl alcohol extraction and centrifuged at 10,000 × g for 10 min at 4°C. The supernatant was diluted 1000 times by EIA buffer for further assay. 100 mg of epidermis, midgut, fat body, wing disks and hemolymph with hemocytes (100 μl) were dissected from more than three larvae at 6th instar 96 h and were put into liquid nitrogen immediately to prevent melanization. In CTSD neutralization experiment, 100 mg of epidermis, midgut, fat body and hemolymph (100 μl) were dissected from more than pupae on pupa 4 d and pupa 6 d about IgG injection and put into liquid nitrogen immediately to prevent melanization, and the tissues of anti-CTSD from equal developmental stages according to eye pigmentation. The tissues were freeze-dried overnight. The powders were dissolved in 500 μl 80% methyl alcohol and ground in an ice-cold mortar. After centrifugation at 10000 × g for 10 min, the supernatant was air-dried at room temperature. The precipitates were completely dissolved with 100 μl of EIA buffer. Each sample was diluted 1000 times with EIA buffer before the detection of the 20E concentration. A 50 µl sample was used to detect 20E using a 20E Enzyme Immunoassay kit (Bertin Pharma, A05120). The 20E molar concentration was calculated by the formula c = ρ/M (c, the molar concentration of 20E; ρ, the mass of 20E in 100 μl hemolymph; M, molar mass of 20E, 480.63 g/mol).
Statistical analysis
Data were analyzed using Student’s t-test for paired comparisons or analysis of variance (ANOVA) for multiple comparisons. The error bars in the figures represent the mean ± standard deviation (SD) of three independent experiments. Significance was determined using a two-tailed paired test for statistical analysis. In the figures, an asterisk indicates statistical significance (*p < 0.05, **p < 0.01, and ***p < 0.001). The figures were produced using GraphPad 7.0 data view software. The different lowercase letters indicate significant differences (p < 0.05) in the ANOVA analysis. Western blotting bands were analyzed according to three independent replicates using ImageJ software (National Institutes of Health, http//imagej.nih.gov/ij/download.html).
Supplementary Material
Acknowledgments
We thank Rui Wang, Caiyun Sun from State Key Laboratory of Microbial Technology, Shandong University, for the assistance of using a freeze-dry system.
Funding Statement
This study was supported by the National Natural Science Foundation of China (Grant Nos. 31730083, 31572328).
Disclosure statement
We declare that there is no any competing interest in relation to the work described.
Supplementary material
Supplemental data for this article can be accessed here.
References
- [1].Faust PL, Kornfeld S, Chirgwin JM.. Cloning and sequence analysis of cDNA for human cathepsin D. Proc Natl Acad Sci USA. 1985;82(15):4910–4914. [DOI] [PMC free article] [PubMed] [Google Scholar]
- [2].Khalkhali-Ellis Z, Hendrix MJ. Two faces of cathepsin D: physiological guardian angel and pathological demon. Biol Med (Aligarh). 2014;6(2):1–5. [DOI] [PMC free article] [PubMed] [Google Scholar]
- [3].Dean RT. Direct evidence of importance of lysosomes in degradation of intracellular proteins. Nature. 1975;257(5525):414–416. [DOI] [PubMed] [Google Scholar]
- [4].Benes P, Vetvicka V, Fusek M. Cathepsin D–many functions of one aspartic protease. Crit Rev Oncol Hematol. 2008;68(1):12–28. [DOI] [PMC free article] [PubMed] [Google Scholar]
- [5].Stoka V, Turk V, Turk B. Lysosomal cysteine cathepsins: signaling pathways in apoptosis. Biol Chem. 2007;388(6):555–560. [DOI] [PubMed] [Google Scholar]
- [6].Aufschnaiter A, Kohler V, Buttner S. Taking out the garbage: cathepsin D and calcineurin in neurodegeneration. Neural Regen Res. 2017;12(11):1776–1779. [DOI] [PMC free article] [PubMed] [Google Scholar]
- [7].Broker LE, Kruyt FA, Giaccone G. Cell death independent of caspases: a review. Clin Cancer Res. 2005;11(9):3155–3162. [DOI] [PubMed] [Google Scholar]
- [8].Hu Y, Benedict MA, Ding L, et al. Role of cytochrome c and dATP/ATP hydrolysis in Apaf-1-mediated caspase-9 activation and apoptosis. Embo J. 1999;18(13):3586–3595. [DOI] [PMC free article] [PubMed] [Google Scholar]
- [9].Heinrich M, Neumeyer J, Jakob M, et al. Cathepsin D links TNF-induced acid sphingomyelinase to Bid-mediated caspase-9 and −3 activation. Cell Death Differ. 2004;11(5):550–563. [DOI] [PubMed] [Google Scholar]
- [10].Minarowska A, Minarowski L, Karwowska A, et al. Regulatory role of cathepsin D in apoptosis. Folia Histochem Cytobiol. 2007;45(3):159–163. [PubMed] [Google Scholar]
- [11].Conus S, Pop C, Snipas SJ, et al. Cathepsin D primes caspase-8 activation by multiple intra-chain proteolysis. J Biol Chem. 2012;287(25):21142–21151. [DOI] [PMC free article] [PubMed] [Google Scholar]
- [12].Ohri SS, Vashishta A, Proctor M, et al. The propeptide of cathepsin D increases proliferation, invasion and metastasis of breast cancer cells. Int J Oncol. 2008;32(2):491–498. [PubMed] [Google Scholar]
- [13].Nicotra G, Castino R, Follo C, et al. The dilemma: does tissue expression of cathepsin D reflect tumor malignancy? The question: does the assay truly mirror cathepsin D mis-function in the tumor? Cancer Biomark. 2010;7(1):47–64. [DOI] [PMC free article] [PubMed] [Google Scholar]
- [14].Pranjol MZI, Gutowski NJ, Hannemann M, et al. Cathepsin D non-proteolytically induces proliferation and migration in human omental microvascular endothelial cells via activation of the ERK1/2 and PI3K/AKT pathways. Biochim Biophys Acta Mol Cell Res. 2018;1865(1):25–33. [DOI] [PubMed] [Google Scholar]
- [15].Riddiford LM. Hormone receptors and the regulation of insect metamorphosis. Receptor. 1993;3(3):203–209. [PubMed] [Google Scholar]
- [16].Shiba H, Uchida D, Kobayashi H, et al. Involvement of cathepsin B- and L-like proteinases in silk gland histolysis during metamorphosis of Bombyx mori. Arch Biochem Biophys. 2001;390(1):28–34. [DOI] [PubMed] [Google Scholar]
- [17].Lee CY, Cooksey BA, Baehrecke EH. Steroid regulation of midgut cell death during Drosophila development. Dev Biol. 2002;250(1):101–111. [DOI] [PubMed] [Google Scholar]
- [18].Liu CY, Liu W, Zhao WL, et al. Upregulation of the expression of prodeath serine/threonine protein kinase for programmed cell death by steroid hormone 20-hydroxyecdysone. Apoptosis. 2013;18(2):171–187. [DOI] [PubMed] [Google Scholar]
- [19].Li YB, Li XR, Yang T, et al. The steroid hormone 20-hydroxyecdysone promotes switching from autophagy to apoptosis by increasing intracellular calcium levels. Insect Biochem Mol Biol. 2016;79:73–86. [DOI] [PubMed] [Google Scholar]
- [20].Zhou XF, Riddiford LM. Broad specifies pupal development and mediates the ‘status quo’ action of juvenile hormone on the pupal-adult transformation in Drosophila and Manduca. Development. 2002;129(9):2259–2269. [DOI] [PubMed] [Google Scholar]
- [21].Aguila JR, Suszko J, Gibbs AG, et al. The role of larval fat cells in adult Drosophila melanogaster. J Exp Biol. 2007;210(Pt 6):956–963. [DOI] [PubMed] [Google Scholar]
- [22].Aguila JR, Hoshizaki DK, Gibbs AG. Contribution of larval nutrition to adult reproduction in Drosophila melanogaster. J Exp Biol. 2013;216(Pt 3):399–406. [DOI] [PubMed] [Google Scholar]
- [23].Parzych KR, Klionsky DJ. Vacuolar hydrolysis and efflux: current knowledge and unanswered questions. Autophagy. 2019;15(2):212–227. [DOI] [PMC free article] [PubMed] [Google Scholar]
- [24].Gui ZZ, Lee KS, Kim BY, et al. Functional role of aspartic proteinase cathepsin D in insect metamorphosis. BMC Dev Biol. 2006;6:49. [DOI] [PMC free article] [PubMed] [Google Scholar]
- [25].Yu J, Wu FY, Zou FM, et al. Identification of ecdysone response elements (EcREs) in the Bombyx mori cathepsin D promoter. Biochem Biophys Res Commun. 2012;425(1):113–118. [DOI] [PubMed] [Google Scholar]
- [26].Riddiford LM, Hiruma K, Zhou XF, et al. Insights into the molecular basis of the hormonal control of molting and metamorphosis from Manduca sexta and Drosophila melanogaster. Insect Biochem Mol Biol. 2003;33(12):1327–1338. [DOI] [PubMed] [Google Scholar]
- [27].Liu W, Cai MJ, Zheng CC, et al. Phospholipase Cgamma1 connects the cell membrane pathway to the nuclear receptor pathway in insect steroid hormone signaling. J Biol Chem. 2014;289(19):13026–13041. [DOI] [PMC free article] [PubMed] [Google Scholar]
- [28].Kasprzak A, Kwasniewski W, Adamek A, et al. Insulin-like growth factor (IGF) axis in cancerogenesis. Mutat Res Rev Mutat Res. 2017;772:78–104. [DOI] [PubMed] [Google Scholar]
- [29].Pan J, Di YQ, Li YB, et al. Insulin and 20-hydroxyecdysone oppose each other in the regulation of phosphoinositide-dependent kinase-1 expression during insect pupation. J Biol Chem. 2018;293(48):18613–18623. [DOI] [PMC free article] [PubMed] [Google Scholar]
- [30].Eijkelenboom A, Burgering BM. FOXOs: signalling integrators for homeostasis maintenance. Nat Rev Mol Cell Biol. 2013;14(2):83–97. [DOI] [PubMed] [Google Scholar]
- [31].Mehanna S, Suzuki C, Shibata M, et al. Cathepsin D in pancreatic acinar cells is implicated in cathepsin B and L degradation, but not in autophagic activity. Biochem Biophys Res Commun. 2016;469(3):405–411. [DOI] [PubMed] [Google Scholar]
- [32].Buluwela L, Pike J, Mazhar D, et al. Inhibiting estrogen responses in breast cancer cells using a fusion protein encoding estrogen receptor-alpha and the transcriptional repressor PLZF. Gene Ther. 2005;12(5):452–460. [DOI] [PubMed] [Google Scholar]
- [33].Seth P, Krop I, Porter D, et al. Novel estrogen and tamoxifen induced genes identified by SAGE (Serial Analysis of Gene Expression). Oncogene. 2002;21(5):836–843. [DOI] [PubMed] [Google Scholar]
- [34].Zhang T, Song W, Li Z, et al. Kruppel homolog 1 represses insect ecdysone biosynthesis by directly inhibiting the transcription of steroidogenic enzymes. Proc Natl Acad Sci USA. 2018;115(15):3960–3965. [DOI] [PMC free article] [PubMed] [Google Scholar]
- [35].Liu S, Li K, Gao Y, et al. Antagonistic actions of juvenile hormone and 20-hydroxyecdysone within the ring gland determine developmental transitions in Drosophila. Proc Natl Acad Sci USA. 2018;115(1):139–144. [DOI] [PMC free article] [PubMed] [Google Scholar]
- [36].Smith SL, Bollenbacher WE, Cooper DY, et al. Ecdysone 20-monooxygenase: characterization of an insect cytochrome p-450 dependent steroid hydroxylase. Mol Cell Endocrinol. 1979;15(3):111–133. [DOI] [PubMed] [Google Scholar]
- [37].Jindra M, Palli SR, Riddiford LM. The juvenile hormone signaling pathway in insect development. Annu Rev Entomol. 2013;58:181–204. [DOI] [PubMed] [Google Scholar]
- [38].Zaidi N, Maurer A, Nieke S, et al. Cathepsin D: a cellular roadmap. Biochem Biophys Res Commun. 2008;376(1):5–9. [DOI] [PubMed] [Google Scholar]
- [39].Laurent-Matha V, Derocq D, Prebois C, et al. Processing of human cathepsin D is independent of its catalytic function and auto-activation: involvement of cathepsins L and B. J Biochem. 2006;139(3):363–371. [DOI] [PMC free article] [PubMed] [Google Scholar]
- [40].Lin FH, Zhang WL, Li H, et al. Role of autophagy in modulating post-maturation aging of mouse oocytes. Cell Death Dis. 2018;9(3):308. [DOI] [PMC free article] [PubMed] [Google Scholar]
- [41].Tooze SA. Current views on the source of the autophagosome membrane. Essays Biochem. 2013;55:29–38. [DOI] [PubMed] [Google Scholar]
- [42].Zachari M, Ganley IG. The mammalian ULK1 complex and autophagy initiation. Essays Biochem. 2017;61(6):585–596. [DOI] [PMC free article] [PubMed] [Google Scholar]
- [43].Mathai BJ, Meijer AH, Simonsen A. Studying autophagy in zebrafish. Cells. 2017;6(3):21–26. [DOI] [PMC free article] [PubMed] [Google Scholar]
- [44].Rabinowitz JD, White E. Autophagy and metabolism. Science. 2010;330(6009):1344–1348. [DOI] [PMC free article] [PubMed] [Google Scholar]
- [45].Viret C, Faure M. Regulation of syntaxin 17 during autophagosome maturation. Trends Cell Biol. 2019;29(1):1–3. [DOI] [PubMed] [Google Scholar]
- [46].Furuno K, Ishikawa T, Kato K. Isolation and characterization of autolysosomes which appeared in rat liver after leupeptin treatment. J Biochem. 1982;91(6):1943–1950. [DOI] [PubMed] [Google Scholar]
- [47].Marques ARA, Di Spiezio A, Thiessen N, et al. Enzyme replacement therapy with recombinant pro-CTSD (cathepsin D) corrects defective proteolysis and autophagy in neuronal ceroid lipofuscinosis. Autophagy. 2020;16(5):811–825. [DOI] [PMC free article] [PubMed] [Google Scholar]
- [48].Zhang Z, Liu Z, Chen J, et al. Resveratrol induces autophagic apoptosis via the lysosomal cathepsin D pathway in human drug-resistant K562/ADM leukemia cells. Exp Ther Med. 2018;15(3):3012–3019. [DOI] [PMC free article] [PubMed] [Google Scholar]
- [49].Karch J, Schips TG, Maliken BD, et al. Autophagic cell death is dependent on lysosomal membrane permeability through Bax and Bak. Elife. 2017;6:pii: e30543. [DOI] [PMC free article] [PubMed] [Google Scholar]
- [50].Dermaut B, Norga KK, Kania A, et al. Aberrant lysosomal carbohydrate storage accompanies endocytic defects and neurodegeneration in Drosophila benchwarmer. J Cell Biol. 2005;170(1):127–139. [DOI] [PMC free article] [PubMed] [Google Scholar]
- [51].Rong Y, McPhee CK, Deng S, et al. Spinster is required for autophagic lysosome reformation and mTOR reactivation following starvation. Proc Natl Acad Sci USA. 2011;108(19):7826–7831. [DOI] [PMC free article] [PubMed] [Google Scholar]
- [52].Levine B, Kroemer G. Biological functions of autophagy genes: a disease perspective. Cell. 2019;176(1–2):11–42. [DOI] [PMC free article] [PubMed] [Google Scholar]
- [53].New J, Thomas SM. Autophagy-dependent secretion: mechanism, factors secreted, and disease implications. Autophagy. 2019;15(10):1682–1693. [DOI] [PMC free article] [PubMed] [Google Scholar]
- [54].Hernandez-Tiedra S, Fabrias G, Davila D, et al. Dihydroceramide accumulation mediates cytotoxic autophagy of cancer cells via autolysosome destabilization. Autophagy. 2016;12(11):2213–2229. [DOI] [PMC free article] [PubMed] [Google Scholar]
- [55].Romanelli D, Casati B, Franzetti E, et al. A molecular view of autophagy in Lepidoptera. Biomed Res Int. 2014;2014:902315. [DOI] [PMC free article] [PubMed] [Google Scholar]
- [56].Xie K, Tian L, Guo X, et al. BmATG5 and BmATG6 mediate apoptosis following autophagy induced by 20-hydroxyecdysone or starvation. Autophagy. 2016;12(2):381–396. [DOI] [PMC free article] [PubMed] [Google Scholar]
- [57].Franzetti E, Huang ZJ, Shi YX, et al. Autophagy precedes apoptosis during the remodeling of silkworm larval midgut. Apoptosis. 2012;17(3):305–324. [DOI] [PubMed] [Google Scholar]
- [58].Fortenberry SC, Schorey JS, Chirgwin JM. Role of glycosylation in the expression of human procathepsin D. J Cell Sci. 1995;108(Pt 5):2001–2006. [DOI] [PubMed] [Google Scholar]
- [59].Samarel AM, Ferguson AG, Decker RS, et al. Effects of cysteine protease inhibitors on rabbit cathepsin D maturation. Am J Physiol. 1989;257(6 Pt 1):C1069–1079. [DOI] [PubMed] [Google Scholar]
- [60].Saftig P, Hetman M, Schmahl W, et al. Mice deficient for the lysosomal proteinase cathepsin D exhibit progressive atrophy of the intestinal mucosa and profound destruction of lymphoid cells. Embo J. 1995;14(15):3599–3608. [DOI] [PMC free article] [PubMed] [Google Scholar]
- [61].Nelliot A, Bond N, Hoshizaki DK. Fat-body remodeling in Drosophila melanogaster. Genesis. 2006;44(8):396–400. [DOI] [PubMed] [Google Scholar]
- [62].Hoshizaki DK, Lunz R, Ghosh M, et al. Identification of fat-cell enhancer activity in Drosophila melanogaster using P-element enhancer traps. Genome. 1995;38(3):497–506. [DOI] [PubMed] [Google Scholar]
- [63].Zhai X, Zhao XF. Participation of haemocytes in fat body degradation via cathepsin L expression. Insect Mol Biol. 2012;21(5):521–534. [DOI] [PubMed] [Google Scholar]
- [64].Jia Q, Chen X, Wu L, et al. Matrix metalloproteinases promote fat body cell dissociation and ovary development in Bombyx mori. J Insect Physiol. 2018;111:8–15. [DOI] [PubMed] [Google Scholar]
- [65].Zhang Y, Lu YX, Liu J, et al. A regulatory pathway, ecdysone-transcription factor relish-cathepsin L, is involved in insect fat body dissociation. Plos Genet. 2013;9(2):e1003273. [DOI] [PMC free article] [PubMed] [Google Scholar]
- [66].Tian L, Ma L, Guo EE, et al. 20-hydroxyecdysone upregulates Atg genes to induce autophagy in the Bombyx fat body. Autophagy. 2013;9(8):1172–1187.23674061 [Google Scholar]
- [67].Haunerland NH, Shirk PD. Regional and functional-differentiation in the insect fat-body. Annu Rev Entomol. 1995;40:121–145. [Google Scholar]
- [68].Larsen WJ. Cell remodeling in the fat body of an insect. Tissue Cell. 1976;8(1):73–92. [DOI] [PubMed] [Google Scholar]
- [69].Chehrehasa F, Meedeniya AC, Dwyer P, et al. EdU, a new thymidine analogue for labelling proliferating cells in the nervous system. J Neurosci Methods. 2009;177(1):122–130. [DOI] [PubMed] [Google Scholar]
- [70].Hendzel MJ, Wei Y, Mancini MA, et al. Mitosis-specific phosphorylation of histone H3 initiates primarily within pericentromeric heterochromatin during G2 and spreads in an ordered fashion coincident with mitotic chromosome condensation. Chromosoma. 1997;106(6):348–360. [DOI] [PubMed] [Google Scholar]
- [71].Edgar BA, Orr-Weaver TL. Endoreplication cell cycles: more for less. Cell. 2001;105(3):297–306. [DOI] [PubMed] [Google Scholar]
- [72].Shu Z, Row S, Deng WM. Endoreplication: the good, the bad, and the ugly. Trends Cell Biol. 2018;28(6):465–474. [DOI] [PMC free article] [PubMed] [Google Scholar]
- [73].Liu CY, Zhao WL, Wang JX, et al. Cyclin-dependent kinase regulatory subunit 1 promotes cell proliferation by insulin regulation. Cell Cycle. 2015;14(19):3045–3057. [DOI] [PMC free article] [PubMed] [Google Scholar]
- [74].Chen CH, Pan J, Di YQ, et al. Protein kinase C delta phosphorylates ecdysone receptor B1 to promote gene expression and apoptosis under 20-hydroxyecdysone regulation. Proc Natl Acad Sci USA. 2017;114(34):E7121–E7130. [DOI] [PMC free article] [PubMed] [Google Scholar]
- [75].Cho EH, Nijhout HF. Development of polyploidy of scale-building cells in the wings of Manduca sexta. Arthropod Struct Dev. 2013;42(1):37–46. [DOI] [PubMed] [Google Scholar]
- [76].Zhao XF, Wang JX, Wang YC. Purification and characterization of a cysteine proteinase from eggs of cotton boll worm, Helicoverpa armigera. Insect Biochem Mol Biol. 1998;28:259–264. [Google Scholar]
- [77].Shao HL, Zheng WW, Liu PC, et al. Establishment of a new cell line from lepidopteran epidermis and hormonal regulation on the genes. PloS One. 2008;3(9):e3127. [DOI] [PMC free article] [PubMed] [Google Scholar]
- [78].Liu W, Cai MJ, Wang JX, et al. In a nongenomic action, steroid hormone 20-hydroxyecdysone induces phosphorylation of cyclin-dependent kinase 10 to promote gene transcription. Endocrinology. 2014;155(5):1738–1750. [DOI] [PubMed] [Google Scholar]
- [79].Zhao XF, An XM, Wang JX, et al. Expression of the Helicoverpa cathepsin B-like proteinase during embryonic development. Arch Insect Biochem Physiol. 2005;58(1):39–46. [DOI] [PubMed] [Google Scholar]
- [80].Caron AZ, Haroun S, Leblanc E, et al. The proteasome inhibitor MG132 reduces immobilization-induced skeletal muscle atrophy in mice. Bmc Musculoskel Dis. 2011;12:185. [DOI] [PMC free article] [PubMed] [Google Scholar]
- [81].Cheng J, Chen J, Xie B, et al. Acquired multidrug resistance in human K562/ADM cells is associated with enhanced autophagy. Toxicol Mech Methods. 2013;23(9):678–683. [DOI] [PubMed] [Google Scholar]
- [82].Xue Y, Du M, Sheng H, et al. Escherichia coli O157: h7suppresses host autophagy and promotes epithelial adhesion via Tir-mediated and cAMP-independent activation of protein kinase A. Cell Death Discov. 2017;3:17055. [DOI] [PMC free article] [PubMed] [Google Scholar]
- [83].Liu M, Udhe-Stone C, Goudar CT. Progress curve analysis of qRT-PCR reactions using the logistic growth equation. Biotechnol Prog. 2011;27(5):1407–1414. [DOI] [PubMed] [Google Scholar]
- [84].Fire A, Xu S, Montgomery MK, et al. Potent and specific genetic interference by double-stranded RNA in Caenorhabditis elegans. Nature. 1998;391(6669):806–811. [DOI] [PubMed] [Google Scholar]
- [85].Zamore PD, Tuschl T, Sharp PA, et al. RNAi: double-stranded RNA directs the ATP-dependent cleavage of mRNA at 21 to 23 nucleotide intervals. Cell. 2000;101(1):25–33. [DOI] [PubMed] [Google Scholar]
Associated Data
This section collects any data citations, data availability statements, or supplementary materials included in this article.