

ABSTRACT
The gut microbiota in the hepatitis B virus related acute-on-chronic liver failure (HBV-ACLF) is poorly defined. We aim to uncover the characteristics of the gut microbiota in HBV-ACLF and in other HBV associated pathologies. We analyzed the gut microbiome in patients with HBV-ACLF or other HBV associated pathologies and healthy individuals by 16S rRNA sequencing and metagenomic sequencing of fecal samples. 212 patients with HBV-ACLF, 252 with chronic hepatitis B (CHB), 162 with HBV-associated cirrhosis (HBV-LC) and 877 healthy individuals were recruited for the study. CHB and HBV-LC patients are grouped as HBV-Other. We discovered striking differences in the microbiome diversity between the HBV-ACLF, HBV-Other and healthy groups using 16S rRNA sequencing. The ratio of cocci to bacilli was significantly elevated in the HBV-ACLF group compared with healthy group. Further analysis within the HBV-ACLF group identified 52 genera showing distinct richness within the group where Enterococcus was enriched in the progression group whilst Faecalibacterium was enriched in the regression group. Metagenomic sequencing validated these findings and further uncovered an enrichment of Lactobacillus casei paracasei in progression group, while Alistipes senegalensis, Faecalibacterium prausnitzii and Parabacteroides merdae dominated the regression group. Importantly, our analysis revealed that there was a rapid increase of Enterococcus faecium during the progression of HBV-ACLF. The gut microbiota displayed distinct composition at different phases of HBV-ACLF. High abundance of Enterococcus is associated with progression while that of Faecalibacterium is associated with regression of HBV-ACLF. Therefore, the microbiota features hold promising potential as prognostic markers for HBV-ACLF.
KEYWORDS: Hepatitis B, acute-on-chronic liver failure, gut microbiota, 16S rRNA sequencing, metagenomic sequencing
Background
Acute-on-chronic liver failure (ACLF) is a common type of end-stage liver disease characterized by rapid deterioration of underlying chronic liver disease with organ failures and high mortality.1 Hepatitis B Virus (HBV) is a human hepadnavirus that causes acute and chronic hepatitis and hepatocellular carcinoma. ACLF occurs in about 30% of HBV-related cirrhosis patients with acute decompensation.2,3 The short-term prognosis of HBV-associated ACLF (HBV-ACLF) is poor, with 28-day mortality ranging from 40% to 50%.2–4
Gut microbiota is the collection of microorganisms that inhabit in the gastrointestinal tract,5 with an estimated number of gut microorganisms of over 1014.6 Gut microbiota has a complicated and mutually beneficial relationship with the host,7 and plays an important role in the metabolism, nutrition, pathological processes and immune function of the host.8,9 Human gut microbiota composition is affected by multiple factors such as age, nutrition, ethnicity, disease, and medication intake.10–12 Intestinal microbes can produce short-chain fatty acids to improve the energy metabolism of the colon cells.13 Some short-chain fatty acids have anti-inflammatory effects.14 Changes in the composition of the gut microbiota have been linked to several clinical conditions, such as obesity, nonalcoholic fatty liver disease, allergic diseases, gastrointestinal diseases, autoimmune diseases and cancers.15,16
Growing evidences suggest that gut microbiota plays a crucial role in the induction and the progression of liver diseases.17,18 Bacteria and bacterial components from the gut microflora have been associated with systemic inflammation and severe liver diseases.19,20 Translocation of gut microbe or their microbial products can induce inflammation, liver cell apoptosis and progression of liver failure,18 chronic liver disease21 and intestinal dysfunction in liver cirrhosis.22,23 Chen et al shown that changes in the microbiota composition are correlated with liver disease severity in non-viral ACLF patients.17
In clinical practice, intestinal microecological modulators are commonly used for the treatment of HBV-ACLF, especially for those with abdominal pain, diarrhea, hepatic encephalopathy and suspicious abdominal infection.24–26 However, the therapeutic efficacy varies considerably likely due to the differences in gut microbiota composition. This study aims to define the composition of the gut microbiota in HBV-ACLF patients and other HBV-associated pathologies including chronic hepatitis B (CHB) and HBV-associated cirrhosis (HBV-LC) and healthy individuals to uncover their relationships to disease progression and potential as prognosis markers.
Results
Distinct gut microbiota distribution and genera in HBV-ACLF
To uncover the microbiota distribution and genera in HBV-ACLF, HBV-Other and healthy groups, fecal samples were performed 16S rRNA sequencing and Shannon indexes calculated. The diversities of microbiome were significantly different between HBV-Other, HBV-ACLF and healthy group (Figure 1(a)). The overall gut microbiota distribution in each group was visualized using a t-distributed stochastic neighbor embedding (t-SNE) visualization and further demonstrated distinct microbiota distribution between groups, especially between the healthy and liver disease groups (Figure 1(b)).
Figure 1.
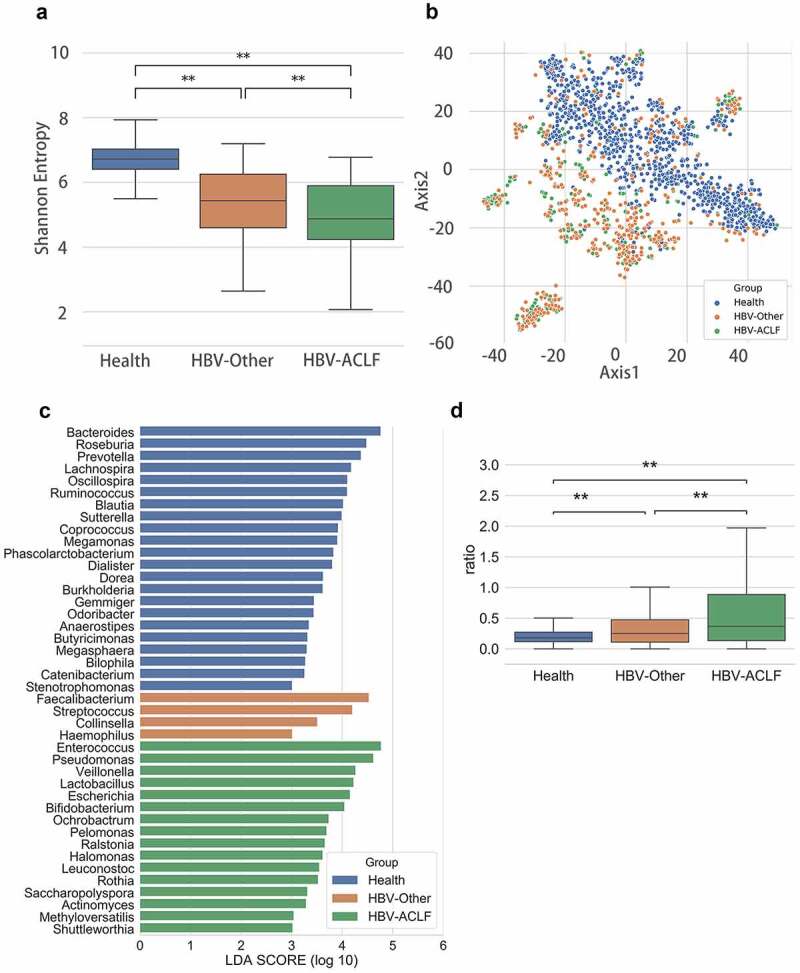
Gut microbiota distribution among groups. (a) Alpha diversity analysis (P = 3.57E-06). (b) A t-distributed stochastic neighbor embedding (t-SNE) visualization (P = .001). (c) Lef Se analysis showed predominant gut microbiota. (d) The ratio of cocci to bacilli was compared among the three groups. **P < .01
To identify the predominant gut microbiota in HBV-ACLF, LEfSe analysis was performed. The results showed that there were a number of different genera of gut microbiota between the healthy and the liver disease groups, and a trend could be observed that the HBV-ACLF had more Enterococcus relative richness than the healthy group (Figure 1(c)). Clinically, cocci to bacilli ratio is a common parameter used to inform the status of gut microbiota and the choice of antibiotics, therefore are often tested for patients with ACLF or abdominal and intestinal infections.27,28 We found that the ratio of cocci to bacilli richness was significantly different among the three groups where HBV-ACLF group exhibited the highest ratio (Figure 1(d)), suggesting that the balance of gut microbiota in these patients was severely disrupted.
Establishing a microbiota classification model for the healthy, HBV-other and the HBV-ACLF group
A classification model for the healthy, HBV-Other and the HBV-ACLF group was established by Random Forest classifier. The classification model included 18 most important taxa of the 3 groups (Figure 2(a)), with an area under curve (AUC) value of 0.89. In addition, the decomposition visualization (Figure 2(b)) demonstrated that the 18 selected taxa could be well distinguished among the 3 groups, suggesting the model was validly established.
Figure 2.
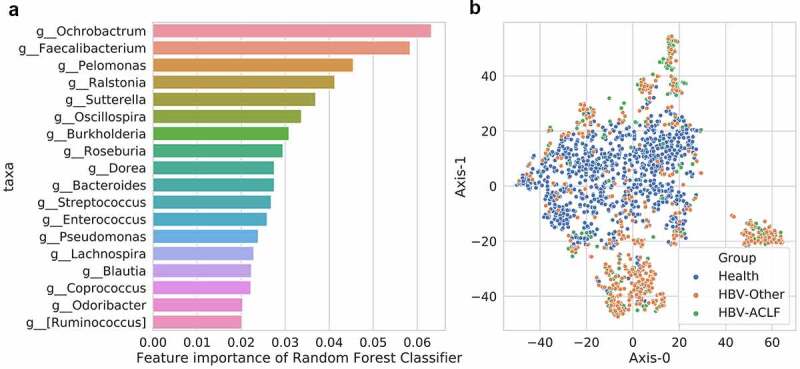
A classification model for the healthy, HBV-Other and the HBV-ACLF group. (a) 18 most important taxa in the classification model among the 3 groups. (b) The decomposition visualization of the 18 most important taxa among the 3 groups
Correlation between clinical/demographic variable and gut microbiota
To investigate the correlation between each clinical/demographic variable and gut microbiota among the 3 groups, adonis analysis was performed. The analysis showed that with the exception of sex, AST, HBsAg and HBeAb, all the other clinical/demographic variables were significantly associated with gut microbiota differences among the 3 groups (P < .05, Table 1), which were consistent with previous reports.27–30
Table 1.
The correlation between clinical/demographic variables and gut microbiota differences among the three groups (CHB, HBV-LC and HBV-ACLF)
| Df | SumsOfSqs | MeanSqs | F.Model | R2 | Pr(>F) | |
|---|---|---|---|---|---|---|
| Age | 1 | 1.459766149 | 1.459766149 | 5.22140839 | 0.008298205 | 0.001 |
| TBA | 1 | 3.364170616 | 3.364170616 | 12.16604397 | 0.019124007 | 0.001 |
| PTA | 1 | 8.600805868 | 8.600805868 | 32.07708526 | 0.048892251 | 0.001 |
| PT | 1 | 7.167123276 | 7.167123276 | 26.50300163 | 0.04074232 | 0.001 |
| PLT | 1 | 3.344729762 | 3.344729762 | 12.09437623 | 0.019013493 | 0.001 |
| PCT | 1 | 1.543559188 | 1.543559188 | 5.523779204 | 0.008774536 | 0.001 |
| Outcome | 2 | 3.585930435 | 1.792965218 | 6.481942928 | 0.020384626 | 0.001 |
| NEUT% | 1 | 3.435707917 | 3.435707917 | 12.42990175 | 0.019530669 | 0.001 |
| MELD | 1 | 9.680716122 | 9.680716122 | 36.33920762 | 0.055031122 | 0.001 |
| INR | 1 | 5.167285927 | 5.167285927 | 18.88408972 | 0.029374019 | 0.001 |
| HBVDNA | 1 | 1.082469872 | 1.082469872 | 3.863509143 | 0.006153422 | 0.001 |
| TBIL | 1 | 7.74027109 | 7.74027109 | 28.71996817 | 0.044000444 | 0.001 |
| HBeAg | 1 | 1.456026354 | 1.456026354 | 5.207919951 | 0.008276946 | 0.001 |
| Group | 2 | 8.376822829 | 4.188411415 | 15.5749815 | 0.047618994 | 0.001 |
| DBIL | 1 | 7.163834858 | 7.163834858 | 26.4903253 | 0.040723627 | 0.001 |
| Complication | 1 | 3.570734363 | 3.570734363 | 12.92852946 | 0.020298242 | 0.001 |
| Antivirus | 1 | 1.096785675 | 1.096785675 | 3.914925116 | 0.006234802 | 0.001 |
| Antibiotic | 1 | 6.903971794 | 6.903971794 | 25.49015429 | 0.039246406 | 0.001 |
| ALP | 1 | 1.323366071 | 1.323366071 | 4.729823572 | 0.007522824 | 0.001 |
| ALB | 1 | 2.46569817 | 2.46569817 | 8.870656381 | 0.014016539 | 0.001 |
| WBC | 1 | 1.604221305 | 1.604221305 | 5.74286249 | 0.009119377 | 0.001 |
| ALT | 1 | 0.98850852 | 0.98850852 | 3.526250807 | 0.005619288 | 0.002 |
| GGT | 1 | 0.845819216 | 0.845819216 | 3.014784073 | 0.004808155 | 0.004 |
| HBcAb | 1 | 0.594534839 | 0.594534839 | 2.11608473 | 0.0033797 | 0.023 |
| AST | 1 | 0.408767313 | 0.408767313 | 1.453355878 | 0.002323684 | 0.124 |
| Sex | 1 | 0.362155181 | 0.362155181 | 1.287286413 | 0.002058712 | 0.247 |
| HBsAg | 1 | 0.302837012 | 0.302837012 | 1.076075424 | 0.001721511 | 0.338 |
| HBeAb | 1 | 0.202134312 | 0.202134312 | 0.71783533 | 0.001149055 | 0.669 |
TBA, total bile acid; PTA, prothrombin time activity percentage; PT, prothrombin time; PLT, platelet; PCT, procalcitonin; NEUT%, neutrophil percentage; MELD, the model for end-stage liver disease; INR, international normalized ratio; TBIL, total bilirubin; HBeAg, hepatitis B e antigen; DBIL, direct bilirubin; ALP, alkaline phosphatase; ALB, albumin; WBC, white blood cell count; ALT, alanine transaminase; GGT, γ-glutamyl transpeptadase; HBcAb, hepatitis B core antibody; AST, aspartate aminotransferase; HBsAg, Hepatitis B surface antigen; HBeAb, hepatitis B e antibody.
Gut microbiota taxa difference between the progression and regression groups
To investigated whether gut microbiota differs within the HBV-ACLF group, we sub-assigned the group into progression group (disease progression at discharge; n = 47) and regression group (improved outcomes at discharge; n = 165) according to the Model for End-Stage Liver Disease (MELD) score at discharge. Fifty-two genera with different community richness between the HBV-ACLF progression and regression groups were identified with the most abundant genera (p < .005) listed in Table 2 and Supplemental Table 1 (p < .05). Enterococcus and Faecalibacterium showed the highest richness within the 52 genera, highlighting the importance of these two genera in ALCF which may contribute to disease progression. The relative abundance of Enterococcus was significantly elevated in the progression group, and that of Faecalibacterium was significantly elevated in the regression group (Figure 3).
Table 2.
The nine genera with different community richness between the HBV-ACLF progression and regression subgroups
| Taxa | p-value | Mean_richness of Progression subgroup | Mean_richness of Regression subgroup |
|---|---|---|---|
| k__Bacteria;p__Firmicutes;c__Bacilli;o__Lactobacillales;f__Enterococcaceae;g__Enterococcus | 0.000257 | 0.166797 | 0.0907 |
| k__Bacteria;p__Firmicutes;c__Bacilli;o__Lactobacillales;f__Lactobacillaceae;g__Pediococcus | 0.000764 | 0.001148 | 0.000189 |
| k__Bacteria;p__Proteobacteria;c__Betaproteobacteria;o__Burkholderiales;f__Oxalobacteraceae;g__Janthinobacterium | 0.000882 | 0.00013 | 1.57E-05 |
| k__Bacteria;p__Firmicutes;c__Clostridia;o__Clostridiales;f__Ruminococcaceae;g__Faecalibacterium | 0.001366 | 0.058289 | 0.124294 |
| k__Bacteria;p__Proteobacteria;c__Epsilonproteobacteria;o__Campylobacterales;f__Campylobacteraceae;g__Campylobacter | 0.001544 | 0.000467 | 0.000213 |
| k__Bacteria;p__Firmicutes;c__Clostridia;o__Clostridiales;f__Lachnospiraceae;g__Clostridium | 0.001763 | 0.001666 | 0.010363 |
| k__Bacteria;p__Firmicutes;c__Clostridia;o__Clostridiales;f__Veillonellaceae;g__Phascolarctobacterium | 0.001803 | 0.005291 | 0.008266 |
| k__Bacteria;p__Proteobacteria;c__Alphaproteobacteria;o__Caulobacterales;f__Caulobacteraceae;g__Phenylobacterium | 0.004049 | 2.85E-05 | 0 |
| k__Bacteria;p__Proteobacteria;c__Betaproteobacteria;o__Neisseriales;f__Neisseriaceae;g__Eikenella | 0.004049 | 7.99E-05 | 0 |
Figure 3.
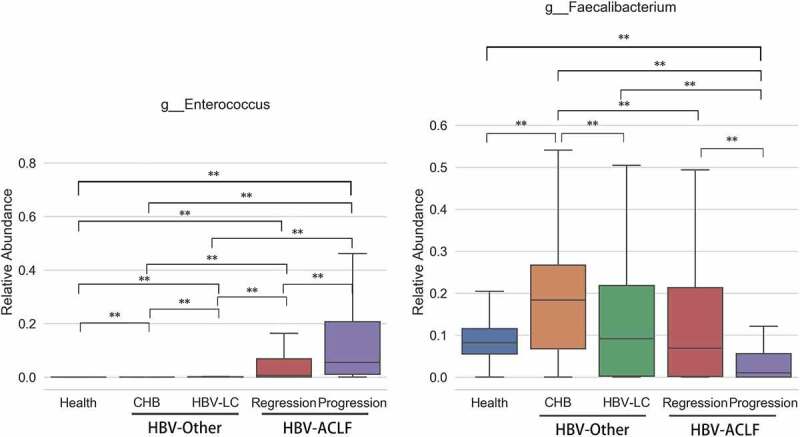
The abundance of the genera with the highest richness Enterococcus and Faecalibacterium. The relative abundance of Enterococcus was significantly elevated in the progression group, and that of Faecalibacterium was significantly elevated in the regression group
Gut microbiota genera associated with blood biochemical indicators
To investigate whether there is a link between the gut microbiota and clinical parameters, we evaluate the association between different genera and blood biochemical indicators in all groups. The blood biochemical indicators were divided into three categories according to their clinical relevance as follows: Liver inflammation – alanine aminotransferase (ALT) and aspartate aminotransferase (AST); Liver disease severity – total bilirubin (TBIL), international normalized ratio (coagulation function) (INR) and end-stage liver disease model (MELD); Degree of infection – white blood cell count (WBC), neutrophil percentage (NEUT%) and procalcitonin (PCT).
The gut microbiota genera associated with each blood biochemical indicator were identified using a Random Forest regressor via microbe’s Mean Decrease Gini. We trained several models using microbiota richness to predict their clinical relevance. By comparing the feature importance of the trained Regressor, we detected the common bacteria that Filifactor, Rikenellaceae, Clostridium, Bilophila and Comamonas were associated with ALT and AST (Figure 4(a)); Enterococcus, Enterococcaceae and Abiotrophin were associated with TBIL, INR and MELD (Figure 4(b)); and Enterococcus and Streptococcus were associated with WBC, NEUT% and PCT (Figure 4(c)).
Figure 4.
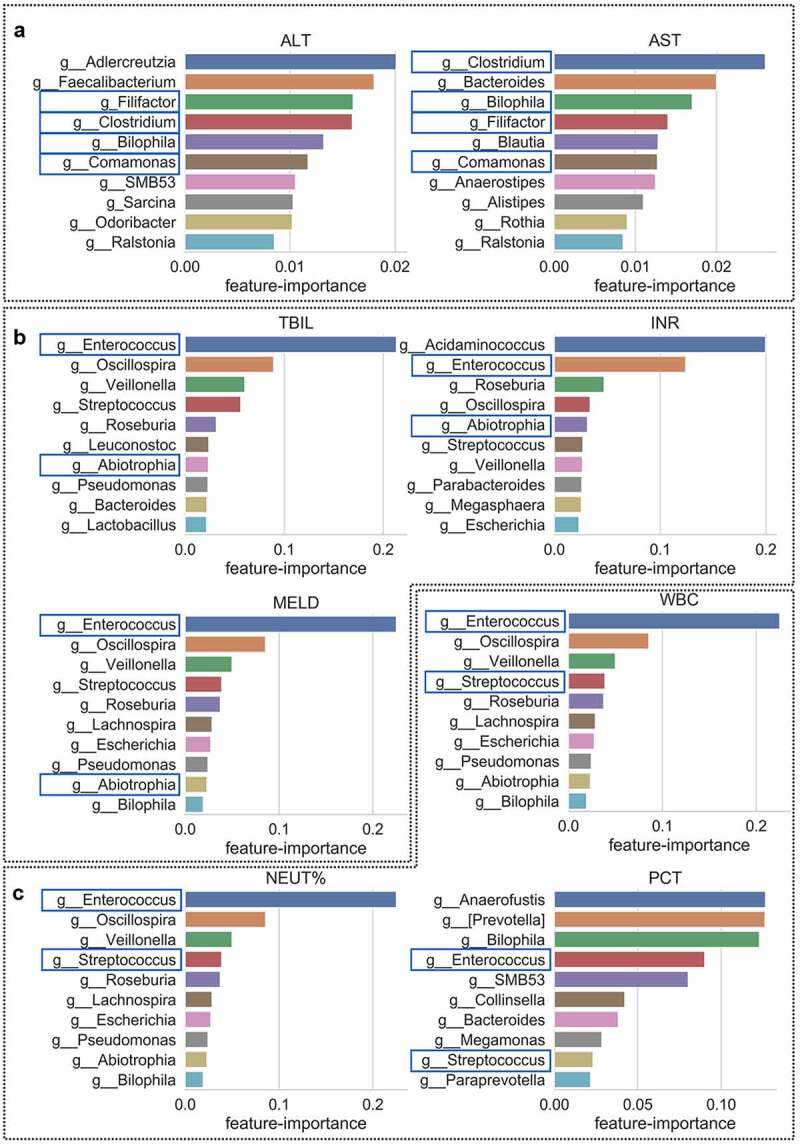
Correlation between the gut microbiota and clinical indicators. The common genera associated with ALT/AST (relevant to liver inflammation), TBIL/INR/MELD (relevant to liver disease severity) and WBC/NEUT%/PCT (relevant to the degree of infection), respectively. Blue square represents the common genera selected by the trained Regressor that with clinical relevant
Metagenomic sequencing between the progression and regression group in HBV-ACLF patients
The results of genus Enterococcus and Faecalibacterium by 16S rRNA sequencing were validated by the metagenomic sequencing (Figure 5(a)) where the richness of Enterococcus was higher in the progression group than in the regression group, and the richness of Faecalibacterium was higher in the regression group than in the progression group. The results of these two genus (Enterococcus and Faecalibacterium) were verified by cross validation and confirmed to be consistent in the discovery and the validation subsets: Enterococcus in the discovery subset (mean abundance = 0.074596 in regression group, mean abundance = 0.160055 in progression group, P = .013); in the validation subset (mean abundance = 0.100647 in regression group, mean abundance = 0.172242 in progression group, P = .002674). Faecalibacterium in the discovery subset (mean abundance = 0.147268 in regression group, mean abundance = 0.084926 in progression group, P = .026281); in the validation subset (mean abundance = 0.110104 in regression group, mean abundance = 0.036775 in progression group, P = .006326).
Figure 5.
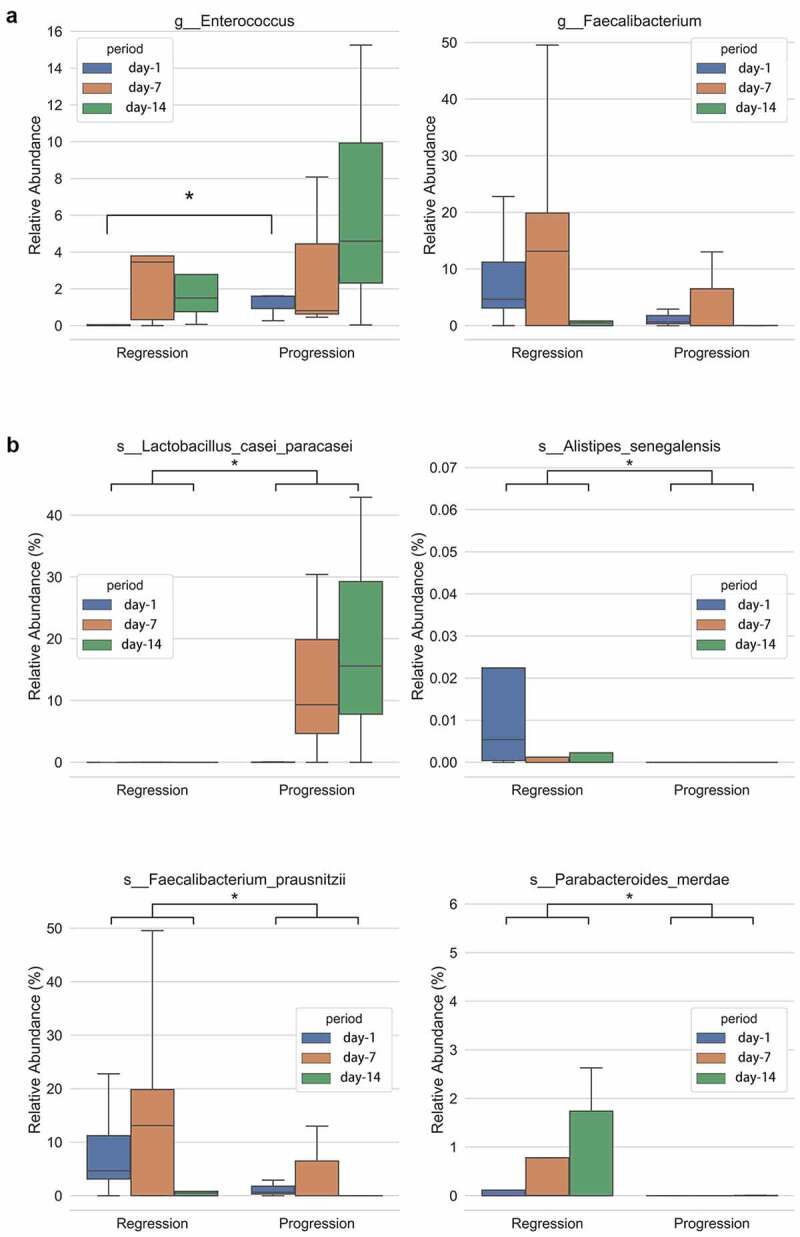
Difference of gut microbiota between the progression and regression groups. Relative abundance of genus at day-1 (fecal sample collected at day 1 after admission), day 7 and day 14 between the progression and regression group of HBV-ACLF. (a) Enterococcus and Faecalibacterium, and (b) species Lactobacillus casei paracasei, Alistipes senegalensis, Faecalibacterium prausnitzii and Parabacteroides merdae. *P < .05
The time series samples of HBV-ACLF patients
The dynamic change of gut bacteria in patients with liver failure is an important indicator to predict the optimal time to introduce therapeutic interventions and to adjust follow-up treatments. We performed the time series samples analysis on day 1, 7 and 14 upon patient admission by metagenomic sequencing and the dynamic changes of MELD score of these patients within 14 days were shown in Supplemental Table 2. The results showed that the richness of Lactobacillus casei paracasei was significantly higher in the progression group compared with the regression group (P < .05); while the richness of Alistipes senegalensis, Faecalibacterium prausnitzii and Parabacteroides merdae were significantly higher in the regression group (P < .05, Figure 5(b)). The results of Faecalibacterium prausnitzii were consistent with the 16sRNA sequencing results that genus Faecalibacterium was higher in the regression group. Further analysis revealed that the regression group had a small increase in the richness of Enterococcus faecium, while the progression group had a marked increase in the richness of Enterococcus faecium during the period of 14 days. Importantly, the richness of Enterococcus was significantly higher in the progression group than the regression group in day 1 (Figure 5(a)).
Bayes network analysis to identify the key species of gut microbiota differences
Finally, the key species of gut microbiota which were different between the progression group and the regression group were identified using Bayes network analysis. We used “degree” value to express the importance of this bacterium. As shown in Tables 3, 7 species (Streptococcus vestibularis, Peptostreptococcus unclassified, Scardovia unclassified, Prevotella salivae, Prevotella histicola, Actinomyces odontolyticus, Streptococcus parasanguinis) were enriched in the regression group while three species (Ruminococcus obeum, Dorea longicatena, Clostridium citroniae) were enriched in the progression group. These results were further validated by qPCR (Figure 6). Consistently, the progression group of HBV-ACLF exhibited significantly abundant Enterococcus faecium and Lactobacillus casei paracasei, while the regression group presented significantly abundant Faecalibacterium prausnitzii, Clostridium citroniae and Dorea longicatena.
Table 3.
Bayes network analysis to identify the key species responsible for gut microbiota differences
| Regression | Degree |
|---|---|
| k__Bacteria|p__Firmicutes|c__Bacilli|o__Lactobacillales|f__Streptococcaceae|g__Streptococcus|s__Streptococcus_vestibularis | 35 |
| k__Bacteria|p__Firmicutes|c__Clostridia|o__Clostridiales|f__Peptostreptococcaceae|g__Peptostreptococcus|s__Peptostreptococcus_unclassified | 31 |
| k__Bacteria|p__Actinobacteria|c__Actinobacteria|o__Bifidobacteriales|f__Bifidobacteriaceae|g__Scardovia|s__Scardovia_unclassified | 30 |
| k__Bacteria|p__Bacteroidetes|c__Bacteroidia|o__Bacteroidales|f__Prevotellaceae|g__Prevotella|s__Prevotella_salivae | 24 |
| k__Bacteria|p__Bacteroidetes|c__Bacteroidia|o__Bacteroidales|f__Prevotellaceae|g__Prevotella|s__Prevotella_histicola | 17 |
| k__Bacteria|p__Actinobacteria|c__Actinobacteria|o__Actinomycetales|f__Actinomycetaceae|g__Actinomyces|s__Actinomyces_odontolyticus | 12 |
| k__Bacteria|p__Firmicutes|c__Bacilli|o__Lactobacillales|f__Streptococcaceae|g__Streptococcus|s__Streptococcus_parasanguinis | 11 |
| Progression | Degree |
| k__Bacteria|p__Firmicutes|c__Clostridia|o__Clostridiales|f__Lachnospiraceae|g__Blautia|s__Ruminococcus_obeum | 53 |
| k__Bacteria|p__Firmicutes|c__Clostridia|o__Clostridiales|f__Lachnospiraceae|g__Dorea|s__Dorea_longicatena | 53 |
| k__Bacteria|p__Firmicutes|c__Clostridia|o__Clostridiales|f__Clostridiaceae|g__Clostridium|s__Clostridium_citroniae | 51 |
“Degree” refers to the number of adjacent nodes of each node in the network, which refers to the number of potential microorganisms interacting with specific microorganisms.
Figure 6.
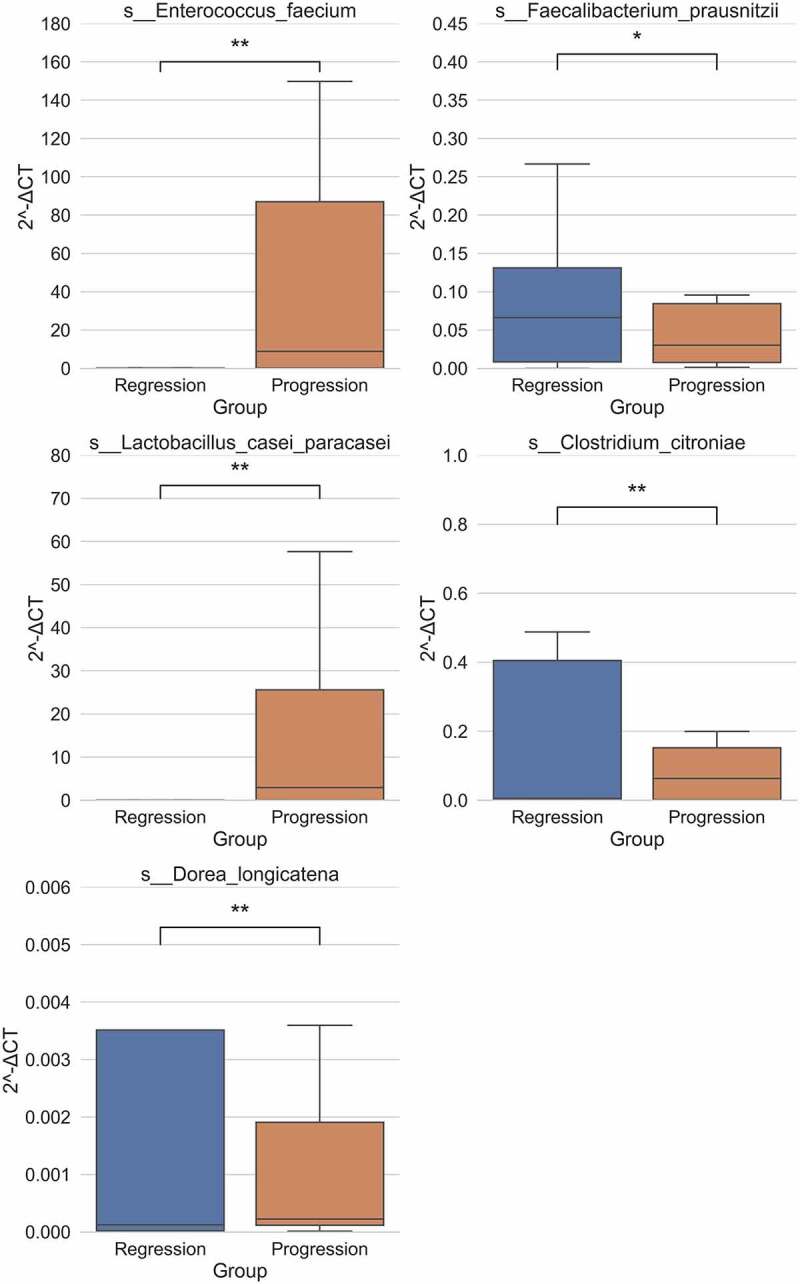
The key species of different gut microbiota were further validated by qPCR. qPCR validation of the relative abundance of Enterococcus faecium, Faecalibacterium prausnitzii, Lactobacillus casei paracasei, Clostridium citroniae and Dorea longicatena between progression and regression group of HBV-ACLF. **P < .01
Discussion
In this study, we investigated the gut microbiota in patients with HBV-ACLF, HBV-Other (CHB, HBV-LC) and healthy individuals and our analysis demonstrated a significant difference in microbiota diversity among the HBV-ACLF, HBV-Other and healthy groups. The ratio of cocci to bacilli was significantly elevated in the HBV-ACLF group compared with the healthy group. We further identified 52 genera with different richness in the HBV-ACLF progression and regression groups. The progression group showed a high relative abundance of Enterococcus, while the regression group presented a high relative abundance Faecalibacterium. Further, metagenomic sequencing showed that the richness of Lactobacillus casei paracasei was significantly higher in the progression group than in the regression group, while Alistipes senegalensis, Faecalibacterium prausnitzii, and Parabacteroides merdae showed a significantly higher richness in the regression group than in the progression group. Further analysis revealed that Enterococcus faecium exhibited a rapid increase during the disease progression of HBV-ACLF. Taking together, these findings highlighted an important role for the composition of gut microbiota in the progression of HBV-ACLF which has important clinical implications.
Consistent with a previous report,17 our results demonstrated that gut microbiota diversity and richness were different among the HBV-ACLF group, HBV-Other group and the healthy group. Adonis analysis showed that multiple clinical/demographic variables may contribute to the differences of gut microbiota among the 3 groups, suggesting that the composition of gut microbiota was affected by multiple factors. Nevertheless, how individual factors contribute to the composition of the gut microbiota warrant further investigation.
Enterococcus is an intestinal symbiotic bacterium in healthy individuals and is emerging as an infectious drug-resistant pathogen.31 It has been shown that the levels of Enterococcus were elevated in CHB and liver cirrhosis patients.32 Our 16S rRNA sequencing showed that the ACLF progression group had a higher relative abundance of Enterococcus than the regression group, indicating Enterococcus may contribute to the progression of HBV-ACLF. Moreover, in the dynamic series of samples analysis, it was found that a small increase in the richness of Enterococcus faecium was associated with the regression of HBV-ACLF, while a marked increase was associated with the progression of HBV-ACLF, supporting a crucial role for Enterococcus richness in the disease progression of HBV- ACLF.
Faecalibacterium prausnitzii accounts for approximately 5% of total fecal microbiota in healthy adults.33 Faecalibacterium prausnitzii depletion has been associated with several intestinal disorders including inflammatory bowel diseases,34 chronic intestinal inflammatory disorder,35 and colorectal cancer.36 Lu et al. showed that the abundance of Faecalibacterium prausnitzii decreased in HBV-LC patients.37 Our metagenomic sequencing showed that the abundance of Faecalibacterium prausnitzii was significantly increased in the regression group of HBV-ACLF patients, indicating that Faecalibacterium prausnitzii may be a beneficial factor of HBV-ACLF. Consistently, Enterococcus was increased in the progression group and Faecalibacterium was increased in the regression group, confirming the data generated by 16S rRNA sequencing and metagenomic sequencing were highly convincing.
Clinically, the cocci to bacilli ratio of the fecal sample is often tested in HBV-ACLF patients. Most of the them showed the imbalance of cocci and bacilli, suggesting intestinal infection or gut microbiota disorder.27,38 Likewise, in this study, the cocci to bacilli ratio was significantly elevated in the HBV-ACLF group, suggesting that the HBV-ACLF patients may have cocci infection. Furthermore, this study detected an increase of Enterococcus but a decrease of Faecalibacterium in the progression HBV-ACLF group, consistent with the increased cocci to bacilli ratio in clinical findings.
Lactobacillus casei paracasei is one of the most studied and applied probiotic species of Lactobacilli.39 Nevertheless, we found that the progression group showed a higher relative abundance of Lactobacillus casei paracasei compared with the regression group, suggesting that Lactobacillus casei paracasei was associated with disease progression in HBV-ACLF and seemed contradictory to its probiotic function. Since the composition of gut microbiota is influenced by multiple factors and context dependent, the same bacterial species may play distinctive roles in different intestinal states. Therefore, the exact role of Lactobacillus casei paracasei in the progression of HBV-ACLF requires further characterization.
In the analyses of the correlation between the blood biochemical indicators and gut microbiota, we found 5 genera were associated with ALT and AST (liver inflammation); 3 genera were associated with TBIL, INR, and MELD (liver disease severity); and 2 genera were associated with WBC, NEUT% and PCT (degree of infection). These results have the potential to inform the use of intestinal microbial intervention to alleviate or prevent the progression of liver disease. Nevertheless, the precise causal relationships between these intestinal bacteria and biochemical parameters still require further investigation. Likewise, in our Bayes network analysis, 7 species elevated in the regression group and 3 species enriched in the progression group and the roles of these intestinal bacteria and how they contribute to disease progression remain to be investigated.
There are still some limitations to this study. First, the differences in patients’ antibiotic used before and after admission, personal alcohol drinking history, may have an impact on the results of the microbiota.40 Secondly, the immune function and severity of liver failure at the time of admission were not consistent among the groups. Thirdly, considering the gastrointestinal symptoms (proton pump inhibitors used) and possible hepatic encephalopathy of the patients, the diet during the hospitalization was mainly based on digestible low-protein and low-fat carbohydrates, which may affect the results of microbiota.41 Therefore, a well-designed prospective study should be conducted to validate our findings.
Our study demonstrated that the composition of gut microbiota changed at different phases of HBV-ACLF. High abundance of Enterococcus is associated with progression while high abundance of Faecalibacterium is associated with regression of HBV-ACLF, which is consistent with the high ratio of cocci to bacilli in HBV-ACLF patients and clinical imaging findings. The gut microbiome in HBV-ACLF patients may provide a useful prognosis marker for disease progression. Further studies should be conducted to characterize the exact roles of these gut microbiota in the progression of HBV-ACLF.
Materials and methods
Study subject
One thousand five hundred and three participants admitted to the Third Affiliated Hospital of Sun Yat-sen University were recruited for this study between October 2017 and November 2018 including patients with CHB (n = 252), HBV-LC (n = 162) and HBV-ACLF (n = 212) and healthy individuals (n = 877, from the physical examination center of the hospital). To characterize the gut microbiota, CHB and HBV-LC patients were combined and defined as the HBV-Other group. Comparative analysis was conducted among the HBV-ACLF (progression + regression) group, HBV-Other group and the healthy group. This study was approved by the institutional review board of our hospital. Written informed consent was obtained from the participants. The Medical Ethics Committee, Third Affiliated Hospital of Sun Yat-sen University (ID[2018]02–018-01).
All enrolled patients were hospitalized with HBsAg positive for > 6 months. For CHB patients, the inclusion criteria were: alanine transaminase (ALT) ≥ 5 upper limit of the normal (ULN), total bilirubin (TBIL) ≥ 2 ULN, international normalized ratio (INR) < 1.5, imaging findings (abdominal ultrasound, CT or abdominal MRI) did not support cirrhotic change. For HBV-LC patients, the inclusion criteria were: ALT ≥ 2 ULN, TBIL ≥ 2 ULN, INR < 1.5, imaging findings supported cirrhotic changes. HBV-ACLF was diagnosed according to the 2014 APASL diagnostic guidelines (TBIL > 5 ULN, INR > 1.5, with ascites or hepatic encephalopathy symptoms within 2 weeks). The model for eend-stageliver disease (MELD) score was used to judge whether the patients with HBV-ACLF were improved or deteriorated, named regression group and progression group, respectively.42,43
Participants’ demographic and clinical characteristics are summarized in Table 4. Age, white blood cell count, neutrophil percentage, aspartate aminotransferase, alanine aminotransferase, total bilirubin, international normalized ratio (coagulation function), procalcitonin and end-stage liver disease model were significantly different among groups.
Table 4.
Demographic and clinical characteristics participants
| Parameter | Healthy | HBV-Other |
HBV-ACLF |
P value | ||
|---|---|---|---|---|---|---|
| CHB | HBV-LC | Progression | Regression | |||
| Case number | 877 | 252 | 162 | 47 | 165 | |
| Age (years) | 27.75 ± 0.51 | 38.02 ± 0.66 | 49.02 ± 0.75 | 44.55 ± 1.55 | 44.22 ± 0.82 | <0.001 |
| Gender (Male/Female) | 474/403 | 209/43 | 130/32 | Mar-44 | 143/22 | 0.199 |
| WBC(×10E9/L) | 5.57 ± 0.02 | 6.05 ± 0.14 | 4.47 ± 0.18 | 6.88 ± 0.4 | 6.94 ± 0.25 | <0.001 |
| NEUT% (No.) | 54.15 ± 0.16 | 58.47 ± 0.8 | 61.7 ± 0.95 | 68.66 ± 1.54 | 67.48 ± 0.84 | <0.001 |
| AST (IU/L) | 22.3 ± 0.13 | 348.83 ± 23.14 | 104.48 ± 14.68 | 371.23 ± 73.55 | 385.57 ± 39.06 | <0.001 |
| ALT (IU/L) | 22.6 ± 0.12 | 664.27 ± 47.09 | 110.32 ± 22.23 | 400.34 ± 87.79 | 562.04 ± 56.15 | <0.001 |
| TBIL (umol/L) | 13.18 ± 0.07 | 99.52 ± 7.94 | 57.88 ± 7.33 | 416.36 ± 23.42 | 313.21 ± 11.37 | <0.001 |
| INR (No.) | - | 1.19 ± 0.01 | 1.44 ± 0.03 | 2.73 ± 0.13 | 2.25 ± 0.08 | <0.001 |
| PCT (ng/ml) | - | 0.24 ± 0.03 | 0.41 + 1.83 | 1.33 ± 0.37 | 0.98 ± 0.1 | <0.001 |
| MELD | - | 12.86 ± 0.33 | 13.3 ± 0.36 | 29.3 ± 0.63 | 25.99 ± 0.34 | <0.001 |
CHB, chronic hepatitis B; HBV-LC, HBV-associated cirrhosis; HBV-ACLF, hepatitis B virus related acute-on-chronic liver failure; WBC, white blood cell count; NEUT%, neutrophil percentage; AST, aspartate aminotransferase; ALT, alanine transaminase; TBIL, total bilirubin; INR, international normalized ratio; PCT, procalcitonin; MELD, the model for end-stage liver disease.
For ethical reasons, we did not distinguish patients whether they had received antibiotics, anti-hepatitis B virus and other treatments before admission. The attending doctor was free to conduct relevant medical treatment based on clinical diagnosis post-admission. HBV-ACLF patients after admission have been routinely supplied with low-protein, low-fat diets and easily digestible carbohydrates. The use of antibiotics was only provided with symptoms including fever, abdominal pain, diarrhea, imaging based biliary infections as well as the level and ratio of white blood cells and neutrophils and procalcitonin (PCT).
16S rRNA sequencing
To analyze the gut microbiota, fecal samples of the participants were collected for 16S rRNA sequencing. The genomic bacterial DNA was extracted using Fecal Microbial Genomic DNA Extraction Kit (LS-R-N-015, Longsee biomedical corporation, China). The forward primer: 338 F (5’-ACTCCTACGGGAGGCAGCA-3’) and reverse primer: 806 R (5’-GGACTACHVGGGTWTCTAAT-3’) and sample-specific barcode sequence were used to amplify the V3-V4 highly variable region of the 16S rRNA gene (around 480 bp). The 16S rRNA was PCR-amplified by using Q5® High-Fidelity DNA Polymerase (M0491, NEB, USA) according to manufacturer’s protocol. Sequencing was performed by MiSeq Reagent Kit V3 (MS-102-3003, Illumina Inc., USA) using a MiSeq-PE250 sequencer (Illumina).
Bioinformatic analysis of the bacterial 16S rRNA amplicon data was conducted using a custom QIIME2 software pipeline (https://qiime2.org). Sequence quality control and filtering were conducted by FastQC v.0.11.2 and Trimmomatic v.0.32, followed by feature table construction by dada2 (Qiime2). The taxonomy of each 16S rRNA gene sequence was assigned by q2-feature-classifier (Qiime2). Pre-trained Naive Bayes taxonomy classifier gg-13-8-99-515-806-nb-classifier was used in the classification.
Metagenomic sequencing
Genomic bacterial DNA was extracted using Fecal Microbial Genomic DNA Extraction Kit (LS-R-N-015, Longsee biomedical corporation, China). PCR-amplification was performed using KAPA Hyper Plus Kit (KK8510, Kapa Biosystems, USA) and KAPA Dual-Indexed Adapter Kit (KK8722, Kapa Biosystems) followed by sequencing using NextSeq 500/550 High Output Kit v2.5 (Illumina). All procedures were performed according to the manufacturer’s protocol.
For Tagenomic Sequencing Bioinformatics Analysis, sequence quality control and filtering were conducted by fastp v.0.20.0. Human genome (hg38) sequence was filtered by bowtie2. Taxonomy analysis was performed by using MetaPhlAn2 (http://huttenhower.sph.harvard.edu/metaphlan2). To identify specific species contributing to the differential genera between groups, we included 8 patients with complete HBV-ACLF (including 5 cases of regression and 3 cases of progression) for metagenomic sequencing. Fecal samples were collected at day 1 (Day-1), day 7 (Day-7) and day 14 (Day-14) after admission.
qPCR validation and cross validation
Quantitative real-time PCR was used to quantify the species to validate the sequencing results. Primers were presented in Supplemental Table 3. The qPCR was performed according to the PrimeScriptTM RT Reagent Kit (TAKAA). Reactions were performed on a LightCycler® System (Roche, Germany) as follows: 95°C for 3 min, followed by 40 cycles of 95°C for 5 s and 60°C for 15 s. The relative mRNA levels of target samples to control samples were calculated according to 2−ΔΔCt method, in which the difference in Ct values (ΔCt) between the target gene and the reference gene (16S rDNA) was calculated for normalization and the ΔCt of the different samples was compared directly (ΔΔCt). And data were expressed as least square means ± standard error of the mean (S.E.M.).
Cross validation was used for further internal validation. We sorted out the current 16S rDNA sample collection time, which were regression group (n = 165 patients) and progression group (n = 47 patients). The samples received earlier than February 1, 2018 (n = 84, regression group = 63, progression group = 21) were used as the discovery subset, and the samples received later than February 1, 2018 (n = 128, regression group = 102, progression group = 26) were used as the validation subset.
Statistical analysis
Mann–Whitney U test, Kruskal–Wallis test by ranks and LEfSe (Linear discriminant analysis Effect Size) analysis were conducted to identify different genus between groups. A Random Forest regressor was used to figure the genus related to certain clinical indicators by regression model’s feature importance. Meanwhile, a classification model was adopted to identify a small genus set with good discriminatory power. A classification model for the healthy, CHB, HBV-LC and HBV-ACLF groups was established by using the Random Forest classifier according to the relative abundance of each genus of gut microbiota. In the model tuning process, a grid search was adopted for hyperparameter tuning, and the best score was used. Bayes network analysis was performed to figure out interaction between each species and the source of turbulence of the microbe community.44 Adonis (Multivariate Analysis Of Variance Using Distance Matrices) was conducted to figure the correlation between the clinical indicators and the richness of the gut microbe. Cross validation was conducted for the internal validation test. A P value < .05 was considered significantly different between groups. In the figures * denotes p < .05, **denotes p < .01, ***denotes p < .001, n.s. denotes non-significant.
Supplementary Material
Acknowledgements and funding
This work was supported by National Science and Technology Major Project (No. 2018ZX10302204), the National Natural Science Foundation of China (No. 81672701 and No. 81700528), Guangdong Basic and Applied Basic Research Foundation (No. 2019A1515110338), the Youth Innovation Project of Guangdong Province (No. 2018KQNCX101), the Science and Technology Program of Guangzhou (No. 202010060012).
Abbreviations
ACLF: Acute-on-chronic liver failure; HBV: Hepatitis B Virus; HBV-ACLF: HBV-associated ACLF; CHB: chronic hepatitis B; HBV-LC: HBV-associated cirrhosis; ALT: alanine transaminase; ULN: upper limit of the normal; TBIL: total bilirubin; INR: international normalized ratio; PCT: procalcitonin; MELD: the Model for End-Stage Liver Disease; AST: aspartate aminotransferase; WBC: white blood cell count; NEUT%: neutrophil percentage.
Disclosure of potential conflict of interest
No potential conflicts of interest were disclosed.
Authors’ contributions
Ke Wang, Zhao Zhang, Tao Chen and Zhi-Liang Gao designed the experiments, Ke Wang, Zhao Zhang, Zhi-Shuo Mo and Xiao-Hua Yang performed them. Ke Wang, Zhao Zhang, Zhi-Shuo Mo, Yang Xu, Ling Lv, Chun-Yan Lei and Xiao-Hua Yang collected and analyzed the data. The drafting of the manuscript was write by Ke Wang and Zhao Zhang, which was further Modification by Rui-Fu Yang and Zhi-Liang Gao. The clinical sample and information were obtained by Zhi-Shuo Mo, Xiao-Hua Yang, Bing-Liang Lin, Liang Peng. The technical, material and financial support were provided by Ke Wang, Zhao Zhang, Tao Chen, Xiao-Dong Zhuang and Zhi-Liang Gao.
Supplementary Material
Supplemental data for this article can be accessed on the publisher’s website.
References
- 1.Zhao RH, Shi Y, Zhao H, Wu W, Sheng JF.. Acute-on-chronic liver failure in chronic hepatitis B: an update. Expert Rev Gastroenterol Hepatol. 2018;12(4):341–15. doi: 10.1080/17474124.2018.1426459. [DOI] [PubMed] [Google Scholar]
- 2.Li H, Chen LY, Zhang NN, Li ST, Zeng B, Pavesi M, Amoros A, Mookerjee RP, Xia Q, Xue F, et al. Characteristics, diagnosis and prognosis of acute-on-chronic liver failure in cirrhosis associated to hepatitis B. Sci Rep. 2016;6:25487. doi: 10.1038/srep25487. [DOI] [PMC free article] [PubMed] [Google Scholar]
- 3.Shi Y, Yang Y, Hu Y, Wu W, Yang Q, Zheng M, Zhang S, Xu Z, Wu Y, Yan H, et al. Acute-on-chronic liver failure precipitated by hepatic injury is distinct from that precipitated by extrahepatic insults. Hepatology. 2015;62(1):232–242. doi: 10.1002/hep.27795. [DOI] [PubMed] [Google Scholar]
- 4.Zheng MH, Shi KQ, Fan YC, Li H, Ye C, Chen QQ, Chen YP. A model to determine 3-month mortality risk in patients with acute-on-chronic hepatitis B liver failure. Clin Gastroenterol Hepatol. 2011;9(4):351–6 e3. doi: 10.1016/j.cgh.2010.12.027. [DOI] [PubMed] [Google Scholar]
- 5.Thursby E, Juge N. Introduction to the human gut microbiota. Biochem J. 2017;474(11):1823–1836. doi: 10.1042/BCJ20160510. [DOI] [PMC free article] [PubMed] [Google Scholar]
- 6.Backhed F, Ley RE, Sonnenburg JL, Peterson DA, Gordon JI. Host-bacterial mutualism in the human intestine. Science. 2005;307(5717):1915–1920. doi: 10.1126/science.1104816. [DOI] [PubMed] [Google Scholar]
- 7.Hold GL, Hansen R. Impact of the gastrointestinal microbiome in health and disease: co-evolution with the host immune system. Curr Top Microbiol Immunol. 2019;421:303–318. doi: 10.1007/978-3-030-15138-6_12. [DOI] [PubMed] [Google Scholar]
- 8.Boullier S, Tanguy M, Kadaoui KA, Caubet C, Sansonetti P, Corthesy B, Phalipon A. Secretory IgA-mediated neutralization of Shigella flexneri prevents intestinal tissue destruction by down-regulating inflammatory circuits. J Immunol. 2009;183(9):5879–5885. doi: 10.4049/jimmunol.0901838. [DOI] [PubMed] [Google Scholar]
- 9.Guarner F, Malagelada J-R. Gut flora in health and disease. Lancet. 2003;361(9356):512–519. doi: 10.1016/S0140-6736(03)12489-0. [DOI] [PubMed] [Google Scholar]
- 10.Biagi E, Rampelli S, Turroni S, Quercia S, Candela M, Brigidi P. The gut microbiota of centenarians: signatures of longevity in the gut microbiota profile. Mech Ageing Dev. 2017;165(Pt B):180–184. doi: 10.1016/j.mad.2016.12.013. [DOI] [PubMed] [Google Scholar]
- 11.Chen L, Zhang YH, Huang T, Cai YD. Gene expression profiling gut microbiota in different races of humans. Sci Rep. 2016;6:23075. doi: 10.1038/srep23075. [DOI] [PMC free article] [PubMed] [Google Scholar]
- 12.Odamaki T, Kato K, Sugahara H, Hashikura N, Takahashi S, Xiao JZ, Abe F, Osawa R. Age-related changes in gut microbiota composition from newborn to centenarian: a cross-sectional study. BMC Microbiol. 2016;16:90. doi: 10.1186/s12866-016-0708-5. [DOI] [PMC free article] [PubMed] [Google Scholar]
- 13.Flint HJ, Duncan SH, Scott KP, Louis P. Interactions and competition within the microbial community of the human colon: links between diet and health. Environ Microbiol. 2007;9(5):1101–1111. doi: 10.1111/j.1462-2920.2007.01281.x. [DOI] [PubMed] [Google Scholar]
- 14.Macfarlane GT, Steed H, Macfarlane S. Bacterial metabolism and health-related effects of galacto-oligosaccharides and other prebiotics. J Appl Microbiol. 2008;104(2):305–344. doi: 10.1111/j.1365-2672.2007.03520.x. [DOI] [PubMed] [Google Scholar]
- 15.Clemente JC, Ursell LK, Parfrey LW, Knight R. The impact of the gut microbiota on human health: an integrative view. Cell. 2012;148(6):1258–1270. doi: 10.1016/j.cell.2012.01.035. [DOI] [PMC free article] [PubMed] [Google Scholar]
- 16.Sekirov I, Russell SL, Antunes LC, Finlay BB. Gut microbiota in health and disease. Physiol Rev. 2010;90(3):859–904. doi: 10.1152/physrev.00045.2009. [DOI] [PubMed] [Google Scholar]
- 17.Chen Y, Guo J, Qian G, Fang D, Shi D, Guo L, Li L. Gut dysbiosis in acute-on-chronic liver failure and its predictive value for mortality. J Gastroenterol Hepatol. 2015;30(9):1429–1437. doi: 10.1111/jgh.12932. [DOI] [PubMed] [Google Scholar]
- 18.Sandler NG, Koh C, Roque A, Eccleston JL, Siegel RB, Demino M, Kleiner DE, Deeks SG, Liang TJ, Heller T, et al. Host response to translocated microbial products predicts outcomes of patients with HBV or HCV infection. Gastroenterology. 2011;141(4):1220–30, 30.e1-3. doi: 10.1053/j.gastro.2011.06.063. [DOI] [PMC free article] [PubMed] [Google Scholar]
- 19.Giannelli V, Di Gregorio V, Iebba V, Giusto M, Schippa S, Merli M, Thalheimer U. Microbiota and the gut-liver axis: bacterial translocation, inflammation and infection in cirrhosis. World J Gastroenterol. 2014;20(45):16795–16810. doi: 10.3748/wjg.v20.i45.16795. [DOI] [PMC free article] [PubMed] [Google Scholar]
- 20.Zeuzem S. Gut-liver axis. Int J Colorectal Dis. 2000;15(2):59–82. doi: 10.1007/s003840050236. [DOI] [PubMed] [Google Scholar]
- 21.Han DW. Intestinal endotoxemia as a pathogenetic mechanism in liver failure. World J Gastroenterol. 2002;8(6):961–965. doi: 10.3748/wjg.v8.i6.961. [DOI] [PMC free article] [PubMed] [Google Scholar]
- 22.Palma P, Mihaljevic N, Hasenberg T, Keese M, Koeppel TA. Intestinal barrier dysfunction in developing liver cirrhosis: an in vivo analysis of bacterial translocation. Hepatol Res. 2007;37(1):6–12. doi: 10.1111/j.1872-034X.2007.00004.x. [DOI] [PubMed] [Google Scholar]
- 23.Ramachandran A, Balasubramanian KA. Intestinal dysfunction in liver cirrhosis: its role in spontaneous bacterial peritonitis. J Gastroenterol Hepatol. 2001;16(6):607–612. doi: 10.1046/j.1440-1746.2001.02444.x. [DOI] [PubMed] [Google Scholar]
- 24.Liu JE, Zhang Y, Zhang J, Dong PL, Chen M, Duan ZP. Probiotic yogurt effects on intestinal flora of patients with chronic liver disease. Nurs Res. 2010;59(6):426–432. doi: 10.1097/NNR.0b013e3181fa4dc6. [DOI] [PubMed] [Google Scholar]
- 25.Liu Q, Duan ZP, Ha DK, Bengmark S, Kurtovic J, Riordan SM. Synbiotic modulation of gut flora: effect on minimal hepatic encephalopathy in patients with cirrhosis. Hepatology. 2004;39(5):1441–1449. doi: 10.1002/hep.20194. [DOI] [PubMed] [Google Scholar]
- 26.Shukla S, Shukla A, Mehboob S, Guha S. Meta-analysis: the effects of gut flora modulation using prebiotics, probiotics and synbiotics on minimal hepatic encephalopathy. Aliment Pharmacol Ther. 2011;33(6):662–671. doi: 10.1111/j.1365-2036.2010.04574.x. [DOI] [PubMed] [Google Scholar]
- 27.Mariat D, Firmesse O, Levenez F, Guimaraes V, Sokol H, Dore J, Corthier G, Furet JP. The firmicutes/bacteroidetes ratio of the human microbiota changes with age. BMC Microbiol. 2009;9:123. doi: 10.1186/1471-2180-9-123. [DOI] [PMC free article] [PubMed] [Google Scholar]
- 28.Liu Q, Li F, Zhuang Y, Xu J, Wang J, Mao X, Zhang Y, Liu X. Alteration in gut microbiota associated with hepatitis B and non-hepatitis virus related hepatocellular carcinoma. Gut Pathog. 2019;11:1. doi: 10.1186/s13099-018-0281-6. [DOI] [PMC free article] [PubMed] [Google Scholar]
- 29.Ren YD, Ye ZS, Yang LZ, Jin LX, Wei WJ, Deng YY, Chen XX, Xiao CX, Yu XF, Xu HZ, et al. Fecal microbiota transplantation induces hepatitis B virus e-antigen (HBeAg) clearance in patients with positive HBeAg after long-term antiviral therapy. Hepatology. 2017;65(5):1765–1768. doi: 10.1002/hep.29008. [DOI] [PubMed] [Google Scholar]
- 30.Yun Y, Chang Y, Kim HN, Ryu S, Kwon MJ, Cho YK, Kim HL, Cheong HS, Joo EJ. Alterations of the gut microbiome in chronic hepatitis B virus infection associated with alanine aminotransferase level. J Clin Med. 2019;8:2. doi: 10.3390/jcm8020173. [DOI] [PMC free article] [PubMed] [Google Scholar]
- 31.Low DE, Keller N, Barth A, Jones RN. Clinical prevalence, antimicrobial susceptibility, and geographic resistance patterns of enterococci: results from the SENTRY antimicrobial surveillance program, 1997–1999. Clin Infect Dis. 2001;32(Suppl 2):S133–45. doi: 10.1086/320185. [DOI] [PubMed] [Google Scholar]
- 32.Mou H, Yang F, Zhou J, Bao C. Correlation of liver function with intestinal flora, vitamin deficiency and IL-17A in patients with liver cirrhosis. Exp Ther Med. 2018;16(5):4082–4088. doi: 10.3892/etm.2018.6663. [DOI] [PMC free article] [PubMed] [Google Scholar]
- 33.Hold GL, Schwiertz A, Aminov RI, Blaut M, Flint HJ. Oligonucleotide probes that detect quantitatively significant groups of butyrate-producing bacteria in human feces. Appl Environ Microbiol. 2003;69(7):4320–4324. doi: 10.1128/AEM.69.7.4320-4324.2003. [DOI] [PMC free article] [PubMed] [Google Scholar]
- 34.Sokol H, Pigneur B, Watterlot L, Lakhdari O, Bermudez-Humaran LG, Gratadoux JJ, Blugeon S, Bridonneau C, Furet JP, Corthier G, et al. Faecalibacterium prausnitzii is an anti-inflammatory commensal bacterium identified by gut microbiota analysis of Crohn disease patients. Proc Natl Acad Sci U S A. 2008;105(43):16731–16736. doi: 10.1073/pnas.0804812105. [DOI] [PMC free article] [PubMed] [Google Scholar]
- 35.De Palma G, Nadal I, Medina M, Donat E, Ribes-Koninckx C, Calabuig M, Sanz Y. Intestinal dysbiosis and reduced immunoglobulin-coated bacteria associated with coeliac disease in children. BMC Microbiol. 2010;10:63. doi: 10.1186/1471-2180-10-63. [DOI] [PMC free article] [PubMed] [Google Scholar]
- 36.Balamurugan R, Rajendiran E, George S, Samuel GV, Ramakrishna BS. Real-time polymerase chain reaction quantification of specific butyrate-producing bacteria, Desulfovibrio and Enterococcus faecalis in the feces of patients with colorectal cancer. J Gastroenterol Hepatol. 2008;23(8 Pt 1):1298–1303. doi: 10.1111/j.1440-1746.2008.05490.x. [DOI] [PubMed] [Google Scholar]
- 37.Lu H, Wu Z, Xu W, Yang J, Chen Y, Li L. Intestinal microbiota was assessed in cirrhotic patients with hepatitis B virus infection. Intestinal microbiota of HBV cirrhotic patients. Microb Ecol. 2011;61(3):693–703. doi: 10.1007/s00248-010-9801-8. [DOI] [PubMed] [Google Scholar]
- 38.Zhang Y, Zhao R, Shi D, Sun S, Ren H, Zhao H, Wu W, Jin L, Sheng J, Shi Y. Characterization of the circulating microbiome in acute-on-chronic liver failure associated with hepatitis B. Liver Int. 2019. doi: 10.1111/liv.14097. [DOI] [PubMed] [Google Scholar]
- 39.Hill D, Sugrue I, Tobin C, Hill C, Stanton C, Ross RP. The Lactobacillus casei Group: history and health related applications. Front Microbiol. 2018;9:2107. doi: 10.3389/fmicb.2018.02107. [DOI] [PMC free article] [PubMed] [Google Scholar]
- 40.Cassard AM, Gerard P, Perlemuter G. Microbiota, liver diseases, and alcohol. Microbiol Spectr. 2017;5:4. doi: 10.1128/microbiolspec.BAD-0007-2016. [DOI] [PMC free article] [PubMed] [Google Scholar]
- 41.Macke L, Schulz C, Koletzko L, Malfertheiner P. Systematic review: the effects of proton pump inhibitors on the microbiome of the digestive tract-evidence from next-generation sequencing studies. Aliment Pharmacol Ther. 2020;51(5):505–526. doi: 10.1111/apt.15604 [DOI] [PubMed] [Google Scholar]
- 42.Kamath PS, Wiesner RH, Malinchoc M, Kremers W, Therneau TM, Kosberg CL, D'Amico G, Dickson ER, Kim WR. A model to predict survival in patients with end-stage liver disease. Hepatology. 2001;33(2):464–470. doi: 10.1053/jhep.2001.22172 [DOI] [PubMed] [Google Scholar]
- 43.Zheng Y-B, Xie D-Y, Gu Y-R, Yan Y, Wu Y-B, Lei Z-Y, Peng L, Xie S-B, Gao Z-L, Ke W-M, et al. Development of a sensitive prognostic scoring system for the evaluation of severity of acute-on-chronic hepatitis B liver failure: a retrospective cohort study. Clin Invest Med. 2012;35(2):E75–85. doi: 10.25011/cim.v35i2.16291. [DOI] [PubMed] [Google Scholar]
- 44.Morrissey ER. GRENITS: gene regulatory network inference using time series. Systems Biology Doctoral Training Centre; 2011. [Google Scholar]
Associated Data
This section collects any data citations, data availability statements, or supplementary materials included in this article.